Unequal benefits of growth in viet nam
Bạn đang xem bản rút gọn của tài liệu. Xem và tải ngay bản đầy đủ của tài liệu tại đây (61.68 KB, 9 trang )
ERD POLICY BRIEF SERIES
Economics and Research Department
Number 3
Unequal Benefits
of Growth in Viet Nam
Indu Bhushan
Erik Bloom
and Nguyen Minh Thang
Asian Development Bank
The ERD Policy Brief Series is based on papers or notes prepared
by ADB staff and their resource persons. The series is designed to
provide concise nontechnical accounts of policy issues of topical
interest to ADB management, Board of Directors, and staff. Though
prepared primarily for internal readership within the ADB, the series
may be accessed by interested external readers. Feedback is
welcome via e-mail (). The views expressed
herein are those of the authors and do not necessarily reflect the
views or policies of the ADB.
ERD POLICY BRIEF NO. 3
Unequal Benefits of Growth
in Viet Nam
Indu Bhushan, Erik Bloom
and Nguyen Minh Thang*
First printing January 2002
Reprinted February 2002
* Indu Bhushan is Senior Project Economist and Erik Bloom is Economist at the
Mekong Department, and Nguyen Minh Thang is a consultant on human
development. This brief is based on I. Bhushan, E. Bloom, N. H. Huu, and N. M.
Thang. 2001. “Human Capital of the Poor in Viet Nam,” Asian Development Bank,
Manila. Processed.
T
he economy of Viet Nam, stimulated by a set of reforms popularly
called doi moi (renewal), grew at the impressive annual rate of
7.3 percent from 1990 to 1999. Contemporaneously, poverty
incidence fell dramatically from 75 percent in the mid-1980s to
58 percent in 1993 and 37 percent in 1998.1 Access to primary health
care and basic education became almost universal by 1998. Infant
mortality rate fell from 36 per 1,000 live births in 1993 to 27 in 1998.
Enrollment rates in lower secondary schools also increased from
42 percent in 1992-1993 to 61 percent in 1997-1998. These advances
in social indicators are impressive by international standards.
The Lowest Quintile
Nevertheless, poverty reduction efforts have a long way to go.
The poor still represent a sizable number in both absolute and relative
terms. In particular, the hard core poor have not sufficiently benefited
from the overall economic growth and social development. For
example, while per capita consumption of the richest quintile
increased by 64 percent between 1993 and 1998, it rose by only 34
percent for the poorest quintile.
The benefits in the areas of health and education also became
less evenly distributed in the past decade. Table 1 presents summary
social indicators for Viet Nam. Inequality in terms of morbidity and
mortality noticeably increased between 1993 and 1998. For example,
27 percent in the lowest quintile are reported to have lost one or more
working days in the previous month due to illness in 1998, compared
to 23 percent in 1993. The corresponding indicator for the wealthiest
quintile fell from 22 to 16 percent. Likewise, infant mortality fell from
34 to 24 for the richest, but it declined from 39 to only 34 for the
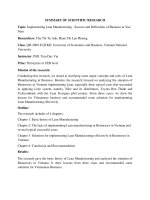
poorest. Moreover, while the poorest adults have seen little increase
in their nutritional status, measured by body mass index (BMI)2 , the
richest adults have experienced marked increases in their BMI
[See Figure 1 which is based on the Viet Nam Living Standards
Survey (VLSS).]
1 The estimate for the mid-1980s is taken from Glewwe, Gragnolati, and Zaman
(2000). Figures for 1993 and 1998 are based on the GSO-World Bank poverty line.
2 Body mass index is a measure of weight for height commonly used for adults. Both
high and low measures are associated with decreased work capacity and early
mortality.
Figure 1: Trends in Body Mass Index of Adults
1
2
3
4
5
Z-score, BMI
-0.6
-1
-1.4
-1.8
Quintile Group
VLSS1992-93
VLSS1997-98
Although primary school enrollment is close to universal,
secondary school enrollment shows a widening disparity between the
poor and nonpoor. In 1997-1998, enrollment in lower secondary
schools was nearly universal for children from the richest quintile
(who are largely urban and have educated parents), but it was only
36 percent for those from the poorest. The corresponding figures in
1992-1993 were 64 percent for the top quintile and 24 percent for the
bottom one.
The factors behind this increased inequality in human capital
access and persistent poverty among people with low human capital
endowment can be discussed under two separate headings:
(i) unequal ability to access education and health, and (ii) unequal
availability of education and health services.
Unequal Ability to Access Education and Health Services
Doi moi has provided people with greater economic
opportunities. However, these opportunities vary significantly with
geographical locations and individual characteristics. Not surprisingly,
individuals who have high levels of human capital to start with—the
2
educated, healthy, city dwellers, and those with access to capital and
credit—were better placed to benefit from the opportunities that came
with the opening of the economy. They experienced greater rise in
income and were, in turn, able to invest more in their health and
education. At the other extreme, many of the poor people (especially
ethnic minorities, those with low education, and households in remote
areas) did not have the necessary human capital to benefit from the
new economic opportunities. They were thus unable to generate
enough additional income to pay for health and education services.
Yet, human capital improvement is critical to getting out of poverty.
Unequal Availability of Education and Health Services
Doi moi has also affected the financing, quality, and private
sector availability of services and, hence, has significantly influenced
the affordability of health and education services for the poor.
Previously, communes relied heavily on implicit taxes on collective
farms and enterprises. The introduction of individual initiative saw a
reduction in funds at the local level. At the same time, government
subsidies for social services also declined leading to reliance on other
financing mechanisms such as user charges and insurance. The
increased cost of health and education services was probably more
than offset for some groups through higher incomes. However, for
those who did not benefit from the greater economic opportunities,
the higher cost of services was an additional constraint. And more
than the increased cost perhaps, the poor have been hit by the lower
quality of services. Education and health costs represent a
significantly larger proportion of household budgets for the poor than
for the nonpoor. For example, in 1998 the hardcore poor were less
likely to use modern facilities for delivering babies than in 1993.
Driven by the incentive of private practice ushered in by doi moi,
health and education service providers have tended to gravitate
toward the richer and urban areas. Providers in poor areas do not
have the motivation to offer quality services, and there is evidence
that the quality of services available to the poor has been declining
in absolute terms. This has led to a decreased demand for these
services.
3
Policy Implications
The increasing inequality in human capital has the following two
important implications for policy:
(i)
(ii)
The nonpoor disproportionately capture government subsidies
for health and education sectors.
There are rigidities in the upward mobility of the remaining poor,
so that the growth process needs to be complemented by
targeted assistance.
The government must find ways to improve the human capital
of the poor and reduce poverty through:
(i)
(ii)
(iii)
(iv)
4
Rationalization of resource allocation to improve the equity and
efficiency of investments in health and education. This should
include greater incentives for providers to remain in poorer
communities.
Removal of barriers to the use of services by the poor so that
they can obtain the maximum benefits from the rationalized
resource allocation and available services. For example,
targeted subsidies for primary health care and basic education
are called for.
Provision of safety nets for catastrophic illnesses, natural
calamities, and macro-level economic crises. The provision of
health insurance for the poor and insurance against natural
disasters are examples of policies that would encourage the
poor to invest in their human capital.
Continued robust growth to ensure that all segments of society
continue to experience rising living standards, as described in
the first paragraph of this brief.
Table 1: Basic Human Capital Indicators of the Poorest
and Wealthiest Groups
1992-1993
Indicator
1997-1998
Poorest Wealthiest Poorest Wealthiest
Education Outcomes
Literacy rate of population
above 18 years (%)
Years of education, adults from 25 to 65
Net enrollment rate, primary level (%)
Gross enrollment rate, children from 11-14
Gross enrollment rate, children from 15-17
Education Inputs
Proportion of children with required
textbooks (%)
Students in nonpublic primary schools
in 1997-1998 (%)
Students in nonpublic lower secondary
schools in 1997-1998 (%)
Students in nonpublic upper secondary
schools in 1997-1998 (%)
Number of working hours per week,
children 11-14 years
Number of working hours per week,
children 15-17 years
Health and Nutrition Outcomes
Infant mortality rate (per thousand)
Average sick days in the last 4 weeks,
children 6-11 years
Average sick days in the last 4 weeks,
children 12-17 years
Average number of sick days in the last
4 weeks, adults 18 years and above
Malnourished children 1-5 years,
using arm circumference (%)
Seriously malnourished children
1-5 years, using arm circumference (%)
Rate of stunted children (%)
Rate of severely stunted children (%)
Health and Nutrition Inputs
“Do nothing” when ill (%)
Women attended by doctors at birth (%)
Children immunized with at least
one kind of vaccine (%)
Children sufficiently immunized (%)
Commune health clinics with a shortage
of medicines (%)
Average cost of a hospital visit as
a percentage of total nonfood expenditure
Average cost of a commune health clinics visit
as a percentage of total nonfood expenditure
78.1
5.1
72
24.3
2
93.3
7.5
91
83.7
35.3
75.2
5.5
85
47.3
9.5
94.1
9
96
107.3
75.4
84
97
70
97
0.2
2.2
0.8
5.5
4
25.4
13.5
4.2
10
1.1
27.5
14.5
24.5
5.1
39.4
34.4
33.6
24.5
0.9
0.6
0.9
0.5
0.8
0.6
0.6
0.
1.8
1.6
1.7
1.1
32.7
15.9
23.4
8.5
6.4
35.9
36.6
1.3
27.5
12.5
3.8
37.9
22.6
0.8
21.1
3.1
14.5
5.9
3.3
45.7
26.7
6.9
12.5
53.3
62.1
48.6
81.0
69.0
88.0
60.7
97.9
68.2
37.7
24.6
60.6
38.6
73
7
44.4
4.7
21.2
2.1
4.7
0.5
Source: Bhushan, Bloom, Nguyen, and Nguyen (2000).
5
References
Bhushan, I. , E. Bloom, N. H. Huu, and N. M. Thang. 2001. “Human Capital
of the Poor in Viet Nam.” Asian Development Bank, Manila.
Processed.
Glewwe, P., M. Gragnolati, and H. Zaman. 2000. “Who Gained from
Vietnam’s Boom in the 1990s: An Analysis of Poverty and
Inequality Trends.” Policy Research Working Paper No. 2275,
World Bank, Washington, D.C.
6
View publication stats