Probabilistic seismic hazard assessment for the tranh river hydropower plant n o 2 site, quang nam province VJES 38
Bạn đang xem bản rút gọn của tài liệu. Xem và tải ngay bản đầy đủ của tài liệu tại đây (716.4 KB, 14 trang )
Vietnam Journal of Earth Sciences Vol 38 (2) 188-201
Vietnam Academy of Science and Technology
Vietnam Journal of Earth Sciences
(VAST)
/>
Probabilistic seismic hazard assessment for the
Tranh River hydropower plant No2 site, Quang Nam
province
Nguyen Hong Phuong*, Pham The Truyen, Nguyen Ta Nam
Institute of Geophysics, Vietnam Academy of Science and Technology
Received 16 February 2016. Accepted 5 June 2016
ABSTRACT
In this paper, the results of probabilistic seismic hazard assessment (PSHA) for the Tranh river hydropower plant
No2 site, Quang Nam province, are presented. A regional earthquake catalog updated until 2014 and most recent data
on active faulting in the area with a radial extent of 100 km from the HPP site were used. Applied modern techniques
in the PSHA methodology including logic tree and hazard disaggregation allow to adopt different models of
seismicity, seismic sources and ground motions for the study area. A set of the probabilistic seismic hazard maps
showing distribution of the median peak ground acceleration (PGA) and intensity I (according to the MSK-64 scale)
predicted for the periods of approximately 200, 500, 1000 and 10,000 years, respectively was compiled for the
region. For the HPP site, the calculated hazard is presented in terms of the hazard curves and the seismic hazard
disaggregation graphics at the site. For the 500 year period, maximum shaking in the area with a radial extent of 100
km from the HPP site reaches the level VIII-IX of the MSK-64 scale (in the Tam Ky-Phuoc Son fault zone). At the
HPP site, the maximum PGA value ranges between 0.1g and 0.13 g (VII-VIII levels in the MSK-64 scale). The PGA
maps present both short - term and long - term forecasts of seismic hazard in Quang Nam province. Calculated
shakings at the HPP’s site can be used for seismic safety evaluation and antiseismic design for the HPP’s facilities
during its operational time.
Keywords: Tranh River hydropower plant No2; probabilistic seismic hazard assessment; seismic sources; logic
tree; seismic hazard curve; seismic hazard disaggregation.
©2016 Vietnam Academy of Science and Technology
1. Introduction
The Tranh River hydropower plant No2 is
located in the Northern Tra My and Southern
Tra My Districts, Quang Nam province and
started its operation since 2010. A few months
after impounding of the hydropower plant
reservoir, reports of earth tremors in the
hydropower plant vicinity became to be
Corresponding author, Email:
188
prevalent. During the period from 2011 to
2015, within a radius of nearly 100 km around
the dam site, about 1200 tremors with the moment magnitudes exceeding 1.0 have been
recorded, among which there were 6 events
with magnitudes from 4.0 to 4.7. As all of the
recorded events were located at the shallow
depth from 5 to 7 km and majority of them
were accompanied with the blast sounds in the
epicentral zones, the seismic activity within
the area has been disturbed the local commu-
Nguyen Hong Phuong, et al./Vietnam Journal of Earth Sciences 38 (2016)
nity life, attracted the attention of the public
media and makes the “Tranh river HPP” issue
one of the breaking hot events around the
country. The occurrence of earthquakes
swarms in the Tranh river hydropower plant
No2 (here and after referred as HPP) area
since 2011 also attracts the attention of the
scientific community and preliminarily was
suggested to have an induced seismicity
origin. Coupling with the investigation of the
seismic characteristic in the vicinity of the
HPP, the seismic hazard assessment for the
HPP site region has been required by the local
authority as an urgent task. On the one hand,
results of the assessment of maximum shakings at the HPP site for a long-term period
will provide the important information for the
periodical seismic safety evaluation for the
HPP. On the other hand, the seismic hazard
maps compiled for the HPP site region can be
used by local authorities in development of
emergency response planning and strategy
against earthquakes in the future in order to
secure the local community around the HPP
site during the HPP’s operation. This paper
presents the results of probabilistic seismic
hazard assessment (PSHA) for the Tranh river
HPP No2 site, using the most update data set
of earthquakes and active faults in the territory and the continental shelf of Vietnam up
to now. The following terminologies are used
on the paper for specifying different study
areas:
“Site” is the area covering the entire dam
of the Tranh river HPP No2.
“Site vicinity” is the area with 100 km in
radius counting from the dam of the Tranh
river HPP No2.
“Study region” is the area with 500 km in
radius counting from the dam of the Tranh
river HPP No2.
2. Theoretical background
In this paper, the classical PSHA methodology first proposed by Cornell and Esteva
in 1968 is used (Cornell, 1968, Esteva, 1968).
In the original Cornell-Esteva approach, if the
study area can be divided into seismic sources
according to geotectonic considerations, it can
be assumed that, within a seismic source, an
independent earthquake-occurrence process is
taking place. Earthquake recurrence relationships, also known as the Gutenberg-Richter,
express the annual frequency (which is
usually assumed to be constant in time) of
earthquakes having various magnitudes up
to the maximum magnitude and can be
written as:
Log10N(M) = a - bM
(1)
where N(M) is the number of earthquakes
with magnitudes exceeding M, a and b are
regionally dependent constants.
Thus, for each seismic source, magnitude
exceedance rates, λ(M) can be estimated by
means of statistical analysis of earthquake
catalogs. These rates are the number of
earthquakes, per unit time, in which
magnitude M is exceeded, and they
characterize the seismicity of the source.
The PSHA methodology also assumes that,
within a seismic source, all points are equally
likely to be an earthquake hypocenter. In this
case, acceleration exceedance rates due to a
single source, say, the i-th source, are
computed using the following expression:
=∑
(
∫
)
(2)
where M0 and Mu are the smallest and largest
magnitudes considered in the analysis
respectively, Pr(A>a|M,Rij)) is the probability
that acceleration exceeds the value a at the
site, given that at distance Rij an earthquake of
magnitude M originates. Rij are the distances
between the site and the sub elements into
which the source has been divided. A weight
wij has been assigned to each sub-element, and
the expression above assumes that Σwij=1.
Finally, the contributions of all N sources to
earthquake hazard at the site are added:
∑
(3)
The seismicity model used in this paper is
called the modified Gutenberg-Richter model,
189
Vietnam Journal of Earth Sciences Vol 38 (2) 188-201
for which the earthquake magnitude exceedance rate is given by:
, M0≤M≤Mu
(4)
where λ0 is the exceedance rate of magnitude
M0, β is a parameter equivalent to the "bvalue" for the source (except that it is given in
terms of the natural logarithm) and Mu is the
maximum magnitude for the source.
With the Poissonian assumption of earthquake occurrence within each seismic source,
the probability density of the earthquake
magnitude is given by:
, M0≤M≤Mu
(5)
3. Seismicity models
3.1. Determination of study region
The Tranh River HPP No2 is located in
Quang Nam province, Central Vietnam. Being
far from giant tectonic margins, not experienced strong tectonic changes since 15 million
years, Central Vietnam is considered to be a
passive marginal zone, belonging to a stable
part of continental crust. From a tectonic
standpoint, this region is located in a stable
tectonic plate named Sunda, which is characterized by low level of seismicity and
deformation. Up to now, earthquakes recorded
in the HPP site vicinity are small to medium
events, with low occurrence frequency and
sparse distribution. The incompleteness of the
seismic dataset requires considering a suitable
seismicity model to be used for hazard
calculation.
The first criterion for selecting seismicity
model is the tectonic activity of the region. As
pointed out by scientists, Vietnam in general,
as well as Central Vietnam are located within
the stable Sunda tectonic plate and is characterized by low seismicity and strain rates
(Petersen et al., 2004). Thus, it can be
assumed that the stable seismicity model
190
should be more appropriate for the study
region. However, when a PSHA methodology
is used, both assumptions of stable and active
tectonic regimes have to be considered for the
study region. This can be done by using the
logic tree technique, when both options of
applying the stable and active seismicity
models are considered with different weights.
The criterion on tectonic activity leads to
the criterion on shaking attenuation from
source to site. In practice, there are distances
beyond which detailed source characterization
is not necessary. It has been empirically
proved that shaking attenuation in the region
with stable tectonic regime is more gradual
comparing with the attenuation in the region
with active tectonic regime (e.g. Budnitz et
al., 1997). For that reason, it is assumed that
for application of PSHA to a certain region, a
radius of 300 km from the site is appropriate
for the study region in the active case, while a
radius of 500 km is more appropriate in the
stable case of tectonic activity.
Based on all above-described arguments,
the study region is defined as the area with
radius of 500 km from the Tranh River HPP
No2 site.
3.2. Earthquake catalog
An earthquake catalog of the study region
was established based on the earthquake database of the Institute of Geophysics, Vietnam
Academia of Science and Technology. The
catalog includes all historical events (collected from 1311 to 1903) and instrumental
events (recorded from 1903 to 2014) within
the region with radius of 500 km from the
dam site of the Tranh River HPP No2. All
events of magnitude lower 4.0 then were
removed from the catalog. The final catalog of
the study region consists of 58 earthquakes
was used for the hazard calculation. The
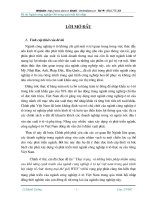
epicenter map of the study region is shown in
Figure 1.
Nguyen Hong Phuong, et al./Vietnam Journal of Earth Sciences 38 (2016)
Figure 1. Epicenter map of the study region
4. Seismic source models
4.1. Model construction
In this paper, three following seismic
source models were independently built and
used as input for seismic hazard calculations:
The fault source model (line sources),
developed using a GIS database of active
faults of Vietnam and adjacent sea area. For
construction of this model, all seismically
active faults of I and II ranks that traced
within the site vicinity area were chosen. The
active faults of I and II rank are the ones,
which capable of originating earthquakes
(Nguyen H.P. et al., 2013; Vu V.C. et al.,
2015).
The source zone model (areal sources),
developed using the update seismotectonic
model of Vietnam and adjacent sea area
(Nguyen H.P. et al., 2013). For construction
of this model, all seismic source zones
delineated within the site vicinity area were
chosen.
The hybrid model, which is a combination
of the two above models.
191
Vietnam Journal of Earth Sciences Vol 38 (2) 188-201
The three models were put in the logic tree
scheme to investigate the uncertainty of the
calculated hazard results, which affected by
the error in determination of the seismic
sources. In all of these cases, a logic tree procedure is an effective way to sequence the
models and parameters leading to the
recurrence estimates and to propagate the
uncertainties into the recurrence distributions.
For fault and even areal sources, the observed
seismicity is usually too sparse to provide a
strong constraint on the recurrence rate, but,
for more active faults, could control the
recurrence rates in the lower magnitude part
of the distribution.
4.2. Determination of the faults sources
The most update data on the active faults
obtained from recent scientific research
projects was used for constructing the line
source model (Nguyen H.P. et al., 2013, Vu
V.C. et al., 2015). The constructed line source
model consists of 7 faults sources determined
within the site vicinity area, including:
The I rank Truong Son fault
The I rank Tam Ky - Phuoc Son fault
The I rank Po Ko river fault
The I rank 109o Meridian fault
The II rank Nam O - Nam Dong fault
The II rank Hung Nhuong - Ta Vi fault
The II rank Tra Bong river fault
In the list above, the Tra Bong river,
although was ranked III by the geologists (Vu
V. C. et al., 2015), has been upgraded in the II
rank according to the seismic data observed in
the site vicinity area.
4.3. Determination of the source zones
The seismic source zones are defined on
the basis of the well-known features of earthquake manifestation and their relationship
with the geologic structure and the tectonic
movement evidence in the study area. For this
study, a seismic source zone is defined along
seismically active faults by summing all the
possible rupture zones caused by maximum
earthquakes, which might occur within the
192
given zone. In another word, this is the projection of tectonic fault plans counting from the
lowest active layer to the Earth's surface.
However, while delineating a seismic source
zone boundary, this principle is rather flexible
and sometimes extended, depending on certain observed earthquake epicenter distribution, a set of faults or related volcanic arcs,
particularly in cases of scattered earthquake
data. The acceptable boundary for a seismic
source zone has to maintain all seismotectonic
characteristics of the zone as a whole, namely
the azimuthal location, direction of main geologic structures and cluster of earthquake
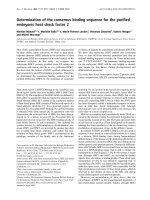
epicenters. Following above-described rule, 6
seismic source zones were delineated in the
site vicinity area. These seismic source zones
are (Figure 2):
The Truong Son source zone;
The Tam Ky - Phuoc Son source zone;
The 109o Meridian source zone;
The Da Nang - Nam Dong source zone;
The Hung Nhuong - Ta Vi source zone;
The Po Ko River source zone.
4.4. Estimation of seismicity parameters for
the seismic source zones
Earthquake recurrence for individual
seismic sources is defined by the seismicity
parameters, which are a-value (also called the
activity rate), b-value (slope of the recurrence
curve expressing a relative number of
exponentially distributed small and largemagnitude earthquakes), and Mmax. Due to the
scattered seismic data, the a- and b- values
were estimated for the entire site vicinity area
using the Gumbel’s I type asymptotic extreme
value distribution. Regarding Mmax, this
parameter was estimated for each seismic
source zone using the Maximum likelihood
method. Detail description of the Mmax
estimation procedure can be found in Nguyen
H.P. (1991), Nguyen H.P. et al., (2012). As
the area source model was constructed based
on the fault source model, the Mmax value
estimated for each source zone then was assigned accordingly to the corresponding fault
source.
Nguyen Hong Phuong, et al./Vietnam Journal of Earth Sciences 38 (2016)
Figure 2. Map of the seismic sources in the Tranh River hydropower plant No2 site vicinity, including the line
sources (faults) and area sources (source zones)
5. Ground motion prediction models
The establishment of an attenuation
equation to be applied to a study region is
important and usually considered as a separate
stage in PSHA procedure. In Vietnam, due to
the lack of strong ground motion data, for a
long time no local attenuation equations have
been developed. Although since 2011, two
attenuation equations have been published by
Vietnamese scientists, none of them are used,
until now, as the reliability of these equations
has been in the process of verification
(Nguyen, L. M. et al., 2012, T. V. Hung and
Kiyomiya, 2012).
For PSHA of the Tranh River HPP No2 site
region, the following ground motion
prediction equations (GMPE) were chosen:
The Toro, Abrahamson and Schneider
(2002) model;
The Campbell and Bozorgnia (2008)
model (CB08) ;
The Boore & Atkinson (2008) model
(BA08);
The Chiou & Young (2008) model
(CY08).
The attenuation equation developed by
Toro, Abrahamson and Schneider (1997) was
developed for the Central and Eastern North
America, which is known as a seismically
stable region. As the seismicity condition of
the Eastern US and the Central Vietnam is
comparable, it is preferable to use the Toro,
Abrahamson and Schneider (1997) as one of
the options in the PSHA for the study region.
The three other GMPEs were developed
recently within the Next Generation Attenuation of Ground Motion (NGA08) project lead
by the Pacific Earthquake Engineering Research Center (PEER, 2008). Although these
models were developed for an active seismic
region, they can be used for shallow crust
earthquakes. The main advantage of these
models is that they have been developed using
the most complete up to now the database of
strong-motion records of all over the world.
The consideration of applying GMPEs
developed for both stable and active seismic
regions in hazard calculations follows the
important principle of PSHA methodology,
where different input options can be weighted
by means of the logic tree technique.
193
Vietnam Journal of Earth Sciences Vol 38 (2) 188-201
6. The logic tree
6.1. Logic tree for the fault sources
Logic trees are widely used in probabilistic seismic hazard
analysis as a tool to capture the
epistemic uncertainty associated with the seismogenic sources
and the ground-motion prediction models used in estimating the
hazard. In this paper, a logic tree was constructed for the study
region based on the previously described seismic source model and
ground motion prediction model.
For the line source model (fault sources), reliability
ofdetermination of all fault sources within the site vicinity area
has been evaluated and assigned corresponding epistemic weights.
The evaluation criteria for a fault source includes segmentation,
dip angle, and capable maximum earthquake magnitude. For the
GMPE models, the weights were assigned for four selected
attenuation equations. Table 1 lists the characteristics of the line
source model (fault sources) and the GMPE model used for
construction of the logic tree for the study region.
Table 1. Characteristics of the line source model (fault sources) and the GMPEs used for construction of the logic tree for the site vicinity area
GMPE (weight)
Segmentation
Dip angle
No
Fault name
Rank
a value b value Mmax
Note/Reference
(activity level)
(degree)
active
stable
TS-1
75
AB08 (0.33)
Toro et al., The segment closest to the site has
1 Truong Son
I (II)
5.0 CB08 (0.34)
2003 (1.0) medium activity (Vu V. C. et al., 2015)
TS-2
82
CY08 (0.33)
TK-PS1 (Medium) 70-75
AB08 (0.33)
TK-PS2 (Medium) 70-80
CB08 (0.34)
Toro et al.,
2 Tam Ky - Phuoc Son
5.2
Nguyen H. P. and Pham T. T., 2015
I TK-PS3 (Active)
2003 (1.0)
80-85
CY08 (0.33)
TK-PS4 (Medium) 65-85
1.72
AB08 (0.33)
SPC
Toro et al., The segment closest to the site has
3 Po Ko River
II
65
5.0 CB08 (0.34)
2003 (1.0) medium activity (Vu V. C. et al., 2015)
CY08 (0.33)
0.73
AB08 (0.33)
Toro et al.,
4 Nam O - Nam Dong
II
NONĐ
90
5.0 CB08 (0.34)
Far from the site
2003 (1.0)
CY08 (0.33)
AB08 (0.33)
Toro et al.,
5 Hung Nhuong - Ta Vi
HNTV
82
5.0 CB08 (0.34)
II
(2003) 1.0
CY08 (0.33)
Toro et al.,
6 109o meridian
I
KT109a
90
6.1 AB08 (0.33)
(2003) 1.0
HNTV-1
AB08 (0.33)
The fault rank is upgraded
80
Toro et al.,
according to the earthquake data (a
7 Tra Bong River
II
5.0 CB08 (0.34)
(2003) 1.0
M4.7 event near the fault.
HNTV-2
90
CY08 (0.33)
194
Nguyen Hong Phuong, et al./Vietnam Journal of Earth Sciences 38 (2016)
6.2. Logic tree for the source zones
For the areal source model (source zones),
reliability of determination of all fault sources
within the site vicinity area has been
evaluated and assigned corresponding epistemic weights. The evaluation criteria for a
source zone includes a- and b- and Mmax
values. The epistemic weights for GMPE
models were chosen similar with those in the
case of fault sources. Table 2 lists the
characteristics of the areal seismic source
model (source zones) and the GMPE model
used for construction of the logic tree for the
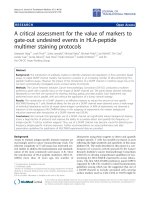
study region. Figure 3 illustrates structure of
the logic tree established for the fault source
and areal source models.
Table 2. Characteristics of the area source model (source zones) and the GMPEs used for construction of the logic
tree for the site vicinity area
No
Source zone
name
a value b value
1 Truong Son
Mmax
5.0
Tam Ky Phuoc Son
5.2
3 Po Ko River
5.0
2
1.72
4 Da Nang
0.73
5.0
Hung Nhuong
- Ta Vi
5.0
6 109o meridian
6.1
5
GMPE
Active
AB08 (0.333)
CB08 (0.333)
CY08 (0.333)
AB08 (0.333)
CB08 (0.333)
CY08 (0.333)
AB08 (0.333)
CB08 (0.333)
CY08 (0.333)
AB08 (0.333)
CB08 (0.333)
CY08 (0.333)
AB08 (0.333)
CB08 (0.333)
CY08 (0.333)
AB08 (0.333)
CB08 (0.333)
CY08 (0.333)
Stable
Note/Reference
Toro et al, 2003 (1.0)
Toro et al, 2003 (1.0)
Toro et al, 2003 (1.0)
Nguyen H. P. and
Pham T. T., 2015
Toro et al, 2003 (1.0)
Toro et al, 2003 (1.0)
Toro et al, 2003 (1.0)
7. Probabilistic seismic hazard assessment
for the Tranh River HPP No2 site area
7.1. Probabilistic seismic hazard maps
Figure 3. A logic tree model for the line- and areaseismic source models. TSi is the weight that specific to
the i-th seismic source
In this paper, the OpenQuake tool was
used for computing seismic hazard of the
study region. OpenQuake is an open-source
software developed by GEM (Crowley et al.,
2011). The OpenQuake computes options
following all branches of the logic tree and
therefore allows obtaining a huge amount of
results. In this paper, only median values of
PGA are used for illustrations.
Results obtained from three seismic source
models, namely the fault-, the areal and the
hybrid ones, were used for compiling seismic
hazard maps for the study region. The proba195
Vietnam Journal of Earth Sciences Vol 38 (2) 188-201
bilistic seismic hazard maps show distribution
of the median peak ground acceleration
(PGA) in unit of % g and intensity I (according to the MSK-64 scale) predicted for the
periods of approximately 200, 500, 1000 and
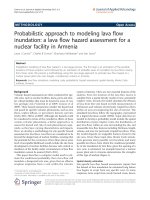
10,000 years, respectively. Figure 4 illustrates
the PGA maps obtained from the hybrid
model. From the seismic hazard maps compiled for the study region, some preliminary
conclusion can be made as follows:
The spatial distribution of the ground
motion values clearly reflects seismic sources
in the study region.
The line sources, contributing highest
shaking effect to the HPP’s dam site are the II
rank Hung Nhuong - Ta Vi, Tra Bong River
faults and the I rank Tam Ky - Phuoc Son
fault. The areal sources, contributing highest
shaking effect to the HPP’s dam site are the
Hung Nhuong - Ta Vi and Tam Ky - Phuoc
Son source zones.
Comparison of the results obtained from
three seismic source model shows that the line
source model gave the highest hazard values,
while the lowest hazard values earned from
the hybrid model. Geometrically, the shape of
zones with highest shaking calculated from
the hybrid model somewhat harmonizes the
shape of the corresponding zones calculated
from the line source and area source models.
(a)
(b)
(c)
(d)
o
Figure 4. PGA maps of the Tranh River hydropower plant N 2 site region predicted for the periods of 200, 500, 1000
and 10,000 years, respectively (in order from top left to lower right)
196
Nguyen Hong Phuong, et al./Vietnam Journal of Earth Sciences 38 (2016)
7.2. Results of site analysis
The results of shaking at the Tranh River
HPP No2’s dam site calculated from three
seismic source models are compared in Table
3. The maximum ground shaking values for
the time periods of 200 and 10,000 years can
be used as a reference for construction of the
Operating Basis Earthquakes (OBE) and the
Safety Evaluation Earthquake (SEE) in antiseismic design for the HPP’s dam (Wieland,
2010).
Figure 5 shows the hazard curves developed for the Tranh River HPP No2’s dam site
from the three source models. Each hazard
curve is a plot of the annual frequency of
exceedance versus peak ground acceleration
at the site. As can be seen from Figure 5, the
negligible difference in shape between the
three curves shows that the variation of the
calculated hazard from the three source
models is inconsiderable as well.
Table 3. Comparison of ground motion values calculated at the Tranh River HPP No2’s dam site from three seismic
source models
T=200 years
T = 500 years
T = 1000 years
T = 4750 years
T = 10000 years Source
N0
PGA (g) I (MSK64) PGA (g) I (MSK64) PGA (g) I (MSK64) PGA (g) I (MSK64) PGA (g) I (MSK64) model
1 0.092
VII 0.142
VIII
0.189
VIII 0.307
IX
0.359
IX
Faults
Source
2 0.0679
VII 0.108
VII
0.150
VIII 0.278
IX
0.341
IX
zones
3 0.0737
VII 0.128
VIII
0.173
VIII 0.296
IX
0.350
IX
Hybrid
Figure 5. The hazard curves for the HPP’s site obtained from the three seismic source models: AS-area source;
FS- fault source and the Hybrid model
Figure 6 compares the results of seismic
hazard disaggregation at the Tranh River HPP
No2 dam site through the functional relationship between the ground motion versus earthquake maximum magnitude, applying for
active and stable seismicity models. The hazard
disaggregation results show that the highest
impact to the dam site might be caused by any
earthquake with a magnitude ranged from 4.0
to 5.0 at a distance of 20 km from the site.
197
Vietnam Journal of Earth Sciences Vol 38 (2) 188-201
(a)
(b)
Figure 6. Results of seismic hazard disaggregation for the active seismicity models (a) and the stable seismicity
model (b): impact of the magnitude M and distance R to the dam site
8. Discussion
In 2003, during the siting process, Nguyen
N. T. et al. (2003) carried out a PSHA for the
Tranh River HPP No2 site area. Abrupt
changes in seismicity of the area after operation of the HPP, particularly since 2010
require the re-evaluation of the seismic hazard
for the site.
Results of re-evaluation of the seismic
hazard for the HPP site are presented in this
paper. Some innovation has been incorporated
into the implementation of this work. For
seismic hazard calculation, not only the earthquake data has been updated until 2014, but a
lot of new geological data have been supplemented to make the regional seismotectonic
model more accurate and detailed. Besides, it
is worth emphasizing the use of such
advanced tool and techniques, first applied to
the PSHA in Vietnam like the logic tree
approach and disaggregation method.
In Table 4, the ground motions at the
HPP’s site calculated by this study (hereafter
referred as the new results) and those results
obtained by Nguyen N. T. et al., 2003 (hereafter referred as the old results) are compared.
Analyzing the results shown in Table 4 allows
making the following remarks:
Table 4. Comparison of ground motion values at the Tranh River HPP No2’s dam site calculated in this study and
those of Nguyen N.T. et al., 2003
T=200 years
T = 500 years
T = 1000 years
T = 4750 years
Authors
PGA (g) I -MSK64 PGA (g) I -MSK64 PGA (g) PGA (g) I -MSK64 PGA (g)
Nguyen N.T. et al., 2003 0.069
VII
0.089
VII
0.103
VII
0.135
VIII
This study
0.076
VII
0.109
In general, the new results show higher
values of ground motions at the site, comparing to the old ones. However, the difference in
shaking intensity I (according to the MSK-64
scale) only becomes noticeable from the time
period exceeding 1000 years. For the periods
of 200 and 500 years, both new and old results
reach the Intensity VII at the same time. For
198
VII
0.147
VIII
0.303
IX
the 1000 year period, the new Intensity value
at the site increases up one unit (I=VIII) comparing to the old value (I=VII). Similarly, for
the 4750 year period, the new Intensity value
at the site also increases up one unit (I=IX)
comparing to the old value (I= VIII).
The increase of ground motion at the site
in the new research compared with those
Nguyen Hong Phuong, et al./Vietnam Journal of Earth Sciences 38 (2016)
results by Nguyen N. T. et al., (2003) can be
explained as a result of the application of new
attenuation equations in hazard calculation. In
Nguyen N. T. et al., (2003), the calculation of
ground motions at the site was based on old
attenuation equations (developed during 1973
and 1997). In this paper, the new attenuation
equations developed from 2002 to 2008 were
used. It should be noted that the NGA08
attenuation equations used in this paper were
developed by the same authors of the old
attenuation equations by using most complete
and update ground motions data of the World.
9. Conclusions
In this paper, the results of probabilistic
seismic hazard assessment (PSHA) for the
Tranh river hydropower plant No2 site, Quang
Nam province, are presented. A regional
earthquake catalog updated until 2014 and
most-recent data on active faulting in the area
with a radial extent of 100 km from the HPP
site were used. Advanced techniques in the
PSHA methodology including logic tree and
hazard disaggregation allow to adopt different
models of seismicity, seismic sources and
ground motions for the study area.
A set of the probabilistic seismic hazard
maps showing distribution of the median peak
ground acceleration (PGA) and intensity I
(according to the MSK-64 scale) predicted for
the periods of approximately 200, 500, 1000
and 10,000 years, respectively was compiled
for the study region. For the HPP site, the
calculated hazard is presented in terms of the
hazard curves and the seismic hazard disaggregation graphics. For the 500 year period,
maximum shaking in the area with a radial
extent of 100 km from the HPP site reaches
the level VIII-IX of the MSK-64 scale (in the
Tam Ky-Phuoc Son fault zone). At the HPP
site, the maximum PGA value ranges between
0.108 g and 0.142 g (VII-VIII levels of the
MSK-64 scale).
The new results show the higher PGA
values compared to those calculated by
Nguyen N. T. et al., (2003). However, the increase of PGA values of the new results only
starts at the period of 1000 years and longer,
with deviation of one unit of the Intensity
MSK-64 scale.
The PGA maps present both short - term
and long - term forecasts of seismic hazard in
Quang Nam province. Calculated shakings at
the HPP’s site can be used for seismic safety
evaluation and antiseismic design for the
HPP’s facilities during its operational time.
Acknowledgements
This research is supported by the project
“Study of seismotectonic effect on the stability of Tranh River No2 Hydropower plant,
Bac Tra My district, Quang Nam province”
under grant number: ĐTĐL.2013-G.
References
Budnitz, R.J., Apostolakis G., Boore D. M., Cluff L. S.,
Coppersmith K. J., Cornell C. A., Morris P. A., 1997.
Recommendation
for
Probabilistic
Seismic
Hazard
Analysis: Guidance on Uncertainty and Use of Experts.
NUREG/CR-6732, Vol.1, pp 54.
Cornell, C.A., 1968. Engineering Seismic Risk Analysis, Bull.
Seim. Soc. Am., 58, 1583-1606.
Crowley, H., D. Monelli, M. Pagani, V. Silva, G. Weatherill,
2011. OpenQuake Book. The GEM Foundation, Pavia,
Italy.
Esteva, L., 1968. Bases para la formulacion de decisiones de
diseno sismico. PhD thesis, Universidad Autonoma
Nacional de Mexico.
Gumbel, E. J., 1958. Statistics of Extremes, Columbia
University Press.
Nguyen Hong Phuong (Editor), 2013. Assessment of
earthquake and tsunami hazards in the Ninh Thuan
province for site approval of the NPPs”. Final report of the
2013 National Scentific Research Project, Institute of
Geophysics, Hanoi (in Vietnamese).
Nguyen Hong Phuong , Que Cong Bui, Xuyen Dinh Nguyen.
Investigation of tsunami sources, capable of affecting the
Vietnamese coast. Natural Hazards, 64(1) pp 311-327.
DOI: 10.1007/s11069-012-0240-3, October 2012.
Nguyen Hong Phuong, 2004. Seismic Hazard Maps of Vietnam
and the East Vietnam Sea. Journal of Earth’s Sciences,
26(2), 97-111 (in Vietnamese).
199
Vietnam Journal of Earth Sciences Vol 38 (2) 188-201
Nguyen Hong Phuong, Bui Cong Que, Vu Ha Phuong and
Pham The Truyen, 2014. Scenario-based Tsunami Hazard
Assessment for the coast of Vietnam from the Manila
Trench source. Physics of the Earth and Planetary Interiors.
DOI: 10.1016/j.pepi.2014.07.003.
Nguyen Hong Phuong, Pham The Truyen, 2015. Probabilistic
Seismic Hazard Maps of Vietnam and the East Vietnam
Sea. Journal of Marine Science and Technology, Vol. 15,
N01; : 77-90. DOI: 10.15625/1859-3097/15/1/6083
(inVietnamese).
Nguyen Ngoc Thuy et al., 2003. Assessment of seismic hazard
for the Tranh River hydropower plant No2. A prefeasebility report, Institute of Geophysics, Hanoi, October,
75p (in Vietnamese).
Nguyen, L. M., et al, 2012. The first peak ground motion
attenuation relationships for North of Vietnam, Journal of
Asian Earth Sciences, doi: 10.1016/j.jseaes.2011.09.012.
OYO corporation, 2013. Research, Detailed Review of
Geological Condition, Geodynamics and Geological
Activities in Song Tranh 2 Hydropower Area (Bac Tra My
District, Quang Nam Province). Draft Final Report No.:
01/2013/SACQI-OYO, 19 September 2013, 101.
Pacific Earthquake Engineering Research Center, 2008. NGA
model for average horizontal component of peak ground
motion and response spectra. Earthquake Spectra, Vol.24,
No.1, 1-341.
Petersen Mark D., James Dewey, Stephan Hartzell, Charles
Mueller, Stephan Harmsen, Arthur D. Frankel, Ken
Rukstales, 2004. Probabilistic seismic hazard analysis for
Sumatra, Indonesia and across the Southern Malaysian
Peninsula. Tectonophysics, 390, 141-158.
Toro, G. R., 2002. Modification of the Toro et al. (1997)
attenuation equations for large magnitudes and short
distances. Risk Engineering Incl., June, 2012.
Toro, G. R., Abrahamson, N. A., and Schneider, J. F., 1997.
Engineering model of strong ground motions from
earthquakes in the central and eastern United States.
Seismological Research Letters, 68(1), 41-57.
Tran Viet Hung and Kiyomiya, O., 2012. Ground motion
attenuation relationship for shallow strike-slip earthquakes
in northern Vietnam based on strong motion records from
Japan, Vietnam and adjacent regions, Structural
Eng./Earthquake Eng., JSCE, 29, 23-39.
Vu Van Chinh (Editor), 2015. Study and detailed evaluation of
the regional seismotectonic characteristics and their impact
to the stability of the Tranh River hydropower plant No2
and Northern Tra My area, Quang Nam province. A
Thematic report of the 2013 National Scentific Research
Project ” Study of the seismotectonic impact to the stability
of the Tranh River hydropower plant No2 in Northern Tra
My area, Quang Nam province”, Institute of Geophysics,
Hanoi (in Vietnamese).
Wieland M., 2010. Selecting seismic parameters for large
dames - Guidelines. ICOLD Bulletin 72, 2010 Revision.
APPENDIX
Earthquake catalog of the study region (within a radius R=500 km from the Tranh River HPP No2 dam site)
N0
1
2
3
4
5
6
7
8
9
10
11
12
13
14
15
16
17
18
19
20
21
200
Year
1131
1666
1685
1715
1715
1715
1767
1821
1829
1877
1882
1903
1913
1920
1920
1923
1928
1928
1928
1932
1933
Month
2
3
5
3
3
3
1
7
11
1
1
7
3
5
8
8
6
8
8
6
4
Day
1
1
1
1
1
1
1
1
1
1
1
1
1
27
1
1
1
1
1
22
1
Hour
1
5
1
1
1
1
1
1
1
1
1
1
1
12
11
5
1
22
5
5
1
Min
1
1
1
1
1
0
0
0
0
0
0
1
1
49
1
1
1
0
0
59
0
Sec
0
0
0
0
0
0
0
0
0
0
0
0
0
0
0
0
0
0
0
0
0
Lat
18.67
17.05
16.5
15.52
13.5
19.11
19.11
18.67
16.48
10.56
10.56
18.67
18.42
19
18.67
18.66
13.32
18.42
18.5
16.69
19
Long
105.66
107.01
106.59
108.15
109.2
105.69
105.69
105.66
107.41
108.05
108.2
105.67
105.75
109
105.5
105.5
108.52
105.75
105.42
111.8
105.56
Depth (km) Magnitude (M)
10
5.1
12
4.1
12
4.1
12
4.7
12
4.1
10
4.1
10
5.1
17
6
12
4.8
12
5.1
12
5.1
10
5.2
11
4.5
12
6.5
12
4.6
12
4.8
12
5
15
4.2
7
4.2
10
5.6
12
4.3
Nguyen Hong Phuong, et al./Vietnam Journal of Earth Sciences 38 (2016)
22
23
24
25
26
27
28
29
30
31
32
33
34
35
36
37
38
39
40
41
42
43
44
45
46
47
48
49
50
51
52
53
54
55
56
57
58
1936
1936
1938
1942
1943
1947
1947
1950
1957
1960
1965
1965
1967
1967
1968
1968
1969
1969
1969
1970
1970
1972
1982
1982
1985
1991
1992
1992
1995
1995
1997
2012
2012
2012
2012
2012
2014
8
8
1
1
7
1
1
1
12
2
1
7
1
3
5
6
9
12
12
1
4
5
1
2
10
6
1
5
6
6
3
9
9
9
10
11
5
20
24
1
1
1
1
1
1
25
29
17
3
1
13
16
18
2
17
20
23
12
24
25
18
18
1
4
26
5
5
12
3
7
23
22
15
15
1
22
1
1
14
1
1
1
21
3
1
4
1
6
22
9
11
15
9
12
12
20
14
22
15
1
22
17
7
7
2
20
9
10
20
14
19
0
3
1
15
1
1
1
1
1
13
41
48
1
16
9
52
14
0
9
53
37
18
50
56
37
1
1
43
17
16
25
46
26
57
41
24
34
0
0
0
0
0
0
0
0
0
0
0
0
0
0
0
0
0
0
0
0
0
0
0
0
0
0
0
0
0
0
0
0
0
0
0
0
0
14.21
14.26
14.65
18.05
18.07
16.55
16.09
13.1
14.5
11.1
11.8
18.6
18.43
12
17.3
15.69
16.69
18.5
18.19
18.44
13.39
13.64
18.44
18.3
18.01
10.6
18.44
18.73
18.96
18.43
16.82
15.22
15.3
15.35
15.33
15.35
16.32
109.14
109.01
109.04
105.58
106.33
107.43
108.09
109.3
108.5
109.09
109.8
105.4
105.75
108.7
105.5
109.3
110.4
110.59
110.3
109.5
108.9
108.81
109.41
104.7
104.81
107.9
107.13
108.52
108.69
108.22
105.87
108.25
108.17
108.06
108.15
108.09
107.37
12
14
12
8
14
0
12
12
12
12
12
12
19
12
12
12
12
10
24
10
13
13
33
33
21
5
19
7
25
10
24
7
10
6
7
10
10
5.1
4
4.1
4.3
4.7
4.4
4.8
4.8
4.8
4.1
4.8
4.1
4.3
4
5
4.8
5.3
5.1
5.2
5.3
5.3
5.3
4.5
4.5
4.6
4
4
4
4.4
4.1
5.7
4.2
4.2
4.1
4.6
4.7
4.7
201