o cáo hóa học:" A critical assessment for the value of markers to gate-out undesired events in HLA-peptide multimer staining protocols" pot
Bạn đang xem bản rút gọn của tài liệu. Xem và tải ngay bản đầy đủ của tài liệu tại đây (715.22 KB, 13 trang )
RESEARCH Open Access
A critical assessment for the value of markers to
gate-out undesired events in HLA-peptide
multimer staining protocols
Sebastian Attig
1†
, Leah Price
2†
, Sylvia Janetzki
3
, Michael Kalos
4
, Michael Pride
5
, Lisa McNeil
5
, Tim Clay
6
,
Jianda Yuan
7
, Kunle Odunsi
8
, Axel Hoos
9
, Pedro Romero
10
, Cedrik M Britten
1,11*
and for
the CRI-CIC Assay Working Group
Abstract
Background: The introduction of antibody markers to identify undesired cell populations in flow-cytometry based
assays, so called DUMP channel markers, has become a practice in an increasing number of labs performing HLA-
peptide multimer assays. However, the impact of the introduction of a DUMP channel in multimer assays has so far
not been systematically investigated across a broad variety of protocols.
Methods: The Cancer Research Institute’s Cancer Immunotherapy Consortium (CRI-CIC) conducted a multimer
proficiency panel with a specific focus on the impact of DUMP channel use. The panel design allowed individual
laboratories to use their own protocol for thawing, staining, gating, and data analysis. Each experiment was
performed twice and in parallel, with and without the application of a dump channel strategy.
Results: The introduction of a DUMP channel is an effective measure to reduce the amount of non-specific
MULTIMER binding to T cells. Beneficial effects for the use of a DUMP channel were observed across a wide range
of individual laboratories and for all tested donor-antigen combinations. In 48% of experiments we observed a
reduction of the background MULTIMER-binding. In this subgroup of experiments the median background
reduction observed after introduction of a DUMP channel was 0.053%.
Conclusions: We conclude that appropriate use of a DUMP channel can significantly reduce background staining
across a large fraction of protocols and improve the ability to accurately detect and quantify the frequency of
antigen-specific T cells by multimer reagents. Thus, use of a DUMP channel may become crucial for detecting low
frequency antigen-specific immune responses. Further recommendations on assay performance and data
presentation guidelines for publication of MULTIMER experimental data are provided.
Background
Assays to evaluate antigen-specific immune response are
increasingly used in cancer immunotherapy trials. The
inherent complexity of T-cell assays has motivated sev-
eral studies to address the harmonization and stand ardi-
zation of the most commonlyusedassays[1-8].Since
the introduction of HLA-peptide multimers (MULTI-
MERs) more than 15 years ago, the number of
laboratories using these reagents to detect and quantify
antigen-specific T cells has steadily increased, in part
reflecting the high sensitivity and specificity of this assay
platform [9]. The study described in this report is a con-
tinuation of a process actively pursued by the Cancer
Research Institute’s Cancer Immunotherapy Consortium
(CRI-CIC) to develop comprehensive guidelines for har-
monizing for MULTIMER experiments across labora-
tories. The first MULTIMER proficiency p anel (MPP1)
organized by CRI-CIC resulted in initial harmonization
guidelines among which was the suggestion that use of
a DUMP channel to exclude unwanted cells carrying
surface markers (such as CD4, CD14 or CD19) might be
* Correspondence:
† Contributed equally
1
Division of Translational and Experimental Oncology, Department of Internal
Medicine III, University Medical Center of the Johannes Gutenberg-University,
Mainz, Germany
Full list of author information is available at the end of the article
Attig et al. Journal of Translational Medicine 2011, 9:108
/>© 2011 A ttig et al; lic ensee BioMed Cen tral Ltd. T his is an Op en Access art icle distributed un der the terms of the Creative Commons
Attribution License (http://creativecomm ons.org/licenses/by/2.0), which permits unrestricted use, distribution, and reproductio n in
any medium, provided the original work is prop erly cited.
a c ritical factor determining test performance [7]. Since
the addition of antibody markers increases the complex-
ity and costs of the assay, it is important to demonstrate
that this additional effort provides clear benefit in terms
of assay performance and data quality.
Here we present the results of a second M ULTIMER
proficiency panel to systematically evaluate, for the first
time, the effect of DUMP channel markers on MULTI-
MER assay performance across individual laboratory
protocols. PBMC samples from four preselected donors
with well defined numbers of antigen specific CD8
+
T
cells were distributed to participating labs from a central
facility. The panel design allowed all labs to use their
own protocol for thawing, staining, gating, and data ana-
lysis. Each laboratory performed two parallel assays, one
with and one without the inclusion of dump channel
markers.
The study revealed a clear benefit for the use of a
DUMP channel, extending the observations from the
initial proficiency panels. The benefit for applying dump
channel strategies was apparent in a large fraction of
independent experiments across multiple laboratories
and using inde penden t staining, acquisition, gating and
analysis protocols. Finally, new recommendations on
how to best display results from MUTIMER staining are
given.
Methods
Panel design and organizational setup
The second MULTIMER proficiency panel was con-
ducted with a group of 20 centers. Participating labora-
tories were located in seven countries (Belgium, Canada,
Germany, Japan, Sweden, Switzerland and USA). Orga-
nizational and scientific panel leadership was provided
by two leaders experienced in MULTIMER staining, in
collaboration with the CIC executive office and the
steering committee of the CIC Immunoassay working
group. The authors of this group acknowledge the con-
cept of the Minimal Information About T cell Assays
(MIATA) reporting framework for human T cell assays
that was recently introduced to the community [10,11].
Consequently, we provide structured information on 5
modules: the sample, the assay, the data acquisition, the
data analysis and interpretation and finally, the lab
environment in which the corresponding T cell experi-
ments were performed.
The sample
Four healthy donors provided writte n informed consent
for this study prior to a leucapheresis. PBMC were
obtained from the Immunology Quality Assurance Cen-
ter Laboratory (IQAC) of the Duke Human Vaccine
Institute, a division of the Duke University Medical Cen-
ter in Durham NC. Samples were obtained via
leukapheresis and processed in the IQAC laboratory
within 4 hours of collection. PBMC were separated by
density gradient centrifugation, cryo-preserved in 10%
DMSO and 90% heat-inactivated FBS at 15 million cells
per vial using an automated contr olled rate freezer, and
stored in equal aliquots in two vapor phase LN2
freezers.
Pre-screening to identify donors with peripheral CD8+
T cells specific for HLA-A*0201-restricted epitopes
from CMV pp65
495-503
(NLVPMVATV) and Melan-A/
Mart-1
26-35
(ELAGIGILTV) was conducted at the Lau-
sanne branch of the Ludwig Institute for Cancer
Research (LICRLB). Donor selection was based on eva-
luation using three different sources of MULTIMERs;
donor samples were identified that had antigen-specific
CD8
+
T cells at a frequency of ≤ 1 in 500.
For this study PBMC from four HLA-A*0201 donors
were selected; 3 donors (D1, D3, D4) were CMV seropo-
sitive while D2 was CMV seronegative; since D2 did not
contain detectable levels of CMV pp65-specific T cells
this sample was used as a negative control for these ana-
lyses (Additional file 1, Figure S1). Each participating
laboratory received 2 vials from each donor, each vial
containing 15 × 10
6
PBMCs. Participating labs were
asked to store the samples in liquid nitrogen upon arri-
val. The method used for thawing and counting of vials
was left to the discretion of the participating labs. The
total cell number aft er thawing and the number of
viable cells were docume nted and reported in a ques-
tionnaire. The mean cell viability of cell material was
86% with similar results for all 4 donors. Under optimal
conditions, a participating lab should have identified a
population of CMV pp65- or Melan-A-specific CD8
+
lymphocytes in seven donor-antigen combinations.
Donor 2 did not contain detectable levels of CMV
pp65-specific T cells and can be regarded as a negative
control (Additional file 1, Figure S1).
HLA-peptide multimer staining
Participants were free to choose HLA-peptide tetramers
or pentamers. The MULTIMERS were generously
donated by Beckman Coulter (Fullerton, CA) or P roIm -
mune (Oxford, UK), respect ively. Sixteen laboratories
used HLA-peptide tetramers and 6 laboratories used
HLA-peptide pentamers. Each lab received one vial of
the MULTIMER specific for i) a defined and unknown
peptide sequence (irrelevant multimer), ii) CMV
pp65
495-503
(Antigen “ A1” = NLVPMVATV) and iii)
Melan-A/Mart-1
26-35
(Antigen “ A2” = ELAGIGILTV).
Each of the participating laboratories were required to
use 10 μl per staining of a given MULTIMER.
Individual laboratories used different methods to
count viable cells, their own staining protocols and were
free to choose all other parameters such as buffers,
Attig et al. Journal of Translational Medicine 2011, 9:108
/>Page 2 of 13
serum supplement, plates, tubes, staining volume, incu-
bation time and the inclusion of a dead cell marker.
Staining was done in duplicate, for two different condi-
tions (once with and once without utilizing dump chan-
nel markers), otherwise following the same laboratory-
specific protocol. Six stainings were requested for each
donor and condition (+/- dump channel): an FMO
staining, a staining with irrelevant MULTIMER, dupli-
cate stainings with the CMV and Melan-A multimers.
The staining with the irrelevant MULTIMER was used
as a negative control. At least 2 different cell surface
antigens had to be used for the dump channel, with one
being CD19. All other antigen choices (e.g. CD4, CD13,
CD56 etc.) were left to the discretion of the lab.
Data acquisition
Individual laboratories acquired the data on their flow-
cytometer and analyzed the FCS files following labora-
tory-specific analysis strategies and software. The
requested format for presenting the results was a series
of plots showing CD8 on the x-axis and the MULTI-
MER on the y-axis. Participant s were explicitly asked to
count at least 100,000 CD8-positive events, based on
previous panel findings and initial harmonization guide-
lines [7]. Representative dot plots from all participating
labs will be made available upon request.
Data Analysis and Interpretation
Data generated by individual laboratories were evaluated
in 2 ways
Initial analysis was performed in a non-censored manner
using the numerical data generated and provided by
individual laboratories. In addition, to minimize the
impact of individual laboratory gating, analysis, and
interpreta tion strategies, a censored analysis was also
performed. For the censored analysis, three criteria were
applied to determine if an individual lab successfully
detected a response; these criteria required ( i) a repro-
ducible duplicate staining and (ii) the presence of a
clearly clustered population of MULTIMER-positive
CD8
+
cells as assessed by an visual inspection of the dot
plots during an independent central assessment and (iii)
a reported value of less than 1% of MULTIMER-positive
CD8
+
cells. Stainings for each multimer/donor combina-
tion were considered reproducibl e if the percentage dif-
ference between the two replicate measurements was
less than 200%. Since the definition of a “ clearly clus-
tered population” is subjective in nature, two experi-
enced evaluators independently examined each the dot
plots and assigned a score based on whether there was a
clustered population. A score of 0 was given when there
was no obvious clustering ("clearly negative”)orthe
experiment was not performed or th e dot plot appear-
ance was ambiguous ("unclear”), a score of 1 was given
for ambiguous results, and a score of 2 was given when
there was a clustered population of dots ("clearly posi-
tive”). Consequently, each duplic ate staining could reach
scores ranging from 0 to 4. A score greater than two
was considered as evidence of a clearly clustered popula-
tion of MULTIMER
+
CD8
+
cells. A laboratory was
deemed to have detected a response if both criteria
(acceptable reproducibility between duplica te measures
and presence of clearly clustered multimer
+
population)
were met. Four individual experiments were excluded
even though they met both criteria due to the fact that
the frequencies of antigen-specific CD8
+
Tcellsfor
these experiments were > 1%, a 5-fold higher value than
the highest frequency as determined during pretesting
by the central laboratory ("completely out of range”).
Statistical Methods
The following parameters were calculated for the overall
panel performance using the lab-specific reported per-
centage of MULTIMER
+
CD8
+
cells: the median percen-
tage of CD8
+
cells for each donor and antigen and the
coefficient of variation (CV). To compare the percentage
of MULTIMER
+
CD8
+
cells reported between experi-
ments performed WITH a dump channel versus NO
dump channel and between experiments that were ana-
lysed centrall y using diffe rent gating strategies, the Wil-
coxon signed rank test for paired comparisons was used.
To compare the percentage of MULTIMER
+
CD8
+
cells
between labs that used different gating strategies, the
two sample Wilcoxon test was used. The association
between non-specific and specifi c MULTIMER binding
(percentage of MULTIMER
+
CD8
-
cells versus percen-
tage of MULTIMER
+
CD8
+
cells) was assessed with
Spearman’s correlation coefficient.
Lab environment
Participating laboratories operated under different prin-
ciples, varying from exploratory research to Good
Laboratory Practice (GLP). All labs followed thei r own,
previously established protocols. There were large differ-
ences in the experience level of the operator as reported
by the participants. Ten labs repo rted more than 3 years
of experience in the use of the technique whereas 10
labs reported less than two years of experience.
Results
Quality of experimental data
MULTIMER experime nts should be conducted with cell
mater ial of high viability [12] and be based on sufficient
cell counts [7,13]. In order to obtain evidence that cell
material of sufficient quality and quantity was used in
the second MULTIMER panel all participants were
asked to record cell viability for each donor. Cell viabi-
lity as determined by trypan blue exclusion was
Attig et al. Journal of Translational Medicine 2011, 9:108
/>Page 3 of 13
excellent, with a mean viability of 85, 89, 86 and 85% for
donors D1 to D4 respectively (Table 1).
Laboratories were further required to report the number
of acquired CD8
+
events. The median CD8
+
event counts
were > 79,000 in D2, > 95,000 in D4 and D3 and >
100,000 in D1. Further, the median event counts derived
from both condit ions (with and without DUMP channel)
for any of the four donors were similar (Table 2).
Introduction of a DUMP channel decreases the amount of
non-specific events observed in the CD8-positive cell
fraction
The main aim of this proficiency panel was to systemi-
cally study the impact of DUMP channel use across
representative assay protocols. To this end each partici-
pant performed paired sets of experiments that only dif-
fered in the use of a DUMP channel. All other assay
variables were kept constant.
Non-censored analyses
A comparison within each lab was made between the
MULTIMER
+
CD8
+
events reported in the experiments
WITH DUMP versus WITHOUT DUMP channel mar-
kers. Figure 1a displays these paired experiments for all
seven donor-antigen combinations where a response
was expected. The WITHOUT DUMP results are pre-
sented on the x-axis and the results WITH DUMP on
the y-axis. In total a 1.65-fold reduction of background
was observed across all experiments with irrelevant
MULTIMERs. Three classes of experimental outcomes
were observed with regard to the quantification of
MULTIMER
+
CD8
+
events. In the largest f raction of
experiments (53.6%) a decrease of non-specific MULTI-
MER binding (median -0.055%) was observed in the
condition WITH DUMP channel. In a small fraction
(17.9%) of paired replicates we observed an increase of
MULTIMER-positive C D8
+
events in the condition
WITH DUMP channel (median increase 0.045%). In a
third fraction (28.5%) of paired replicates there were
similar results obtai ned for both conditions (difference <
0.01%). Examining the median reported % MULTIMER
+
CD8
+
events for each donor and reagent and experi-
mental condition including all reported data sets, it is
apparent that the results from the WITH DUMP
channel experiments on average led to lower values
than the results from the NO DUMP channel experi-
ments in all eight tested donor-antigen combinations
(Table 3).
MULTIMER
+
CD8
+
events can either result from spe-
cific MULTIMER binding to antigen-specific TCRs (true
specific signal) or from non-specific binding of MULTI-
MER to lymphocytes (non-specific signal). To address
the question of whether the reduction of MULTIMER
+
CD8
+
events was due to loss of true specific signal or
reduction of non-specific signal we focused on results
obtained with the irrelevant MULTIMER. Here we
assume that all MULTIMER
+
CD8
+
events must resu lt
from non-specific MULTIMER binding.
When focusing on the paired repli cates generated with
the irrelevant MULTIMER and the CMV MULTIMER in
the CMV-negative donor D2 we identified three classes
of experimental outcomes (Figure 1b ). In the largest frac-
tion of experiments (48 of 100) we found a decrease of
non-specific MULTIMER binding (median -0.049%) in
the condition WITH DUMP (green data points) which
represents a 4.1-fold median reduction of the background
staining in this subgrou p of experiments. Interestingly,
this group included 31 experiments in which use of a
DUMP channel was combined with a dead cell dye,
showing that in a large fraction of representative proto-
cols the addition of a DUMP channel to a dead cell dye
mayhavefavourableeffects.Inasmallfraction(15of
100) of paired replicates we observed an increase of
MULTIMER
+
CD8
+
events in the condition WITH
DUMP (median increase 0.035%) (red data points). In a
larger fraction (37 of 100) of p aired replicates there were
sim ilar results obtained for both conditions (difference <
0.01%) (black data points); thirty one of these 37 experi-
ments included the use of a dead cell dye.
Table 4 displays the median frequency of MULTIMER
+
CD8
+
cells after applying the irrelevant MULTIM ER
for both conditions stratified by the use of dead cell
stai ning. Comparison of the amount of irrelevant MUL-
TIMER binding showed that the median d ifference
Table 1 Cell Viability
Viability (%) Donor Mean Median < 70% 70-100%
1 84.7 86.2 3 (15%) 17 (85%)
2 88.5 90.5 1 (5%) 19 (95%)
3 86.3 86.1 0 (0%) 20 (100%)
4 85.0 87.2 2 (10%) 18 (90%)
The table reports the overall viability for each of the thawed PBMC donor
samples as determined by trypan blue staining. The table presents the mean
and median viability for each donor. It also reports the proportion within
optimal and suboptimal ranges.
Table 2 CD8-positive event counts
Event count Donor Dump Channel Median Mean
1 No 101983 123825
Yes 105629 116992
2 No 79964 82570
Yes 80243 81993
3 No 101239 118428
Yes 99947 110498
4 No 100732 103625
Yes 95015 94656
The table shows the range of events counted in the conditions stained with
the CMV-pp65 MULTIMER for all four donors.
Attig et al. Journal of Translational Medicine 2011, 9:108
/>Page 4 of 13
a
b
NO Dump
0,0 0,1 0,2 0,3 0,4 0,5 0,6 0,7 2,0 4,0
WITH Dump
0,0
0,1
0,2
0,3
0,4
0,5
0,6
0,7
2,0
4,0
NO Dump
0,0 0,1 0,2 0,3 0,4 0,5 0,6 0,7 2,0 4,0
WITH Dump
0,0
0,1
0,2
0,3
0,4
0,5
0,6
0,7
2,0
4,0
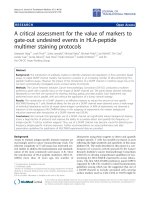
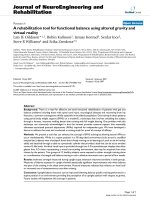
Figure 1 MULTIMER binding in the condition WITHOUT versus WITH use of a DUMP channel. The figure shows results for the percentage
of MULTIMER-positive CD8-positive events in the condition WITHOUT DUMP (x-axis) and WITH DUMP (y-axis) for (a) the seven positive donor-
antigen combinations after staining with the CMV- or Melan-A MULTIMER and (b) the negative donor antigen combination (CMV in D2) as well
as the results generated when using the irrelevant MULTIMERS (D1 to D4). Experiments with an increase (> 0.01%) of non-specific MUTIMER
binding in the condition with DUMP are shown in red. Experiments with a decrease (> 0.01%) of non-specific MULTIMER binding in the
condition with DUMP are shown in green.
Attig et al. Journal of Translational Medicine 2011, 9:108
/>Page 5 of 13
between WITH DUMP and NO DUMP for the paired
replicates from labs that did not use a dead cell marker
was 0.02% (Table 2). The median difference for the
paired replicates from labs that did use a dead cell mar-
ker was only 0.01%. Therefore those labs that did not
use a dead cell marker, on average measured a larger
reduction of non-specific MUTLIMER staining after
addition of a DUMP channel.
Censored analyses
Upon central review of all data sets from this s econd
proficiency panel, it became clear that the reported
results contained (i) duplicate stainings with discordant
results, (ii) dot plots devoid of a clear clustered MULTI-
MER
+
CD8
+
population for the donor-antigen combina-
tions expected to be posit ive and (iii) a reported
frequency of MULTIMER
+
CD8
+
T cells far above 1%,
which is more than 5-fold above the expected maximum
value of 0.2% and therefore are clear outliers. Since such
inconsistencies in the submitted data sets might influ-
ence the clear effects seen for introduction of a DUMP
channel we applied three intuit ive data filters to deter-
mine if a given staining should indeed be considered a
successfully detected response.
The first criterion selected for reproducible duplicate
values (Table 5). Discordant duplicates defined as per-
cent difference greater than 200%, w ere not considered
Table 3 %age of CMV pp65- and Melan-A-MULTIMER-
positive CD8-positive events
MULTIMER Donor Dump Channel Median(raw)
CMV pp65 1 No 0.12 ↓
Yes 0.10
2No 0.04* ↓
Yes 0.02*
3 No 0.17 ↓
Yes 0.14
4 No 0.08 ↓
Yes 0.07
Melan-A 1 No 0.17 ↓
Yes 0.09
2 No 0.24 ↓
Yes 0.18
3 No 0.10 ↓
Yes 0.08
4 No 0.06 ↓
Yes 0.04
The medians of the reported percentages of MULTIMER-positive CD8-positive
cells for each antigen-donor combination are shown in the table. These
results are stratified by condition (with and without the inclusion of a dump
channel). Results obtained using two MULTIMERS in four donors stratified by
use of a DUMP channel. For all sixteen experimental conditions the median of
the reported values for MULTIMER+ CD8+ cells for all experiments are
displayed. The asterisk indicates a negative control donor.
Table 4 %age of Irrelevant-MULTIMER-positive CD8-
positive events
MULTIMER Donor Dump
Channel
Dead Cell
Staining
N Median
Irrelevant 1 No No 6 0.04 ↓
No Yes 14 0.02
Yes No 6 0.04 ↓
Yes Yes 14 0.01
2 No No 6 0.06 ↓
No Yes 14 0.03
Yes No 6 0.05 ↓
Yes Yes 14 0.02
3 No No 6 0.04 ↓
No Yes 14 0.03
Yes No 6 0.02 ↓
Yes Yes 14 0.02
4 No No 6 0.03 ↓
No Yes 14 0.02
Yes No 6 0.03 ↓
Yes Yes 14 0.01
Results obtained using the irrelevant MULTIMERS in four donors stratified by
DUMP channel use and further subdivision by the use of dead cell marker.
The table also indicates the number of labs (N) for each of the 16 subgroups.
The table further indicates the median values of the reported percentages of
MULTIMER+ CD8+ cells for all reported data sets using the irrelevant
MULTIMER. Arrows in both tables denote decreased values when a DUMP
channel is used.
Table 5 Data Filter 1 - Reproducibility
Percent Difference between
Duplicates
Antigen Donor Dump
Channel
0-
10%
10-
30%
30-
200%
> 200%
*
CMV
p65
1No 93 5 3
Yes 9 5 3 3
2No 66 4 4
Yes 4 5 3 8
3No 135 2 0
Yes 9 9 2 0
4No 99 1 1
Yes 3 10 6 1
Melan-A 1 No 8 3 7 2
Yes 6 11 3 0
2No 75 6 2
Yes 7 8 5 0
3No 77 5 1
Yes 5 10 2 3
4No 84 2 6
Yes 5 5 5 5
Filter 1: Reproducibility, Based on Percent Difference. The datasets were
grouped by the variation of reported MULITMER-positive frequencies in
staining duplicates. Duplicates that showed high variation (> 200%) were not
considered as a positive response and are indicate d in bold. *This group also
includes duplicates with missing data, namely only one staining was
performed.
Attig et al. Journal of Translational Medicine 2011, 9:108
/>Page 6 of 13
a positive response. Thirty nine replicates (12%) with
high variation b etween the duplicate measurements fell
into this group.
The second criterion was a visual inspection of the dot
plots to determine if the dot plot showed a clear clus-
tered population of MULTIMER
+
CD8
+
cells. The
scores assigned by two independent evaluators for each
dot plot were compared. In case of disagreement, a con-
sensus score was agreed up on by both evaluators: th ere
were only 11 instances of initial discordance. The sum
of the dot p lot scores for each staining in a duplicat e
was calculated and experiments with duplicates that had
a total score of ≤ 2 were not considered a positive
response. These are in dicated in bold in Table 6. A total
of 132 replicates (41%) fell into this group.
The visual inspection of dot plots is an intuitive and
subjective method for evaluating response detection
employed routinely by laboratories performing a MUL-
TIMER assay. The unexpected high fraction of results
(41% of all dot plots) that did not pass our strict filter
criteria stimulated us to check whether the dot plot
scores generated by the central reviewers overlaps with
the judgement of the individual investigators that had to
record whether they consider any given staining with
one of the two-relevant MULTIMERS as a successfully
detected response (yes/no). Interestingly, clear disagree-
ment between the central evaluation and the lab evalua-
tion was only observed in 12% of all experiments (74/
636 stainings) and was equally distributed between the
pp65 MULTIMER (12% clear disagreement) and the
Melan-A MULTIMER (11% clear disagreement; Addi-
tional file 1, Table S1).
The third filter applied was plausibility and called for
exclusion of MULTIMER positive values greater than
one percent. There were a total of 38 stainings that
resulted in greater than 1% MULTIMER specific binding
with 35 (92%) of these outlier values reported by three
labs (ID13, ID18 and ID19) suggesting technical difficul-
ties. Any duplicate where one or both of the stainings
were greater than 1% did not meet this criterion result-
ing in 21 replicates not being considered a positive
response. In fact, only 4 of these 21 replicates passed
both of the first two criteria. The reason for the outlying
event counts in the upper right quadrant for these four
duplicates were large MULTIMER
dim
CD8
dim
population
of cells in three cases and one dot plot in which a large
MULTIMER
dim
population occurred in the CD8-positive
cells (not shown).
Applyi ng these three filters allowed us to test whether
the favourable effects of DUMP channel that were
observed examining all the data sets could also be
observed after eliminating experiments that could con-
tain potential artefact s and hence would not be consid-
ered to have detected a response. Table 7 shows the
Table 6 Data Filter 2 - Visual Confirmation
Sum of Dot Plot Evaluation
Score*
Antigen Donor Dump Channel 0 1 2 3 4
CMV p65 1 No 001316
Yes 002316
2No 20 0 0 40
Yes 19 1 0 80
3No 001019
Yes 000020
4No 011116
Yes 011117
Melan-A 1 No 325210
Yes 314012
2No 42528
Yes 404012
3No 51419
Yes 125311
4No 83366
Yes 71754
Filter 2: Visual Confirmation from Dot Plot Evaluation. The reported dot plots
were assessed by a central review of all the dot plots. A dot plot was
assigned a score of “0” when there was clearly no clustered population (or the
experiment was not performed or not interpretable), a score of “1” when the
clustering was ambiguous and a score of “2” when there was clearly a
clustered population. The sum of the scores for each duplicate is presented in
the table. The columns in bold indicate experiments that did not meet the
optical evaluation criteria (< = 2) and therefore were not considered a
positive response.
Table 7 Filtered Dataset and Detection Rate
MULTIMER Donor Dump
Channel
Median
(filtered)
Detection
Rate
CMV pp65 1 No 0.11 16 (80%)
Yes 0.10 17 (85%)
2* No n.a. 0 (0%)
Yes n.a. 0 (0%)
3 No 0.17 18 (90%)
Yes 0.14 20 (100%)
4 No 0.08 17 (85%)
Yes 0.06 18 (90%)
Melan-A 1 No 0.18 10 (50%)
Yes 0.16 12 (60%)
2 No 0.23 9 (45%)
Yes 0.18 12 (60%)
3 No 0.10 10 (50%)
Yes 0.09 10 (50%)
4 No 0.06 5 (25%)
Yes 0.04 5 (25%)
Filtered results obtained using two MULTIMERS in four donors stratified by
use of a DUMP channel. For all sixteen experimental conditions the (i) the
median of the reported values from experiments with a positive response in
both conditions (filtered), and (ii) response detection rates are displayed. The
asterisk indicates a negative control donor.
Attig et al. Journal of Translational Medicine 2011, 9:108
/>Page 7 of 13
median frequency of reported antigen-specific T cells
response and t he detection r ates for all donor antigen
combinations for both conditions. When focusing only
on those paired experiment s (N = 78) that passed all
three filters for both conditions (DUMP and NO
DUMP), WITH dump channel results in all donor-anti-
gencombinationswereonaveragelowerthanNO
dump channel results (Median difference: 0.01, 95% CI:
0.01, 0.02, p < 0.001 Wilcoxon signed rank test). The
majority of labs were able to successfully detect (passed
all three filters) the three low pp65-specific T cell
responses. Interestingly, the detection rates for experi-
ments with the Melan-A MULTIMER were much lower
than for pp65 MULTIMER although responses against
both antigens were similar in frequency across the four
donors. Comparing the response detection rates between
the two conditions it appears that including a DUMP
channel did not lead to a higher detection rate.
In silico study on the independent value of DUMP
channel markers and dead cell dye use
In order to determine the relative impact of DUMP
channel markers and/or dead cell dye use to reduce the
background signal in MULTIMER experiments an in
silico study was performed. To this end, available FCS
files from this proficiency panel phase that originated
from the seven participating centers that applied both a
dead cell dye and DUMP channel markers were revis-
ited. A total number of 53 available FCS files represent-
ing stainings performed with the irrelevant MULTIMER
and the CMV-multimer in CMV-negative donor D2
were re-analyzed using four different gating strategies
for each f ile (NO DUMP/NO DEAD and NO DUMP/
WITH DEAD and WITH DUMP/NO DEAD and
WITH DUMP/WITH DEAD). As shown in Figure 2 the
highest signals were typically observed when NO DUMP
and NO dead cell dye were applied in the gating strat-
egy (blue). Excluding dead cells led to a decrease of the
non-specific signal (black) in a large fraction of experi-
ments which was even higher whe n DUMP channel
markers were included (red) in the gating strategy and
highest when a dead cell dye and DUMP were combined
(green). The median values observed for the four differ-
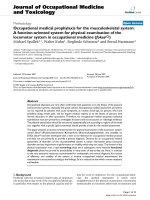
ent gating strategies as mentioned above were 0.046%
(NO DUMP/NO dead cell dye), 0.027% (NO DUMP/
WITH dead cell dye), 0.018% (WITH DUMP/NO dead
cell dye) and 0.015% (WITH DUMP/WITH dead cell
dye), respectively. The use of DUMP channel markers
or dead cell dye or the combination of both lead t o a
significant reduction (Wilcoxon rank sum test; p < 0.001
in all three tests) of the non-specific signal compared to
the results obtained without gating out unwanted c ells.
In addition the combination of DUMP channel markers
and a dead cell dye led to a significant reduction
compared to the use of either DUMP channel m arkers
or dead cell dye alone (Wilcoxon rank sum test; p <
0.001).
Interestingly, the median decreases between the four
different gating strategies in the in silico study matched
the results that were observed when comparing results
generated by the different labs and staining conditions.
Influence of gating styles and role of MULTIMER binding
to CD8-negative cells
A well-known critical factor in determining the amount
of antigen specific cells is the placement of gates and/or
quadrants. Central review of the dot plots revealed that
about 12 from 20 participating labs placed the upper
right gate close to the antigen negative population
("CLOSE” gating style) whereas 6 of the 20 labs placed
thehorizontalgateinsuchawaythatitwasquitedis-
tant from the MULTIMER-negative population of events
("DISTANT” gating style; see inserted dot plots adjacent
to Table 8). Two labs a pplied a mixed g ating style with
some gates being close to and some distant from the
MULTIMER-negative population. The 18 participants
with consistent gating style w ere stratified in two sub-
groups (CLOSE vs. DISTANT) and the median event
counts in the upper right quadrant for the two relevant
MULTIMERS (pp65 and Melan-A) ar e displayed in
Table 8. There were significan t differences in the fre-
quencies of pp65- (p < 0.001, two sample Wilcoxon
test) and Melan-A-specific (p < 0.001, two sample Wil-
coxon test) cells for close or distant gating strategies,
with close gating leading to much larger repor ted
%a
g
e of MULTIMER
+
CD8
+
cells
%age of MULTIMER
+
CD8
+
cells
no DUMP and no DEAD
1
.
00
0.10
0.01
0.001
0.001
0.01 0.10 1.0
0
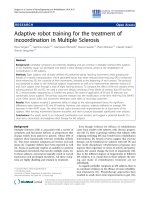
Figure 2 In silico st udy: The figure shows the frequency of events
detected in the MULTIMER-positive CD8-positive fraction when
neither DUMP channel markers nor dead cell dyes were included in
the gating strategy (x-axis) and the four corresponding event counts
on the y-axis in the gating strategy NO DEAD and NO DUMP (blue),
WITH DEAD and NO DUMP (black), NO DEAD and WITH DUMP
(red), WITH DEAD and WITH DUMP (green). The figure also shows
the resulting linear regression curves for each of the four data sets.
Attig et al. Journal of Translational Medicine 2011, 9:108
/>Page 8 of 13
percentages of CD8+ MULTIMER positive cells than
distant gating. The difference in the median percentages
of CMV pp65-specific cells between close and distant
gating strategies was 0.02, 0.03, 0.07, and 0.02 for
donors 1 - 4 respectively. This result was even more
dramatic when looking at the difference in the median
reported percentages of Melan-A-specific cells between
close and distant gating strategies: 0.13, 0.18, 0.06, and
0.07 for donors 1 - 4 respectively. Obviously, such big
differences preclude direct quantitative comparison of
results generated across institutions that use different
gating styles. Thus, description of gating style or display-
ing at least one example of a truly representative result
would be highly recommended for any publication of
MULTIMER experiments in human clinical trials, and is
likely to be crucial for harmonization of the gating strat-
egy in multi-institutional analyses.
We further investigated whether binding of pp65 and
Melan-A MULTIMERs in the CD8
+
versus the CD8
-
compartment occurs independently. Figure 3a displays
the percen tage of MULTIMER binding in CD8-negative
cells versus the percentage of MULTIMER binding in
CD8-positive cells for each staining from all seven
pp65- and Melan-A-positive donor-antigen combina-
tions. The values of MULTIMER b inding in CD8-posi-
tive and CD8-negative cells are linearly correlated
(Spearman’s correlation coefficient: 0.68, p < 0.001). The
figure demonstrates that in dot plots where there is a
large amount of MULTIMER staining in both CD8-posi-
tive and CD8-negative cells, the interpretation o f the
percentage of CD8+ MULTIMER positive cells might
become questionable. Two representative examples are
displayed in Figure 3b. Since MULTIMER-binding in
the upper left and upper right quadrants does not
always occur independently, we recommended that
MULTIMER results be displayed in a way that enables
the reader to determine the amount of MULTIMER
binding in bo th the CD8-negative and CD8-positive cell
fraction.
Discussion
The results generated in this MULTIMER proficiency
panel phase show that the introduction of a DUMP
channel to a MULTIMER experiment on average will
decrease the amount of non-specific MULTIMER-posi-
tive events in the CD8-cell population. The beneficial
effects of applying a DUMP channel strategy were
observed in non-censored data sets that employed
laboratory-specific criteria for gating, as well as in a cen-
sored data set where a common strategy for excluded
poor replicates and gating was em ployed. The reduction
of non-specific MULTIMER-binding after introduction
of a DUMP channel was observed in nearly half of all
experimen ts performed (Figures 1a and 1b). Notably, we
Table 8 Gating Style
MULTIMER Donor Gating Style Median Close Distant
CMV pp65 1 Close 0.13 ↓
Distant 0.10
2 Close 0.05 ↓
10
0
10
1
10
2
10
3
10
4
APC-A: CD8 APC-A
10
0
10
1
10
2
10
3
10
4
PE-A: CMV-Pentamer PE-A
2.35e-3 0.048
42.657.4
10
0
10
1
10
2
10
3
10
4
APC-A: CD8 APC-A
10
0
10
1
10
2
10
3
10
4
PE-A: CMV-Pentamer PE-A
2.09e-4 0.04
35.364.6
Distant 0.02
3 Close 0.18 ↓
Distant 0.12
4 Close 0.08 ↓
Distant 0.06
Melan-A 1 Close 0.18 ↓
Distant 0.05
2 Close 0.26 ↓
10
0
10
1
10
2
10
3
10
4
APC-A: CD8 APC-A
10
0
10
1
10
2
10
3
10
4
PE-A: MelA-Pentamer PE-A
0.034 0.076
42.857.1
10
0
10
1
10
2
10
3
10
4
APC-A: CD8 APC-A
10
0
10
1
10
2
10
3
10
4
PE-A: MelA-Pentamer PE-A
2.29e-3 7.28e-3
35.464.6
Distant 0.08
3 Close 0.13 ↓
Distant 0.06
4 Close 0.09 ↓
Distant 0.02
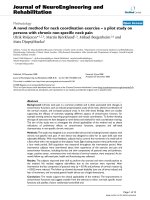
Overall Results Stratified by Close and Distant Gating Style. (left) The gating style of the participants were classified as “ close” or “distant” based on the gating
strategy applied. The table outlines the median percentages of MULTIMER-positive CD8-positive cells for each donor-antigen combination stratified by subgroup
for those experiments meeting all three criteria for a positive response. (right) The dot plots present two representative examples of “close” and “distant” gating
styles and the influence on resulting frequencies for the CMV-pp65 MULTIMER (upper row) and Melan-A MULTIMER (lower row).
Attig et al. Journal of Translational Medicine 2011, 9:108
/>Page 9 of 13
observed a 1.65-fold reduction of measured background
MULTIMER-binding in the whole group with a large
sub-group of experiments (approximately 50% of stain-
ings) that showed a 4.1-fold median reduction of t he
background. The absolute median reduction in the frac-
tion of experiments (48 of 100) that showed a clear
decrease was 0.049% (about 1 in 2000 CD8 cells) and
could be o bserved in protocols that used or did not use
a DEAD cell dye. An in silico gating study showed a
similar median background reduction for the indepen-
dent use of DUMP channel markers and or dead cell
dyes confirming the favorable effects of measures to
gate out unwanted cells.
Although the observed differences might appear small,
they can play a critical role. According to ICH guide-
lines (ICH Q2 (R1)) the backgrou nd noise of an analyti-
cal test may be used to determine the lower limit of
detection of an analytical test. Hence, measures to
reduce background increase assay sensitivity. Conse-
quently, the use of a DUMP channel and/or a dead cell
marker can become essential to attain assay sensitivity
in the range of 1 specific cell in 1,000-3,000 CD8
+
lym-
phocytes. Since most of the tumor antig en-specific CD8
T-cell responses, and also subdominant microbial speci-
fic CD8 T cells, are in this range, achieving a reliable
sensitivity around this threshold value is central to
establishing MULTIMER staining as a monitoring tool
in translational immunological research [14,15]. The
data sets generated in this proficiency panel phase sug-
gests that in about half of all experiments performed in
a variety of representative laboratories the detection of
low frequency T-cell responses will not be technically
feasible without use of a DUMP channel. In addition to
increasing the test sensitivity, the use of DUMP channel
antibodies may provide a more accurate measure of the
true antigen-specific signal by decreasing the number of
non-specific e vents in the CD8
+
cell population.
Although use of a DUMP channel might lead to a
reduced number of false- positive events in the quadrant
displaying the MULTIMER-positive CD8-positive cells
the only way to indeed confirm that a given event is a
true positive signal would be to clone and functionally
characterize the respective T cell or TCR.
A second outcome of this proficiency panel is that the
use of intuitive filters for response determination can
lead to an unexpected high number of experiments that
willnotbeconsideredofbeingasuccessfullydetected
response. The o rganizers of this panel acknowledge that
the cut-off value (200% difference) used to exclude
inconsistent duplicates and the dot plot evaluation score
were arbitrarily chosen and should not be considered as
a standard strategy to filter results from M ULTIMER
experimen ts. The chosen filters should rather be seen as
a pragmatic way to remove data sets that might include
artefacts and to compute response detection rates to
compare assay performance in the two tested conditions
(DUMP vs. NO DUMP) of this proficiency panel. It is
remarkable that although visual evaluation of dot plots
is supposed to be highly subjective, disagreement
between the central evaluation and the lab evaluation
was only observed in 12% (74/636 stainings) of all col-
lected dot plots. These results demonstrate that
although visual inspection is a rather crude and highly
subjective method for response determination, results
generated across institutionsleadtoclearlydiscordant
g
4.00
3.00
2.00
1.00
0.00
0.00
1.00 2.00 3.00 4.0
0
010
3
10
4
10
5
0
10
2
10
3
10
4
10
5
4.53e-3
0.066
34.965
010
3
10
4
10
5
0
10
2
10
3
10
4
10
5
4.52e-3 0.038
34.765.3
CMV pp65Melan-A / Mart-1
C
D
8
low backgroundhigh background
%age of MULTIMER
+
CD8
-
cells
%age of MULTIMER
+
CD8
+
cells
a
b
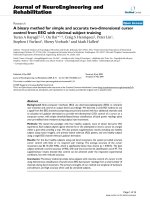
Figure 3 MULTIMER binding to CD8-positive cells versus
MULTIMER binding to CD8-negative cells. (a) The Figure displays
the percentage of MULTIMER binding to CD8-negative cells (y-axis)
versus the percentage of MULTIMER binding to CD8-positive cells
(x-axis) for each staining from a positive donor-antigen combination
(DUMP and NO DUMP). (b) The four dot plots illustrate
representative experiment results with a high background (left
column) and a low background (right column) for the CMV-pp65
MULTIMER (upper row) and the Melan-A MULTIMER (lower row).
Attig et al. Journal of Translational Medicine 2011, 9:108
/>Page 10 of 13
conclusions from a central evaluation only in the minor-
ity of cases. Although central optical evaluation of the
dot plots can be a valid method to con sistently rate data
from MULTIMER experiments, the optical evaluation
will always be inherently subjective. Hence there is an
urgent need to develop algorithms and computer-based
tools to identify clustered populations of events in a
multi-dimensional data space which are under develop-
ment [16-19]. Such algorithm s could potentially lead to
higher reproducibility, save time, and importantly,
enhance gating strategies even for experienced
operators.
The data shown in the third part of the results section
(Table 8) clearly demonstrate that gating style can dra-
matically change the result of an experiment. Accord-
ingly, we recommend adding at least one representative
dotplotwheneverresultsfromMULTIMERexperi-
ments are published. This could be done either a s part
of the material and methods section or as supplemen-
tary electronic material and should enable better under-
standing of the experiment. This st udy also provided
evidence that binding of MULTIMER to CD8
-
and CD8
+
cells does not always occur independently of each
other as suggested by the strong linear correlation
shown in Figure 3a. Thus, we recommend that MULTI-
MER results be displayed in such a way that the investi-
gator will also be able to view the amount of
MULTIMER binding in the CD8-negative cell fraction.
Based on these results, we revisited the Harmonization
Guidelines for MUL TIMER experiments that were
recently published [7]. Confirming the findings of the
previous panel, the number of CD8
+
events acquired
from the samples influenced the response detection
rates. In experiments withlessthananaverageof
100,000 positive CD8 cells counted, only 50% had a
response detected. However, in experiments with more
than 100,000 CD8 positive cells counted, 79% of all
(including both pp65 and Melan-A) responses were
detected (Additional file 1, Table S2). An additional
confirmation of previous findings was that the use of
more than 3 colors increased detection rates, compared
to the use of only 2 or 3 colors (Additional file 1, Table
(A) Establish lab SOP for MHC peptide multimer staining:
A1 Count at least 100,000 CD8 T cells per staining.
A2 Establish adequate measures to quantify non-specific binding of MULTIMER to CD8-positive
cells (e.g. irrelevant MULTIMER or autofluorescence).
A3 Establish adequate measures to reduce the amount of non-specific binding of MULTIMERS in the
CD8-positive population to allow accurate quantification (e.g. DUMP channel or DEAD cell dyes).
(B) Establish SOP for software analyses of stained samples, including:
B1 Gating strategy.
B2 Rules to set the gates.
(C) Establish a human auditing process of all final results:
C1 Are all dot plots correctly compensated?
C2 Have the gates been set correctly?
C3 Are the reported frequencies of multimer-positive cells plausible?
(D) Lab environment
D1 Only let experienced personnel (per lab SOP) conduct assay.
(E) Implement a structured framework to report data from MULTIMER experiments that makes
sure that essential pieces of information are not missed (e.g. MIATA or other MI projects).
E1 Showing at least one representative data set that provides information on the gating style applied
and the amount of MULTIMER binding to CD8-negative cells.
Figure 4 Expanded CIC HLA-Peptide Multimer Harmonization Guidelines.
Attig et al. Journal of Translational Medicine 2011, 9:108
/>Page 11 of 13
S2). These findings confirm the relevance of the pre-
viously published harmonization guidelines.
Conclusions
The main conclusion from this study is that use of a
DUMP channel should be recommended whenever high
sensitivity and accurate quantification of antigen-specific
T cells is the primary goal. In addition our results sug-
gest that the combination of a DUMP channel and a
dead cell dye leads to t he lowest non-specif ic MULTI-
MER binding observed after staining with an irrelevant
MULTIMER with median values around 1 non-specific
event per 5000 to 10000 gated CD8 T cells (Table 4). It
has to be noted that the current proficiency panel
design was not suited to formally determine the impact
of a DEAD cell dye (no paired experimental data sets
for this condition were generated) and thus the impact
of using a DEAD cell dye needs further study.
The results generated in this panel confirm the har-
monization guidelines from the first MULTIMER profi-
ciency panel and necessitate the expansion of the
existing guidelines for assay harmonization (Figure 4).
The expanded harmonization guidelines include the
recommendation to use irrelevant MULTIMERS to
quantify the non-specific MULTIMER binding of the
assay and to apply effective measures to keep the non-
specific binding of MULTIMERS as low as possible. In
addition recommendations on how to report experimen-
tal data from MU LTIMER exp eriments could b e
deduced from this panel phase, including the request to
provide sufficient information on the gating style and
the amount of MULTIMER staining observed in by-
standing CD8
-
.
Additional material
Additional file 1: Figure S1 and Tables S1 and S2
Acknowledgements
The organizers of this study are indebted to all the participating labs for
their constant support of the proficiency panel program. The organizers also
thank Beckmann Coulter and ProImmune for supporting the study by
donating the required MULTIMER reagents.
Author details
1
Division of Translational and Experimental Oncology, Department of Internal
Medicine III, University Medical Center of the Johannes Gutenberg-University,
Mainz, Germany.
2
Department of Biostatistics, New York University, New
York, NY USA.
3
ZellNet Consulting, Inc., Fort Lee, NJ USA.
4
Department of
Pathology and Laboratory Medicine, University of Pennsylvani a School of
Medicine, Abramson Family Cancer Research Institute, Philadelphia, PA USA.
5
Vaccine Research East and Early Development, Pfizer Inc. Pearl River, NY
USA.
6
Surgery and Immunology, Duke University Medical Center, Durham,
NC, USA.
7
Ludwig Center for Cancer Immunotherapy, Memorial Sloan-
Kettering Cancer Center, New York, NY USA.
8
Departments of Gynecologic
Oncology and Immunology, Roswell Park Cancer Institute, Buffalo, NY, USA.
9
Bristol-Myers Squibb, Wallingford, CT USA.
10
Translational Tumor
Immunology Group, Ludwig Center for Cancer Research of the University of
Lausanne, Switzerland.
11
Research & Development, BioNTech AG, Mainz,
Germany.
Authors’ contributions
SA carried out the collection and assembly of data, performed data analysis,
did the visual evaluation of all dot plots and wrote parts of the manuscript.
LP coordinated the collection and assembly of data, did all statistical analysis
and was involved in the interpretation of the data and manuscript writing.
SJ did the overall project management, coordinated the distribution of
material for the study, helped to interpret the data, wrote the manuscript
and did the final approval of the manuscript. MK, MP, LMcN, TC, JY, KO and
AH were driving the conception and design of the study, selected the
donors for the study, interpreted the data and wrote the manuscript. PR was
a co-leader of this study, and was involved in all activities starting from the
concept phase until final interpretation of results and approval of the
manuscript. He also coordinated the pre-testing experiments in his lab. CMB
was the proficiency panel leader and mainly involved at all stages of the
project, including organizational and scientific aspects, data analysis and
interpretation as well as manuscript writing and approval. All author s read
and approved the final manuscript. The members of the CRI-CIC Assay
Working group critically reviewed and approved the study design prior to
initiation of the study and critically commented to the final version of the
manuscript.
Competing interests
The authors declare that they have no competing interests.
Received: 14 April 2011 Accepted: 11 July 2011 Published: 11 July 2011
References
1. Schloot NC, Meierhoff G, Karlsson FM, Ott P, Putnam A, Lehmann P, et al:
Comparison of cytokine ELISpot assay formats for the detection of islet
antigen autoreactive T cells. Report of the third immunology of diabetes
society T-cell workshop. J Autoimmun 2003, 21:365-376.
2. Cox JH, Ferrari G, Kalams SA, Lopaczynski W, Oden N, D’souza MP: Results
of an ELISPOT proficiency panel conducted in 11 laboratories
participating in international human immunodeficiency virus type 1
vaccine trials. AIDS Res Hum Retroviruses 2005, 21:68-81.
3. Janetzki S, Cox JH, Oden N, Ferrari G: Standardization and validation
issues of the ELISPOT assay. Methods Mol Biol 2005, 302:51-86.
4. Maecker HT, Rinfret A, D’Souza P, Darden J, Roig E, Landry C, et al:
Standardization of cytokine flow cytometry assays. BMC Immunol 2005,
6:13.
5. Britten CM, Janetzki S, van der Burg SH, Gouttefangeas C, Hoos A: Toward
the harmonization of immune monitoring in clinical trials: Quo vadis?
Cancer Immunol Immunother 2007, 57:285-288.
6. Janetzki S, Panageas KS, Ben-Porat L, Boyer J, Britten CM, Clay TM, et al:
Results and harmonization guidelines from two large-scale international
Elispot proficiency panels conducted by the Cancer Vaccine Consortium
(CVC/SVI). Cancer Immunol Immunother 2008, 57:303-315.
7. Britten CM, Janetzki S, Ben Porat L, Clay TM, Kalos M, Maecker H, et al:
Harmonization guidelines for HLA-peptide multimer assays derived from
results of a large scale international proficiency panel of the Cancer
Vaccine Consortium. Cancer Immunol Immunother 2009, 58:1701-1713.
8. Smith SG, Joosten SA, Verscheure V, Pathan AA, McShane H, Ottenhoff TH,
et al: Identification of major factors influencing ELISpot-based
monitoring of cellular responses to antigens from Mycobacterium
tuberculosis. PLoS One 2009, 4:e7972.
9. Altman JD, Moss PA, Goulder PJ, Barouch DH, McHeyzer-Williams MG,
Bell JI, et al: Phenotypic analysis of antigen-specific T lymphocytes.
Science 1996, 274:94-96.
10. Janetzki S, Britten CM, Kalos M, Levitsky HI, Maecker HT, Melief CJ, et al:
“MIATA"-minimal information about T cell assays. Immunity 2009,
31:527-528.
11. Britten CM, Janetzki S, van der Burg SH, Huber C, Kalos M, Levitsky HI, et al:
Minimal information about T cell assays: the process of reaching the
community of T cell immunologists in cancer and beyond. Cancer
Immunol Immunother 2010, 60:15-22.
12. Smith JG, Joseph HR, Green T, Field JA, Wooters M, Kaufhold RM, et al:
Establishing acceptance criteria for cell-mediated-immunity assays using
Attig et al. Journal of Translational Medicine 2011, 9:108
/>Page 12 of 13
frozen peripheral blood mononuclear cells stored under optimal and
suboptimal conditions. Clin Vaccine Immunol 2007, 14:527-537.
13. Roederer M: How many events is enough? Are you positive? Cytometry A
2008, 73:384-385.
14. Coulie PG, van der Bruggen P: T-cell responses of vaccinated cancer
patients. Curr Opin Immunol 2003, 15:131-137.
15. Boon T, Coulie PG, Van den Eynde BJ, van der Bruggen P: Human T cell
responses against melanoma. Annu Rev Immunol 2006, 24:175-208.
16. Boddy L, Wilkins MF, Morris CW: Pattern recognition in flow cytometry.
Cytometry 2001, 44:195-209.
17. Chan C, Feng F, Ottinger J, Foster D, West M, Kepler TB: Statistical mixture
modeling for cell subtype identification in flow cytometry. Cytometry A
2008, 73:693-701.
18. Boedigheimer MJ, Ferbas J: Mixture modeling approach to flow
cytometry data. Cytometry A 2008, 73:421-429.
19. Frelinger J, Ottinger J, Gouttefangeas C, Chan C: Modeling flow cytometry
data for cancer vaccine immune monitoring. Cancer Immunol Immunother
2010, 59:1435-1441.
doi:10.1186/1479-5876-9-108
Cite this article as: Attig et al.: A critical assessment for the value of
markers to gate-out undesired events in HLA-peptide multimer staining
protocols. Journal of Translational Medicine 2011 9:108.
Submit your next manuscript to BioMed Central
and take full advantage of:
• Convenient online submission
• Thorough peer review
• No space constraints or color figure charges
• Immediate publication on acceptance
• Inclusion in PubMed, CAS, Scopus and Google Scholar
• Research which is freely available for redistribution
Submit your manuscript at
www.biomedcentral.com/submit
Attig et al. Journal of Translational Medicine 2011, 9:108
/>Page 13 of 13