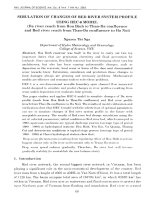
Using the analytic signal method of gravity gradient tensor (GGT) to determine the location and depth of the faults in the pre cenozoic basement rocks of the red river trough VJES 38
Bạn đang xem bản rút gọn của tài liệu. Xem và tải ngay bản đầy đủ của tài liệu tại đây (468.88 KB, 10 trang )
Vietnam Journal of Earth Sciences Vol 38 (2) 143-152
Vietnam Academy of Science and Technology
Vietnam Journal of Earth Sciences
(VAST)
/>
Using the analytic signal method of gravity gradient tensor
(GGT) to determine the location and depth of the faults in
the Pre-Cenozoic basement rocks of the Red River trough
Nguyen Kim Dung*1, Do Duc Thanh2
1
Institute of Marine Geology and Geophysics, Vietnam Academy of Science and Technology
Hanoi University of Science, Vietnam National University
2
Received 12 August 2015. Accepted 13 April 2016
ABSTRACT
In this paper, we present the study results of using the directional analytic signal method of gravity gradient
tensor (GGT) and the Euler deconvolution of the directional analytic signals to determine location and estimate the
depth of fault systems in the Pre-Cenozoic basement in order to improve the efficiency of Pre-Cenozoic basement
structure. The method is tested on the 3D digital model, which shows that not only the location and depth of
resources are determined but also can overcome undue interference, which could be met in the previous analytic
signal methods. To study more about the applicability of the method, we applied the method for the gravity anomaly
data of Red River Trough. Obtained preliminary results have shown the location of major faults in the region: Song
Lo fault, Song Chay fault, Red River fault, etc. and initially (in the first time), by this method, the depth of over 10
km the fault persists. This depth is deeper than the depth of the surface of Cenozoic boundary determined by other
methods, proves that the faults appear in the Pre-Cenozoic basement.
Keywords: Gravity gradient tensor; Euler deconvolution; fault; analytic signal.
©2016 Vietnam Academy of Science and Technology
1. Introduction
Researches on the Pre-Cenozoic basement
structure, especially location and depth of the
fault in the basement rock determined by
gravity anomalies data always get the attention of many national and international
geophysicists. However, the methods used to
study the structures of Pre-Cenozoic rock,me
now, rock until now are still very limited in
national literature. Examples are the 2D, 3D
inverse problem solution methods (Do Duc
Corresponding author, Email:
Thanh, 2013) and 2.5 D one, according to the
correlation algorithm (Cao Dinh Trieu, 2002,
Pham Nam Hung, 2011) or the method of
blocks structure model of Earth's crust (Bui
Cong Que and Hoang Van Vuong, 1996) in
order to determine the density distribution in
the basement.
To determine the location of geological
faults, the most commonly used method in
Geophysics is the method of determining the
maximum horizontal gradient vector of gravity anomalies (Dinh Van Toan, 2000; Le Huy
Minh et al., 2002). The Euler deconvolution
method for the vertical derivative data of
143
N.K. Dung and D.D. Thanh/Vietnam Journal of Earth Sciences 38 (2016)
gravity anomaly is used to determine not only
the location but also the depth of the geological structures (Vo Thanh Son et al., 2005).
The application of 3D signal analysis method
(Le Huy Minh et al., 2005) and 3D signal
analysis using higher derivative (Vo Thanh
Son et al., 2007) initially has also been studied
and are applied by these authors for analyzing
and processing aviation magnetic anomalies at
Tuan Giao and Hoa Binh area. The study
results show that in addition to its other
advantages, this method still has some limitations in overcoming the phenomenon of
interference in the case of complex real
environments when the differentiation of the
anomalous sources is not clear.
Recently, from application of components
of the gravity gradient tensor (GGT), many
geophysicists have proposed a very effective
method for determining the location and depth
of the source (Beiki M., 2010; Beiki M. and
Laust B. Pedersen 2010; Feng-Xu Z., 2005;
Micku K. L., 2001; Oruc et al., 2013;
Pedersen L. B. and T. M. Rasmussen, 1990;
Zhang C., 2000; Zhou W., Xiaojuan Du,
2013). Therefore, the application of modern
methods to determine the structure of PreCenozoic basement on the continental shelf of
Vietnam is very necessary to improve the
accuracy of the result.
In this paper, we studied and applied the
directional analytic signals method which is
built from the components of the gravity
gradient tensor (ED) and the Euler deconvolution method from the direction analytic
signal data (EDDAS) to determine the location and depth to faults in pre-Cenozoic
basement. With this approach, we tested on
the modeling to confirm the applicability of
the method before applying for the real data
on the Red River trough.
2. Theoretical background
Gravity gradient tensor (GGT)
mined as follows:
144
is deter-
2U
2
x
2U
xy
2U
zx
2U 2U
xy xz
g xx
2U 2U
g yx
y 2 yz
g zx
2U 2U
zy z 2
g xy
g yy
g zy
g xz
g yz
g zz
(1)
We might define an analytic signal for
every single row, called directional analytic
signals in x,y,y-, and z-direction. The directional analytic signal in matrix form can be
written as:
Ax ( x, y, z ) g xx
Ay ( x, y, z ) g yx
A ( x, y, z ) g zx
z
g xy
g yy
g zy
g xz 1
g yz 1
g zz i
(2)
Consequently, the amplitudes of the
directional analytic signals are:
Ax ( x, y, z )
Ay ( x, y, z )
Az ( x, y , z )
g xx
2
g xy g xz
2
g g g
2
g zx
yx
2
g zy g zz
yy
2
2
2
(3)
yz
2
2
Debeglia and Corpel (1997) showed that
the derivatives of the analytic signal
amplitude give a more efficient separation of
anomalies caused by interfering structures
than the analytic signal amplitude. Derivatives
of directional analytic signals in x,y,y-, and zdirections can be expressed as:
g 2 g g 2 g g 2 g
A ( x, y, z ) x x 2 y xy z xz
(4)
x
A ( x, y, z )
A ( x, y, z )
y
A ( x, y, z)
z
g
x
2 g g 2 g g
2
yx y y z
A ( x, y, z )
2 g
yz
g 2 g g 2 g g 2 g
x zx y zy z z 2
(5)
(6)
Where is coefficients of x, y and z.
Function to represent the combination of analytic signal derivatives Axz and Ayz can be a
A ( x, y, z)
function to detect the edges on the body:
Vietnam Journal of Earth Sciences Vol 38 (2) 143-152
ED
Axz Ayz
2
2
(7)
ED function allows to detect edges on the
body better than HGA function. HGA
function is a standard function which is
widely used to detect edges in the horizontal
gradient amplitude.
g xz
HGA
2
g yz
2
(8)
Zhang et al (2000) showed that for GGT
data, the standard Euler deconvolution can be
extended to:
Ax
x
Ay
x
Az
x
Ax
y
Ay
y
Az
y
Ax
z
Ay
z
Az
z
A
A
Ax
y x z x Ax
Ax
x
y
z
x0 x
Ay
Ay
y Ay
y
z
Ay ;
Ay 0 x
y
z
z0
x
n Az
Az
Az
y
z
Az
Az
x
x
y
z
(9)
For a window have N data points, equation
(9) can be written as :
Gm d
(10)
and can be solved using the least-squares
estimate mest as follows:
mest GT G GT d
1
(11)
Where G and d are 3N × 4 and 3N × 1
matrices. Then the residual error of data is:
d d pred d
where :
(12)
d pred Gmest
(13)
Then the covariance matrix of the estimated model is given as:
Covmest d2 G T G
d
N
where d2
i 1
i
N
c11
c
Covmest 21
c31
c41
1
r0 c11 c22 c33 ; n c44 ;
3.1. Building of the model
To confirm the applicability of the method
using the directional analytic signals of the
components of the gravity gradient tensor
(ED) to determine the location and depth of
the faults in Pre-Cenozoic basement rock for
in case of the 3D problem, on the basis of the
theory presented above, we proceed to build a
computer program to determine edges and
depth as the source by gravity anomalies data.
Here, the source of the gravity anomaly was
modeled as vertical cylinders located at different depths. To see clearly the effectiveness
and applicability of the method, we launched
two models to calculate: The first model has 2
single objects; the second model is more complex, consisting of 5 objects that can cause
anomaly and having both local and regional
properties, in which the anomalies caused by
5th objects have large size and lie deeper than
other objects. Observation surface for both
models has a size of 150 × 150 km and the
distance between two data points in both two
directions x and y is dx = dy = 1km. The
parameters of the model are given in (tables 1
and 2). The programming language used is
Matlab.
Table 1. The parameters for model 1
X1/X2
Object 1 65/75
Object 2 75/85
and
(16)
3. Modeling and results
(14)
2
c12 c13 c14
c22 c23 c24
c32 c33 c34
c42 c43 c44
and the standard error of source location and
structural index is given by:
Y1/Y2
75/85
65/75
Z1/Z2
1/5
2/5
Excess density
(g/cm3)
0.2
0.2
Table 2. The parameters for model 2
X1/X2
(15)
Object 1
Object 2
Object 3
Object 4
Object 5
30/40
65/75
75/85
110/120
50/100
Y1/Y2
75/85
75/85
65/75
65/75
50/100
Z1/Z2
1/4
1/6
2/6
2/6
6/12
Excess density
(g/cm3)
-0.1
0.2
0.2
0.3
0.4
145
N.K. Dung and D.D. Thanh/Vietnam Journal of Earth Sciences 38 (2016)
3.2. The result of model application
The assumed gravity anomalies which are
caused by the prisms having the parameters as
above were determined by Rao and Murthy,
1990, ED function is calculated for each point
on the surface z0 = 0. In order to point out the
advantages of the method using the ED function in determining edges over the source, we
also calculate HGA function on this observation surface. For both functions, the line
connecting maximum points will give us the
edges of the source.
To estimate the depth to edges from the
source, we used Euler method of deconvolution of the directional analytic signals combined with slide windows method in which
the center of the window is maximum ED
points. The use of this data is different compared to the use of other sources of data,
which are the components of the gravity
tensor or using higher vertical derivatives (Vo
Thanh Son et al., 2005; Vo Thanh Son, Le
Huy Minh, 2007). In Euler deconvolution
method, the structure index and size of the
window are two important parameters, which
decide the accuracy of the method. Each
structural indicator characterizing certain geological objects, so depending on the studied
objects that the structural indicators are selected suitably. The window size also affects
the resolution of study depth and therefore, is
selected to represent the effect on a single
source type which should be studied. The
problem of structure index and size of the
window, and how to choose them reasonably
is studied by many national and international
authors (Reid AB et al., 2013; Vo Thanh Son,
Le Huy Minh, 2005). Usually, the author only
chooses an unique structure index (as a source
filtering), however, in this article, the edges
from the source have been determined by the
maximum ED points, so in these maximum
points. There will have many structure
indexes, according to the equation (16), each
maximum ED point will have one structure
indicator. To solve this problem, at each
146
maximum ED point we need a loop to find the
most structure index which corresponds with
the depth to edges with the smallest error. In
order to stabilize the data error, the authors
select one structure index =0.05 and put it into
structure index space. The selected structural
indicators are assigned to directly into 4th
component of the vector in the equation (13)
before calculating covariance matrix equation
(14). With the pre-assigned structure index
the obtainment of conversed result is more
rapid, avoiding the re-solution at positions,
which have unstable structure index or depth
outside the selection. Results also showed that
the study depth obtained for both models is
best when the selected window size is 14
points, wx = wy = 14. Thus, the issue of the
Euler deconvolution by this way, from
depending on two parameters (the structure
index and size of the window) becomes only
depending on one parameter (the size of the
window). This makes a difference in compare
with the Euler deconvolution methods that are
often used (Vo Thanh Son et al., 2005).
Calculation results for model 1 are shown in
Figure 1 and Figure 2. Figure 1 shows the
results of determination of the edges from the
source by both ED and HGA function, and
Figure 2 shows the results of determination of
the depth to the edges of source using Euler
deconvolution of the directional analytic
signals (EDDAS).
Figure 1. The results determine source edges for model
1: a) Function HGA, b) Maximum HGA, c) Function
ED, d) Maximum ED
Vietnam Journal of Earth Sciences 38 (2016) 143-152
Figure 2. The results of the source depth for model 1: a) Observation data, b) Depth of source, c) Frequency
appear depth
Figure 3. The result determine source edges for model 2: a) Function HGA; b) Maximum HGA; c) Function ED;
d) Maximum ED
Figure 4. The result of the source depth for model 2: a) Obesrvation data; b) Depth of source; c) Frequency appear depth
147
N.K. Dung and D.D. Thanh/Vietnam Journal of Earth Sciences 38 (2016)
Calculation results for model 2 are shown
in Figure 3 and Figure 4, in which the positions of calculated result are arranged respectively as shown in Figure 1 and figure 2.
3.3. Discussion
Based on the results obtained from the program construction and test on models from
simple to complex, we can give the following
comments:
- Despite fairly complex algorithm, the use
of analytic signal method under the direction
of the components of the gravity gradient tensor (ED) and applied to the computer
programs we built still allows to determine the
edge and to estimate the depth of source.
- The determination of the edges of source
by using the maximum ED method gives the
higher accuracy than by using the traditional
maximum HGA method. Specifically, signal
maximum ED tackles the phenomenon of
interference better than a signal maximum
HGA when the objects cause anomalies,
which have weak differentiation on both horizontal and vertical directions.
- The use of the Euler deconvolution
method to determine the depth of source by
this way has overcome the dependency on the
structure index.
4. Applying the method to determine the
location and estimate the depth of the faults
in Pre-Cenozoic basement rocks of the Red
River trough
In this section, based on the computer
programs set up and tested on the digital
model, we conducted a test by applying the
directional analytic signals method of gravity
gradient tensor (ED) and the Euler deconvolution of the directional analytic signals to
determine location and estimate the depth to
edges of source in the Red River trough.
Herein, the study area is bounded by latitudes
20°9.8’N and 21°35.7’N and by longitudes
105°6.5’E and 106°37.1’E. The data source
148
(Input data) used in this research was the
Bougher gravity anomaly data of the study area
at the scale of 1:200,000 which was established
by the Department of Geology and Minerals of
Vietnam in 1995 based on the normal gravity
field formula of Helmert (1901-1909). The
gravity anomaly data had been edited and
linked to the Posdam International standard
system with the density of intermediate layer δ
=2.67g/cm3; terrain correction was calculated
by the Prisivanco method.
The Red river trough is characterized by a
quite complex geological-tectonic setting and
there are many major faults such as Song Lo
fault, Vinh Ninh fault, Thai Binh fault, Song
Chay fault and Red River fault. All faults
have the direction of northwest - southeast
and parallel to each other; they form a large
tectonic destruction system and penetrate
through the Earth crust. They play an important role in the map of regional tectonic
structure and create a ladder-like structure
which has uplifted zones alternating with
subsidence zones, expand and sink into the
southeast. In many previous studies, the
trough of Hanoi was divided into three main
structural zones: The southwest structural
zone, which is an uplift zone, locates between
two deep regional faults, which are the Red
River fault and the Song Chay fault. The
center structural zone is limited by Song Chay
fault and Song Lo fault, which are plugging
in opposite directions. Between these two
faults, the Thai Binh and the Vinh Ninh faults
are also plugging in opposite directions. All
these faults create a SouthWestern-Northeast
wave band that characterizes the structure of
the region. Northeast structural zone is limited
by Dong Trieu fault and Song Lo fault and is
an uplift structural zone comparing to the
Center structural zone. There were many
books and researches discussing fault systems,
regional tectonic characteristics in this area
such as Phan Trong Trinh et al., 2000; Phan
Trong Trinh, 2012; Cao Dinh Trieu and Pham
Vietnam Journal of Earth Sciences Vol 38 (2) 143-152
Nam Hung, 2008; Nguyen Dang Tuc, 2000;
Nguyen Dang Tuc, 2004; Hoang Huu Hiep
and Nguyen Huu Nam, 2014,... Therefore, we
will discuss on the geological characteristic in
general and focus on research of fault systems
in the region in detail.
To study the deep source, especially in the
Pre-Cenozoic basement rocks, we increased
the height of the field by 8 km. At this
surface, the obtained gravity anomaly field
was partly separated to the local gravity
anomaly field which had a short wavelength
so the gravity effect mainly depends on the
depth sources. This alternative anomaly field
will be used to determine location and depth
to the source. During calculation process,
parameters of the selection structure index and
the window size used to calculate are the
parameters which were selected and tested by
the above models. The obtained results of the
location and the depth to the edge of a
resource in the study area by applying this
method (ED and EDDAS) are represented on
Figure 5, showing the points with different
colors. In this figure, a position of a point
reflects an edge of the source, and its color
shows the depth of source with various
intervals. To highlight the structure within the
study area, the system of these colored points
is presented by vertical quadratic derivative
values of the gravitational field Gzz (only Gzz
> 0) and of the horizontal gradient vector field
of Gzz function (arrows). In this method, we
separated the study depth into six different
segments: 0-2 km, 2-4 km, 4-6 km, 6-8 km, 810 km, and > 10 km. The recorded results
showed that locations of major faults in the
study area were expressed quite clearly as
Song Lo fault, Vinh Ninh fault, Song Chay
fault, Thai Binh fault, Red River fault, etc.
All faults were in northwest - southeast
direction, paralleled to each other and were
recognized easily by observing the maximum
ED points and the horizontal gradient vectors
of the Gzz function in the same direction. The
results also illustrated that gradient vectors of
the 2nd vertical derivative of Song Lo fault
and Thai Binh fault ran along the maximum
ED points in southwest - northeast direction,
while the gradients of Song Chay fault and
Vinh Ninh fault were almost in northeast southwest direction (Figure 5). In addition, the
uplift zones (with gradient vector of the Gzz
function directing into the center) including
Hanoi center uplift, Kien Xuong uplift and
Nam Dinh uplift and the subsidence zones
(with gradient vector of Gzz function
directing outward the center) Ninh Binh
sunken, Hai Duong sunken, Dong Quan
Sunken also was found in the area. Comparing
to the previous study results, this result shows
that the location of the fault system in the
study area is quite similar. Therefore, the
application of the maximum ED points to
determine edges of the source is effective.
The result of depth shows that the depth of
source in the research area is from 3 to 17 km,
mainly at 6 km and that of major faults are
greater than 8 km. These obtained depth values may be the depth of the top or the bottom
of a source, or the depth which crosses
another source that is a picture of a geological
cross-section. However, where is the existence and appearance of the sources, in the
Pre-Cenozoic basement or the Cenozoic
sediment? To study sources existing in the
Pre-Cenozoic basement, we compare the
depth values determined by seismic and
gravity methods to the depth of Pre-Cenozoic
basement (Pham Nam Hung and Le Van
Dung, 2011). In results, the depth values
along the major faults can lie on or under the
Pre-Cenozoic basement surface, this indicates
that a complex development of the fault is not
only on the surface but also in depth and
confirms the appearance of faults in the PreCenozoic basement.
According to Cao Dinh Trieu (2002), the
faults in the Pre-Cenozoic basement which
continue to develop and penetrate to crust are:
Red River Fault (over 60km), Song Chay fault
(35-40 km), Song Lo fault (30-40 km), Vinh
Ninh fault (20-30 km). Because the data
source is limited, in this article, we only apply
the method to study the appearance of the
149
N.K. Dung and D.D. Thanh/Vietnam Journal of Earth Sciences 38 (2016)
sources which lies in the Pre-Cenozoic basement, and we will not discuss about the
bottom depth of this fault. To recognize faults
exactly, we digitized Figure 5 according to the
maximum ED points and the results are
shown in Figure 6.
Figure 5. The location and estimate depth of source and frequency appear depth at z=8
150
Vietnam Journal of Earth Sciences 38 (2016) 143-152
- Results of the test on the area of the Red
River trough show that the method can determine the major faults in the region. Moreover,
the method also illustrates that the faults
found at depths over 8 km, even to 15 km, are
the faults destroyed in the Pre-Cenozoic basement.
- Although there are a lot of advantages,
applying many times derivative in the method
makes many error peaks during calculation at
the surface z=0. To solve this problem, we can
calculate the average of gravity field or raise
gravity anomaly field before calculation in
detail.
Acknowledgments
Figure 6. The faults obatian by maximum of function ED
5. Conclusions
Based on the results obtained from the
program construction, test on models and
application the real data of the Red River
trough, we can give few comments as follows:
- Using analytic signals of a gravity gradient tensor (GGT) method to determine
the ED of the directional analytic signals
amplitude function helps overcome the
phenomenon of interference and provide
better resolution than the HGA of traditional
analytic signal amplitude function. It is a new
method to determine the accurate location and
estimate the depth of fault systems.
- As the object of this study is the faults in
the Pre-Cenozoic basement rock, a combination of processing methods for gravity data
including transformative method of gravity
field, the analytic signal methods, and Euler
deconvolution for data of the directional analytic signals of gravity gradient tensor were
used, which allows not only to identify the
location but also estimate the beginning depth
and the end depth of the fault, so that we can
estimate the depth, strike and dip angle of the
fault exactly and rapidly.
The authors wish to thank to project
VAST06.01/15-16 had support necessary conditions to complete this article.
References
Mickus,K.L., Juan Homero Hinojosa, 2001. The complete
gravity gradient tensor derived from the vertical component
of gravity: a Fourier transform technique. Journal of
Applied Geophysics 46, 159-174.
Beiki M, 2010. Analytic signals of gravity gradient tensor and
their application to estimate source location. Geophysics,
Vol.75, No.6, 159-174.
Beiki M, 2011. New techniques for estimation of source
parameters. Uppsala Universitet.
Beiki M., Pedersen, L.B., 2010. Eigenvector analysis of gravity
gradient tensor to locate geologic bodies. Geophysics 75,
I37-I49.
Bhaskara Rao, D., Prakash, M.I., and Ramesh Babu, N., 1990.
3 and D modeling of gravity anomalies with variable
density contrast. Geophys. Prosp, Vol.38, 411-422.
Blakely, R. J., and R. W. Simpson, 1986. Approximating edges
of source bodies from magnetic or gravity anomalies:
Geophysics,51, 1494-1498,doi: 10.1190/1.1442197.
Bui Cong Que, Hoang Van Vuong, 1996. Investigation on the
density distribution of Pre-Cenozoic fundament in the
South - East Viet Nam shelf by the volumetric structural
modelling method of the Earth crust. Proceeding of marine
geology and geophysics study works, Vol, 2, Publisher of
Science and Engineering, 1996, 277-285.
Cao Dinh Trieu, Pham Huy Long, 2002. Tectonic fault in
Vietnam. Publisher of Science and Engineering.
151
N.K. Dung and D.D. Thanh/Vietnam Journal of Earth Sciences 38 (2016)
Cao Dinh Trieu, Pham Nam Hung, 2008. Some characteristics
Oruỗ, B., Keskinsezer, A., 2008. Structural setting of the
of the geological structure in the Cenozoic in southwest of
Northeastern Biga Peninsula (Turkey) from tilt derivatives
Hanoi trough based on data analysis of gravity and other
of gravity gradient tensors and magnitude of horizontal
geological-geophysical data.
Debeglia, N., and J. Corpel, 1997. Automatic 3-D interpretation
gravity components. Pure Appl. Geophys. 165, 1913-1927.
Oruỗ, B., Sertcelik, I., Kafadar, O., Selim, H.H., 2013.
of potential field data using analytic signal derivatives.
Structural interpretation of the Erzurum Basin, eastern
Geophysics,62, 87-96, doi:10.1190/1.1444149.
Turkey, using curvature gravity gradient tensor and gravity
Do Duc Thanh, Nguyen Kim Dung, 2013. Determine density
contribution of basement rock by modeling of 3D gravity
inversion of basement relief. J. Appl. Geophys. 88,
105-113.
inversion. Vietnam Journal of Earth Sciences, 35, 1, 47-52.
Pedersen, L. B., and T. M. Rasmussen, 1990. The gradient
Feng-Xu,Z, Ling-Shun, M., et al., 2005. Calculating normalized
tensor of potential field anomalies: Some implications on
full gradient of gravity anomaly using hilbert transform .
data
Chinese journal of geophysics, vol.48, No.3, 777-784.
Geophysics,55, 1558-1566, doi: 10.1190/1.1442807.
Hoang Huu Hiep, Nguyen Huu Nam, 2014. Geometrical
characteristics and kinetic mechanism of the fault system in
the center of Hanoi trough and their role in the formation
and destruction of Cenozoic structural traps. Journal of the
Oil and Gas, Vol. 9, 26-32.
/>Le Huy Minh, Luu Viet Hung, 2003. Preliminary interpretation
for the map of magnetic anomaly on the East Sea and
collection
and
data
processing
of
maps.
Pham Nam Hung, Le Van Dung, 2011. The deep structures of
Hanoi region and adjacent areas on the basic of gravity
data analysis. Journal of Sciences of the Earth, Vol.33,
No.2, 185-190.
Phan Trong Trinh, 2012. Young tectonics and modern
geodynamics in Vietnam sea and adjacent areas. Publisher
Natural sciences and technology.
adjacent areas. Vietnam Journal of earth sciences,
Phan Trong Trinh, Hoang Quang Vinh, Nguyen Dang Tuc, Bui
Publisher of Science and Engineering, Ha Noi, 25, 2,
Thi Thao, 2000. Young tectonic activity of the Red River
173-181.
Fault Zone and adjacent areas. Vietnam Journal of Earth
Le Huy Minh, Luu Viet Hung, Cao Dinh Trieu , 2001. Modern
sciences, 22, 4, 325-336.
methods from magnetic data analysis applied to Tuan Giao
Reid,A.B, et al., 2013. Avoidable Euler errors - the use and
area. Vietnam Journal of Earth Sciences, Publisher of
abuse of Euler deconvolution applied to potential fields.
Science and Engineering, Hanoi, 22, 3, 207-216.
European association of geoscientists & engineers,
Le Huy Minh, Luu Viet Hung, Cao Đinh Trieu, 2002. Using the
Geophysical Prospecting.
maximum horizontal gradient vector to interpret magnetic
Schneider. M, R.Stolz, S.Linzen, M.Schiffler, A.Chwala,
and gravity data in Vietnam. Vietnam Journal of earth
M.Schulz, 2013. Inversion of geo - magnetic full - tensor
sciences, Publisher of Science and Engineering, 24, 1,
gradiometer data. Journal of Applied Geophysics 92,
67-80.
57-67.
Le Huy Minh, Vo Thanh Son et al., 2005. The three-
Vo Thanh Son, Le Huy Minh et al., 2007. Determining the
dimensional analytic signal method application to interpret
location and depth of the contrast magnetic boundaries by
the aviation magnetic anomaly map in Tuan Giao.
using the 3D analytics signal method and higher
Proceedings of the 4th geophysical scientific and technical
derivatives. Proceedings of the 4th geophysical scientific
conference of Vietnam. Publisher of Science and
and technical conference of Vietnam, 136-147.
Engineering 2005.
Vo Thanh Son, Le Huy Minh, Luu Viet Hung, 2005.
Nguyen Dang Tuc, 2000. Kinematic characteristics of the Red
Determining the horizontal position and depth of the
River - Chay River fault zone in Cenozoic, J. Sciences of
density discontinuities in the Red River Delta by using the
the Earth, Ha Noi, 22, 3, 174-180.
vertical derivative and Euler deconvolution for the gravity
Nguyen Dang Tuc, 2004. The operational characteristics
of the red river Fault Zone. />Nguyen Hiep, 2005. Geology and Vietnam oil and gas resource.
Vietnam Oil and Gas Company (Petrovietnam).
152
anomaly data. Journal of Geological, series A, Vol.287,
3-4, 39-52.
Zhang C., M. F. Mushayandebvu et al., 2000. Euler
deconvolution
of
gravity
tensor
gradient
Geophysics,65, 512-520, doi: 10.1190/1.1444745.
data.