Luận văn thạc sĩ quản trị kinh doanh quốc tế MBA (187)
Bạn đang xem bản rút gọn của tài liệu. Xem và tải ngay bản đầy đủ của tài liệu tại đây (1.18 MB, 115 trang )
CAPSTONE PROJECT REPORT
IMPROVING HUDS’S
DEVELOPMENT STRATEGY
OF HOUSING SERVICE SYSTEM IN
NEW RESIDENCE URBAN AREA IN
PERIOD OF 2010 – 2020
Ngo Doan
Nguyen Duc Le
Nguyen Thi Minh Phuong
Phung Van Yen
Tran Thanh Son
Class: GaMBA01.X02
HANOI, 2010
GRIGSS UNIVERSITY
GLOBAL ADVANCE MASTER OF BUSINESS ADMINISTRATION PROGRAM
CAPSTONE PROJECT REPORT
IMPROVING HUDS’S
DEVELOPMENT STRATEGY
OF HOUSING SERVICE SYSTEM IN
NEW RESIDENCE URBAN AREA IN
PERIOD OF 2010 – 2020
Group No: 9
Ngo Doan
Nguyen Duc Le
Nguyen Thi Minh Phuong
Phung Van Yen
Tran Thanh Son
HANOI, 2010
ACKNOWLEDGEMENTS
We are most appreciative of the kindness and assistance extended to us by the
teacher staff, our classmates and my friends who created opportunities for us to
do the capstone project report. We are especially grateful to our professor, Mrs.
Ngo Kim Thanh – Professor from National Economic University for her
guidance throughout the report.
We are indebted to the leaders for HUDS who allowed us to access HUDS
confidential data and willingly completed the interview during the report. It is
our pleasure to acknowledge our debt to our colleagues for their assistance of
data collection and analysis.
Finally, we are respectful to acknowledge the contribution of our family
members, especially our wives and our parents
who provided invaluable
assistance during the process of this program and this report and was a source of
our moral encouragement throughout.
TABLE OF CONTENT
ACKNOWLEDGEMENTS................................................................................
TABLE OF CONTENT....................................................................................
LIST OF ABBREVIATIONS............................................................................
LIST OF TABLES............................................................................................
LIST OF FIGURES............................................................................................
THE CONTEXT................................................................................................
THE OBJECTIVE............................................................................................
THE METHODOLOGY....................................................................................
THE STRUCTURE............................................................................................
CHAPTER 1: THEORY REVIEW....................................................................
1.1SWOT, PEST, IFE, EFE and QSPM............................................................
1.2Value chain and core competency................................................................
CHARPTER 2: HUDS REVIEW....................................................................
2.1Overview....................................................................................................
2.2Macro and micro analysis............................................................................
2.3HUDS’s key successful factors....................................................................
2.4HUDS – Stable competitiveness....................................................................
2.5HUDs’ strategy list........................................................................................
2.6Strategy selection via QSPM Matrix............................................................
CHAPTER 3: RECOMMENDATIONS AND SUGGESTIONS.......................
3.1Summary on SWOT and QSPM....................................................................
3.2Perfecting HUDS’ s development Strategy....................................................
3.3Recommendation........................................................................................
3.4Strategic timeline........................................................................................
Capstone Project Report_Group 9_GaMBA01.X02
3.5Strategy implementation assessment............................................................
CONCLUSION............................................................................................
REFERENCE................................................................................................
ANNEX 2....................................................................................................
ANNEX 3....................................................................................................
ANNEX 4....................................................................................................
Page 5 of 115
Capstone Project Report_Group 9_GaMBA01.X02
LIST OF ABBREVIATIONS
AS
ASEAN
BOM
BU
EBIT
EFE
GSO
HR
HRM
HUD
HUDS
IFE
ISO
PEST
PMU
QSPM
SWOT
TS
Attractiveness Score
Association of Southeast Asia Nations
Board Of Management
Business Unit
Earnings Before Interest & Tax
External Factor Evaluation matrix
Government Statistical Office
Human Resource
Human Resource Management
Housing and Urban Development Holdings
Housing and Urban Development Service Limited Company
Internal Factors Evaluation matrix
International Organization for Standardization
Political, Economic, Social, Technological
Project Management Unit
Quantitative Strategic Planning Matrix
Strengths, Weaknesses, Opportunities, and Threats
Total Attractiveness Score
Page 6 of 115
Capstone Project Report_Group 9_GaMBA01.X02
LIST OF TABLES
Table 1-1: SWOT Details....................................................................................
Table 1-2: SWOT Matrix....................................................................................
Table 1-3: PEST Details....................................................................................
Table 1-4: IFE: Matrix........................................................................................
Table 1-5: EFE Matrix........................................................................................
Table 1-6: Environmental Factors....................................................................
Table 1-7: SWOT Combination........................................................................
Table 1-8: The combined strategic formation....................................................
Table 2-9: HUDS Labor Structure....................................................................
Table 2-10: HUDS Financial Reports................................................................
Table 2-11: HUDS Business Reports from 2007 to 2009...................................
Table 2-12: GPD Indicators by exchange rate....................................................
Table 2-13: GPD Indicator by purchase power................................................
Table 2-14: Number of households serviced by HUDS...................................
Table 2-15: HUDS Competitor list....................................................................
Table 2-16: HUDS Value Chain........................................................................
Table 2-17: HUDS Service list............................................................................
Page 7 of 115
Capstone Project Report_Group 9_GaMBA01.X02
Table 2-18: HUDS’s SWOT Matrix....................................................................
Table 2-19: List of HUDS's strategies................................................................
Table 2-20: Internal Factor Evaluation Matrix (IFE).......................................
Table 2-21: HUDS External factor evaluation (EFE).......................................
Table 2-22: QSPM Matrix for SO....................................................................
Table 2-23: QSPM Matrix for ST....................................................................
Table 2-24: QSPM for WT................................................................................
Table 3-25: Strategic timeline............................................................................
Table 3-26: Strategy implementation assessment................................................
Page 8 of 115
Capstone Project Report_Group 9_GaMBA01.X02
LIST OF FIGURES
Figure 1-1: Michael Porter's Five Forces Mode................................................
Figure 1-2: SWOT Structure............................................................................
Figure 1-3: PEST................................................................................................
Figure 1-4: Value Chain....................................................................................
Figure 2-5: HUDS headquarter........................................................................
Figure 2-6: HUDS’s Org Chart........................................................................
Figure 2-7: HUDS Education Proportion............................................................
Figure 2-8: HUDS IE Matrix............................................................................
Page 9 of 115
Capstone Project Report_Group 9_GaMBA01.X02
THE CONTEXT
The 21st Century is the critical period of development of global
economic and urbanization. After the World War II, the entire world,
especially Asia entered a period of peaceful development in the second half
of the 20th century while Asian countries speeded up the process of
industrialization and urbanization. In Japan, Korea, China, East Asia and in
some Southeast Asia countries, economic growth along with high rate of
urbanization has been rapidly developed.
Vietnam is no exception to the general urbanization development in
Asia. After Vietnam entered a period of innovation, its economic has been
rapidly developed. The speedy urbanization has led the newly born
provincial cities in Vietnam, starting with Quy Nhon in 1986, Vung Tau in
1991. As of March, 2010, Vietnam has 48 provincial cities. Along with an
increase of provincial cities in quantity, some cities in other provinces
quickly developed into the largest economic center and was upgraded to
central cities like Da Nang (1997 ), and Can Tho (2004). As of July 2, 2010,
Vietnam has five central cities as Hanoi, Hai Phong, Ho Chi Minh City, Da
Nang, Can Tho cities and 51 provincial cities. In parallel with the
development of new types of city, housing problem in urban areas is also a
very hot issue due to houses in urban areas were largely built long time ago,
in the low storey architecture, no value-added services, inability to expand
and are in a serious deteriorated condition, threatening the safety of the
residents living in and neighborhood. To the housing situation, many new
urban areas were approved by Vietnam government and they were designed
with the new architectural, incorporating many features and services to
facilitate the residents living in it - it never had in the old house before. The
Page 10 of 115
Capstone Project Report_Group 9_GaMBA01.X02
development of value-added services in the urban area shows the better
quality of life in Vietnam which has been very positively improved after the
Doi Moi period, expressing the concept "delicious taste and beautiful
clothing”, not “just eat and cloth “.
With the concept of "delicious taste and beautiful clothing," Housing
and Urban Development Service Limited Company (HUDS) has focused on
developing value-added services to meet the other needs than housing needs
of inhabitants in the urban area managed by it. Therefore, "Perfecting
HUDS’s strategy on developing housing services in urban areas in period of
2010 - 2020" is selected as the main topics for capstone project report in the
scope of Master of Business Administration (GaMBA)
THE OBJECTIVE
Housing and Urban Development Service Limited Company (HUDS)
is the subsidy of Housing and Urban Development Holdings (HUD). HUDS
operates primarily in managing, maintaining technical infrastructure system
in new urban residential areas, concentrating on internal transport, drainage
and supply systems, public lighting; providing high building management
services sanitation services, and sports management service. HUDS’s
diversified business lines lead the urgent need to develop an overall business
strategy for its business in period of 2010-2020. The purpose of this report is
to help HUDS leaders to map out the focusing strategy for its future
development which probably forms the new trend of housing service in
urban areas.
THE METHODOLOGY
We have used to different methodologies to expedite the report:
collecting in site and on line in library. Beside that we also use the interview
Page 11 of 115
Capstone Project Report_Group 9_GaMBA01.X02
methods to HUDS leaders and compare the existing strategies with its
business lines to find out the connection to its success.
THE STRUCTURE
This report are the work of 5 authors, divided into 3 main chapters
Chapter 1: Theory Review. In this chapter, we mention the analyzing
tools such as SWOT, PEST and EFE, IFE Matrix to analyze the HUDS’s
strength, weakness as well as the Opportunity and Threat to HUDS and the
existing theories (if any) and methodology.
Chapter 2: HUDS’s overview. The chapter will focus on analyzing
HUDS’s strength and weakness as well as HUDS’s stable competitiveness
which includes value chain, list of investment.
Chapter 3: Recommendations and Suggestions. This is the important
chapter which reflects the authors’ point of view in building up the strategy
for HUDS which includes Product Diversification Strategy and Human
Resource Management Strategy, Marketing Strategy the timeline to proceed
the strategy to 2020.
Other contents will be presented in the appendix of the report.
Page 12 of 115
Capstone Project Report_Group 9_GaMBA01.X02
CHAPTER 1: THEORY REVIEW
1.1
SWOT, PEST, IFE, EFE and QSPM
There are a variety of perspectives, models and approaches used in
strategic planning. The development and implementation of these different
tools depend on a large number of factors, such as size of the organization,
nature and complexity of the organization's environment, and the
organization's leadership and culture.
The operating environment is understood as the overall factors,
external and internal factors interacting and affecting indirectly directly to
the activities of the organization. We may see a limited environmental space
where one organization survives and develops. These attributes to the
organizational environment always impacts in different directions, with
different levels and to all activities of each organization. The positive factors
influence a positive impact to the activities of the organization while the
negative factors adversely affect the operation of the organization
These factors may be external factors creating opportunities and threats
to organizations, may be internal factors which help the organization to
identify its strengths and weaknesses compared to its competitors.
To build strategic decisions or activities, the organization must pay
attention to research, analyze and forecast the environment
Macro environment analysis: the macro environment is the external
environment to the organization. Other macro-environmental factors affect
all institutions at different levels while the institutions cannot. The main
factors of macro environment consist of economic, political, legal, social,
natural, technical and technological factors
Page 13 of 115
Capstone Project Report_Group 9_GaMBA01.X02
Micro environment analysis: the micro environment is also the external
environment to the organization. The micro environmental factors directly
affect the organization, determines the degree and nature of competition.
The micro-environmental factors include five categories: customers,
competitors,
potential
competitors,
suppliers
and substitute products.
Five
strategic
planning tools popularly
known
are
presented
below: the GE Market
Growth/Market
Share
Matrix; SWOT Analysis;
Porter's
Generic
Competitive Strategies;
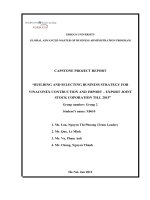
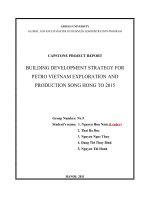
Figure 1-1: Michael Porter's Five Forces Mode
Source: M. Porter (2008), The Five competitive forces that
shape strategy
and Porter's Five Forces
Mode
However, in the scope of this report, we will only present the below
strategy analyzing tools such as PEST, SWOT and IFE, EFE, QSPM.
1.1.1
SWOT
A SWOT analysis is a tool, used in management and strategy
formulation. It can help to identify the strengths, weaknesses, opportunities
and threats of a particular company.
Strengths and weaknesses are internal factors that create value or
destroy value. They can include assets, skills or resources that a company
Page 14 of 115
Capstone Project Report_Group 9_GaMBA01.X02
has at its disposal, compared to its competitors. They can be measured using
internal assessment or external bench-marking.
Opportunities and threats are external factors that create value or
destroy value. A company cannot
control them. But they emerge
from
either
the
competitive
dynamic of the industry/market or
from
demographic,
economic,
political, technical, social, legal or
cultural factors (PEST)
The typical factors in a
SWOT analysis diagrams consist
Figure 1-2: SWOT Structure
of:
(Source: />
Table 1-1 : SWOT Details
Strength
Specialist marketing expertise
Exclusive access to natural resources Patents
New innovative products or service
Location of business
Cost advantage through proprietary
know-how
Quality processes and procedures
Strong brand or reputation
Opportunities
Developing market
Mergers, joint ventures or strategic
alliances
Moving into attractive market
segments
A new international market
Loosening of regulations
Resource of international trade
barriers
A marketing that is led by a weak
competitor
Page 15 of 115
Capstone Project Report_Group 9_GaMBA01.X02
Weakness
-
Lack of marketing expertise
-
Undifferentiated products and services -
Threat
A new competitor in your own home
market
Price war
Competitor has a new, innovative
substitute product or service
New regulation
Increased trade barriers
A potential new taxation on products
or services
Location of company
Competitors have superior access todistribution channels
Poor quality of goods and services
Damaged reputation
(Source: />Any organization must try to create a fit with its external environment.
The SWOT diagram is a very doo tool for analyzing the (external) strengths
and weaknesses of a corporation and the (external) opportunities and threats.
However, this analysis is just the first step. To really create the fit with the
external environment is often the most difficult work.
A tool to combine the internal factors with the external factors is the
confrontation matrix
Table 1-2 : SWOT Matrix
OPPORTUNITY
STRENGTH
Offensive
Make the most of
these
Page 16 of 115
THREAT
Adjust
Restore strengths
Capstone Project Report_Group 9_GaMBA01.X02
WEAKNESS
Defensive
Watch competitors
Survive
Turn around
closely
(Source: Summary by Group 9)
Often in reality, the two columns of the SWOT diagram are pointing in
opposite directions. Strategists must deal with paradox of creating
alignment. This can be done via Outside-in strategy formulation (marketdriven strategy) or inside-out strategy formulation (resource-driven strategy)
1.1.2
PEST
The PEST analysis is a framework used to scan the external macro-
environment in which a firm operates. PEST is an acronym for the following
factors:
•
Political
•
Economic
•
Social
•
Technological
However, according to the new point of view, PEST doesn’t not only
stand for 4 above
factors, there are two more factors which are
demographic and global in Figure1.3
Page 17 of 115
Capstone Project Report_Group 9_GaMBA01.X02
Figure 1-3 : PEST
(Source: Slides by ETC)
PEST factors play an important role in the value creation opportunities
of a strategy. However they are usually out of control of corporation and
must normally be considered as threats or opportunities. The macroeconomic factors can differ per continent, country or even region, so
normally a PEST analysis should be performed per country.
Page 18 of 115
Capstone Project Report_Group 9_GaMBA01.X02
Political
Table 1-3 : PEST Details
Economic
Social
Technological
(included legal)
Environmental
regulations
and
protection
Economic
growth
Income
distribution
Governmental
research spending
Tax policies
Interest rate
and
monetary
policies
Demographics,
population growth
rates,
Age distribution
Industry focus on
technological effort
International trade
regulations
and
restrictions
Governmen
t spending
Labor/social
mobility
New inventions and
development
Contract
enforcement law
Customer
protection
Unemploy
ment policy
Lifestyle changes
Rate of technology
transfer
Employment laws
Taxation
Work/career and
leisure attitudes
Entrepreneurial
spirit
Life cycle and
speed
of
technological
obsolescence
Government
organization/attitu
de
Exchange
rate
Education
Energy use and cost
Competition
regulation
Inflation
rates
Fashion, hypes
Changes
Information
Technology
Political stability
Stage of the
business
cycle
Health conscious
and
welfare
feelings on safety
Changes in Internet
Safety regulations
Consumer
confidence
Living conditions
Changes in Mobile
technology
Page 19 of 115
in
Capstone Project Report_Group 9_GaMBA01.X02
(Source: )
1.1.3
Internal factor Evaluation matrix (IFE)
The internal environment of the organization includes all the elements
and its systems. Analyzing these factors will help the organizations to
identify its strengths and weaknesses, based on that it can promote or
remedy.
Internal factors evaluation matrix (IFE) is a tool used to summarize and
evaluate the strengths and weaknesses and the importance of business
function, and it is also the basis to identify and assess the relationship
between these functions.
According to Fred R. David, IFE Matrix can be developed in five
steps:
−
Step one: List up the factors determined in the internal analysis
process, for from 10 to 20 elements, including the strengths and
weaknesses.
−
Step two: Identify the importance by sorting from 0.0 (not important)
to 1.0 (most important) for each element. Its importance identified
relatively affects to the overall success of the company. . Total of all
levels of this importance is 1.0.
−
Step three: Classify from 1 to 4 for each elements, representing the
biggest weakness (classified as 1), the smallest weakness (classified
as 2), the smallest strength (classified as 3) , or the greatest strengths
(classified as 4). Thus, this classification will identify some
important points for each variable
Page 20 of 115
Capstone Project Report_Group 9_GaMBA01.X02
−
Step 4 x Step 2 = Step 3.
−
Step five: Sum up the total points for each variable to identify the
overall sum of the organization.
Regardless to how many element an IFE matrix contains, the points
can be ranged from the lowest level of 1.0 to the highest level of 4.0 and the
average is 2.5 .
Table 1-4 : IFE: Matrix
Internal
element
……….
……….
Importance
…..
…..
Coefficients
…..
…..
Score
…..
…..
Total
(Source: )
The total score of importance less than 2.5 shows that the company
focuses on internal and if it is higher than 2., it shows a strong internal
corporate.
The internal factors to be analyzed is human resource, production,
research and development, financial and accounting, marketing.
1.1.4
External Factor Evaluation Matrix (EFE)
External factor evaluation (EFE) matrix summaries and assesses the
socio-economic, cultural, demographical, geographical, governmental, legal,
technological and competitive information.
According to Fred R. David, EFE matrix development process consist
of 5 steps:
Page 21 of 115
Capstone Project Report_Group 9_GaMBA01.X02
−
Step 1: List up the key decisive factors to the success while recognizing the
external factors. Using from 10 to 20 elements consisting opportunities,
threats to the organization and its business.
−
Step 2: Categorizing the importance from least to most importance, using
0.0 to 1.0 for each elements. The categorization shows the importance of
each elements to its success in business. The proper categorization will be
identified by comparing to the successful to the unsuccessful competitors
or by discussing to the conclusion.
−
Step 3: The total for this categorization must be 1.0. 4 is the good, 3 is rather
good, 2 is average, 1 is bad. The ranging must base on its’ strategic
effectiveness.
−
Step 4: Multiply this importance with its coefficient to identify the total
score for important. (Step 4 = Step 2 x step 3)
−
Step 5: Sum up the scores of each elements to identify the total score of
important to the organization.
Regardless to opportunities and threats, they must be contained in EFE
matrix, the most important is 4.0 and the least important is 1.0
Table 1-5 : EFE Matrix
External elements
……………………….
………………………..
Importance
…………….
…………….
Coefficients
……….
……….
Score
………..
……….
Total score:
(Source: )
The average score of importance is 2.5 If total score of importance is
4, it is said that the organization is well reacting to opportunities and threats
in its industry. If the total score is 1, it is said that the current strategy hasn’t
made use of opportunities or hasn’t avoided the threats.
To summary, Table 1.6 is made to contain all environmental factors:
Table 1-6 : Environmental Factors
Elements
Importance
Coefficient (3)
Page 22 of 115
Total
Capstone Project Report_Group 9_GaMBA01.X02
(1)
(2)
List up the
= 0:
elements to
Unimportant
be assessed
= 1: Very
External
= 4: Good reaction
important
(Total score of
importance is
Internal
= 4: Strong
score (4)
Result =
reaction
(2) x (3)
= 3: Above
= 3: Rather
average reaction
strong reaction
= 2: Average
= 2: Rather
reaction
weak reaction
= 1: Weak reaction
1)
= 1: Very weak
reaction
(Source: )
1.1.5
Identify the organization’s objective
The purpose of objective is to identify the objective or specific
results which is achievable.
The objective should be categorized by long term and short terms
ones.
1.1.6
Strategy forming
Based on the environment analysis, it is time to combine the
strengths and weakness with opportunities and threats from external
environment to form the selectable strategies.
The analysis tools to combine the factors are various such as SWOT
matrix, SPACE matrix, BCG or GE matrix. However, in the scope of this
report, we will present the analysis tool of SWOT.
Table 1-7 : SWOT Combination
External factors
Internal factors
I. Opportunities (0)
II. Threats (T)
1. List up the items in
term of importance level
1. List up the items in
term of importance
2….
2….
Page 23 of 115
Capstone Project Report_Group 9_GaMBA01.X02
I. Strength (S)
1. List up from the most
important strength to
the least important
strength
3….
3….
Strategy (SO)
Strategy (ST)
(Using strengths to
(Using strengths to
make use of
avoid the threat)
opportunities)
2….
3….
II. Weakness (W)
1. List up the most
important weakness to
the least important
weaknesses
Strategy (WO)
Strategy (WT)
(Control weaknesses to
(Minimize the weakness
explore the
to avoid the threat)
opportunities)
2….
3….
(Source: )
In principle, it can set four combinations to create the logical pairs:
−
the first fair of strengths with opportunities (SO) will form the
strategic thoughts bringing huge benefit to the organization,
−
the fair of opportunities and weakness (WO) will offer the strategic
thoughts to re-enforce and control the weakness.
−
The fair of strengths and threats (ST) will control the weakness to
explore the opportunities
−
The fair of weaknesses and threats (WT) will suggest the idea of
defensive strategies to minimize weaknesses and avoid risk
Page 24 of 115
Capstone Project Report_Group 9_GaMBA01.X02
Therefore, the SWOT matrix can be used to form strategic thoughts
to take full advantage of opportunities and promote the strengths and avoid
the risks and minimize the weaknesses. On that basis, the formation of
combined strategic plan in the advantage principle is to fully exploit
opportunities and avoid risks and promote the strengths and cover
weaknesses appearing in the strategy identifying period
Table 1-8 : The combined strategic formation
The combined strategy
The combination
The effectiveness
(1)
(2)
(3)
…………
…………
…………
…………
…………
…………
1) Strategy 1
…………
n) Strategy n
(Source: )
1.1.7
Strategy selection
After combining the strategic plan, we have a series of proposed
strategies. The next step is to evaluate these strategies and to determine the
attractiveness of each strategy. The strategy has the highest score of
attractiveness will be more attractive and more likely to be selected.
To do this, the most popular is the QSPM matrix (Quantitative
Strategic plan management)
The following steps to make a QSPM matrix :
−
Step 1: List up the external opportunities and threats, internal strength and
weakness (extracted from EFE and IFE matrix)
−
Step 2: Category the importance of each elements like EFE and IFE matrix.
Page 25 of 115