Vascular endothelial growth factor is a critical stimulus for diabetic macular edema
Bạn đang xem bản rút gọn của tài liệu. Xem và tải ngay bản đầy đủ của tài liệu tại đây (1.35 MB, 13 trang )
Vascular Endothelial Growth Factor Is a
Critical Stimulus for Diabetic Macular Edema
QUAN DONG NGUYEN, MD, MSC, SINAN TATLIPINAR, MD, SYED MAHMOOD SHAH,
MBBS, JULIA A. HALLER, MD, EDWARD QUINLAN, MD, JENNIFER SUNG, MD,
INGRID ZIMMER-GALLER, MD, DIANA V. DO, MD,
AND PETER A. CAMPOCHIARO, MD
● PURPOSE: The role of vascular endothelial growth
factor (VEGF) in diabetic macular edema (DME) was
tested with ranibizumab, a specific antagonist of VEGF.
● DESIGN: A nonrandomized clinical trial.
● METHODS: Ten patients with chronic DME received
intraocular injections of 0.5 mg of ranibizumab at baseline and at one, two, four, and six months. The primary
outcome was change in foveal thickness between baseline
and seven months, and the secondary outcome measures
were changes from baseline in visual acuity and macular
volume.
● RESULTS: Mean values at baseline were 503 m for
foveal thickness, 9.22 mm3 for macular volume, and
28.1 letters (20/80) read on an Early Treatment Diabetic
Retinopathy Study (ETDRS) visual acuity chart. At
seven months (one month after the fifth injection), the
mean foveal thickness was 257 m, which was a reduction of 246 m (85% of the excess foveal thickness
present at baseline; P ؍.005 by Wilcoxon signed-rank
test for likelihood that this change is due to ranibizumab
rather than chance). The macular volume was 7.47 mm3,
which was a reduction of 1.75 mm3 (77% of the excess
macular volume at baseline; P ؍.009). Mean visual
acuity was 40.4 letters (20/40), which was an improvement of 12.3 letters (P ؍.005). The injections were
well-tolerated with no ocular or systemic adverse events.
● CONCLUSION: Intraocular injections of ranibizumab
significantly reduced foveal thickness and improved visual acuity in 10 patients with DME, which demonstrated that VEGF is an important therapeutic target for
Supplemental Material available at AJO.com.
Accepted for publication Jun 29, 2006.
From the The Wilmer Eye Institute, The Johns Hopkins University
School of Medicine, Baltimore, Maryland.
Supported by the Innovative Grant Award from the Juvenile Diabetes
Research Foundation; by a scholarship from the Scientific and Technological Research Council of Turkey (S.T.); and by a K23 Career
Development Award (EY 13552) from the National Eye Institute
(Q.D.N.). The study drug was provided by Genentech, Inc.
Inquiries to Peter A. Campochiaro, MD, Maumenee 719, The Wilmer
Eye Institute, The Johns Hopkins University School of Medicine, 600
North Wolfe St, Baltimore, MD 21287–9277; e-mail:
0002-9394/06/$32.00
doi:10.1016/j.ajo.2006.06.068
©
2006 BY
DME. A randomized, controlled, double-masked trial is
needed to test whether intraocular injections of ranibizumab provide long-term benefit to patients with DME.
(Am J Ophthalmol 2006;142:961–969. © 2006 by
Elsevier Inc. All rights reserved.)
D
IABETIC RETINOPATHY IS THE MOST PREVALENT
cause of vision loss in working aged individuals in
developed countries.1 Severe vision loss occurs
because of traction retinal detachments that complicate
retinal neovascularization, but the most common cause of
moderate vision loss is macular edema. Macular edema
occurs from the leakage of plasma into the central retina,
which causes it to thicken because of excess interstitial
fluid. The excess interstitial fluid is likely to disrupt ion
fluxes and the thickening of the macula results in stretching and distortion of neurons. There is reversible reduction in
visual acuity, but over time the perturbed neurons die, which
results in permanent visual loss.
The leakage of plasma in patients with diabetic macular
edema (DME) is visualized by fluorescein angiography and
may be focal because of leakage from microaneurysms or
diffuse. Microaneurysms are thought to occur because of
hyperglycemia-induced pericyte death, which weakens the
walls of retinal vessels and results in the small aneurysms in
which endothelial cells are perturbed causing them to lose
their barrier qualities and leak.2 However, diffuse leakage
from retinal capillaries that do not show visible structural
changes (such as microaneurysms) is also a common feature
of DME. This could be due to microscopic damage to
retinal vessels that are not visible in images that are
obtained during fluorescein angiography but could also be
due the presence of excessive amounts of pro-permeability
factors.
Recently, retinal hypoxia has been implicated in the
pathogenesis of DME.3 Hypoxia causes increased expression of vascular endothelial growth factor (VEGF), which
is a potent inducer of vascular permeability that has been
shown to cause leakage from retinal vessels.4,5 Thus, it is
reasonable to hypothesize that VEGF contributes to DME.
ELSEVIER INC. ALL
RIGHTS RESERVED.
961
Ranibizumab is a Fab fragment of an antibody that specifically binds all isoforms of VEGF-A with high affinity.
Intraocular injections of ranibizumab provide benefit for
patients with choroidal neovascularization because of agerelated macular degeneration, which confirms studies in
animal models that suggest that VEGF is an important
stimulus for choroidal neovascularization (reported at the
meeting of the American Society of Retina Specialists,
Montreal, Canada, July 2005). In this study, we tested the
hypothesis that VEGF is also an important stimulus for
DME by assessing the effect of multiple intraocular injections of ranibizumab in patients with DME.
received an intraocular injection of 0.5 mg of ranibizumab.
Patients returned one week later for a repeat examination
and OCT. Subsequent return visits occurred every month
through seven months, which was the primary end point of
the study. Additional injections of ranibizumab were performed at one, two, four, and six months. This protocol
was selected to determine the effect of monthly injections
for the first three months and then to try to determine
whether less frequent injections would be feasible. Safety
evaluations, measurement of best-corrected visual acuity,
eye examinations, and OCTs were done at all study visits;
fluorescein angiograms were done at three and six months.
Measurements of HbA1C were done at baseline and three
and six months. Hematologic and blood chemistry tests
were done at baseline and six months.
METHODS
Povidone iodine
was used to clean the lids, and a lid speculum was inserted.
Topical anesthesia was applied; in some patients, a subconjunctival injection of 2% lidocaine was given. The
conjunctiva was irrigated with 5% povidone iodine. A
30-gauge needle was inserted through the pars plana, and
0.05 ml containing 0.5 mg of ranibizumab was injected
into the vitreous cavity. Funduscopic examination was
performed to confirm retinal perfusion, and patients were
observed for one hour or until intraocular pressure returned
to normal. Patients were called the day after each injection
and asked whether they had decreased vision, eye pain,
unusual redness, or any new symptoms.
● ADMINISTRATION OF STUDY DRUG:
AN OPEN-LABEL STUDY TO INVESTIGATE THE EFFECT OF
intraocular injections of 0.5 mg of ranibizumab in 10
patients with DME was approved by the Federal Drug
Administration and the institutional review board of the
Johns Hopkins Medical Institutions. The study was designed to give patients an intraocular injection of 0.5 mg of
ranibizumab at study entry and at one, two, four, and six
months after entry. The dose was selected because 0.5 mg
is the highest dose available and because it is reasonable to
start with the highest dose and investigate other doses in
future studies, if indicated. The regimen was selected to
assess the effect of three monthly injections and then to
determine the impact of increasing the time between injections to two months for the last two injections. The primary
outcome measure was foveal thickness that was measured by
optical coherence tomography (OCT)6,7 at seven months,
compared with baseline. Secondary outcome measures were
macular volume that was measured by OCT and visual acuity
that was measured by the protocol of the Early Treatment
Diabetic Retinopathy Study (ETDRS)8 at seven months,
compared with baseline.
OCT scans were performed by an experienced
investigator with a StratusOCT3 (Carl Zeiss Meditec,
Dublin, California, USA) that used the fast macular scan
protocol. This protocol consists of 6 line scans that are
6.0-mm long, centered on fixation, and spaced 30 degrees
apart around the circumference of a circle. Each line
consists of 128 A-scan measurements. With each A-scan,
the OCT software measures the distance between the
inner surface of the retina and the anterior border of the
retinal pigment epithelium choriocapillaris complex on
the basis of changes in reflectivity. The center point
thickness, also known as the foveolar thickness, is a mean
value that is generated by the StratusOCT software from
the 6 central A-scan thickness values of each of the radial
lines comprising the fast macular thickness map. We did
not use this value generated from only 6 data points for our
primary measure of central retinal thickness but instead
used the foveal or central 1 mm thickness, which is an
average generated value based on central 21 scans of each
of the 6 lines that pass through the patient’s fixation. The
number of data points that are used to compute this value
is 21 ϫ 6 ϭ 126, which provides a better representation of
the thickness of the central retina than a value that is
generated from only 6 points around fixation. Macular
volume throughout the entire 6-mm zone is calculated
with extrapolated values between the line scans. Excess
● OCT:
● PATIENT ELIGIBILITY AND EXCLUSION CRITERIA:
Patients (18 or older) were eligible if they had reduction in
visual acuity between 20/40 and 20/320 and met the
following criteria: (1) baseline foveal thickness by OCT
was 250 m or greater, (2) serum HbA1c Ն6% for 12
months before randomization, (3) no potential contributing causes to reduced visual acuity other than DME, and
(4) reasonable expectation that laser photocoagulation
would not be required for the next six months. If both eyes
were eligible, the eye with the greater foveal thickness was
entered.
● STUDY PROTOCOL: Consenting patients were screened
for the study with a medical history, physical examination,
measurement of best-corrected visual acuity by an experienced examiner who used the ETDRS protocol,8 a complete eye examination, an OCT, a fluorescein angiogram,
and laboratory tests on blood and urine. Eligible patients
962
AMERICAN JOURNAL
OF
OPHTHALMOLOGY
DECEMBER 2006
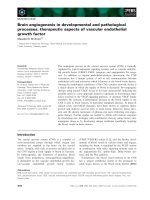
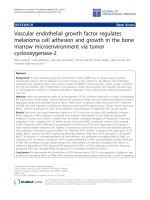
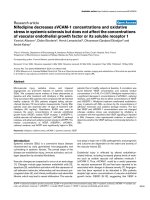
FIGURE 1. Horizontal cross sectional optical coherence tomography (OCT) scans at all time points for patients 3 and 9 with
diabetic macular edema that was treated with ranibizumab to illustrate two patterns of response over time. Seven days after the first
intraocular injection of 0.5 mg of ranibizumab (day seven), patient 3 showed a marked improvement in the appearance of the OCT
scan with the elimination of several large cysts and the return of a normal macular contour that included a foveal depression. At
month one (M1), one month after the first injection, and M2 and M3, one month after the second and third injections, respectively,
the scans for patient 3 were worse than the scan at day seven, which suggests a loss of effect of ranibizumab or transient effects that
are lost by one month after injection. At M4, two months after the third injection, the scan showed substantial deterioration, but
seven days after the fourth injection (M4 ؉ seven days) there was marked improvement supporting transient effect. However, there
was less deterioration one month after the fourth injection (M5) than there had been one month after each of the first three
injections. This was followed by deterioration at M6, two months after the fourth injection, but then at M7, the primary end point
and one month after the fifth injection, there was improvement to the point that the scan looked more like the two previous scans
that had been performed seven days after an injection than like those scans that had been performed one month after an injection.
Like patient 3, patient 9 also showed substantial improvement at day seven compared with baseline, with resolution of several large
cysts. However, unlike patient 3, patient 9 showed continued improvement and then stability at subsequent time points, regardless
of the time after the injection that the scan was performed. This suggests that the beneficial effects of ranibizumab were more
sustained in patient 9 than in patient 3. BL ؍baseline.
VOL. 142, NO. 6
RANIBIZUMAB
FOR
DIABETIC MACULAR EDEMA
963
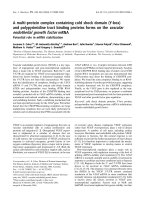
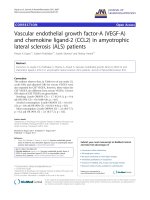
FIGURE 2. Excess foveal thickness was measured by optical coherence tomography (OCT) at each study visit in all patients with diabetic
macular edema that was treated with ranibizumab. Each bar represents the foveal thickness above the normal mean value of 212 m, which is
set to zero. The arrows show intraocular injections of 0.5 mg of ranibizumab. The bars for baseline and month seven are shaded to allow quick
comparison between baseline and the primary end point. The foveal thickness is less at the primary end point than at baseline for all patients.
964
AMERICAN JOURNAL
OF
OPHTHALMOLOGY
DECEMBER 2006
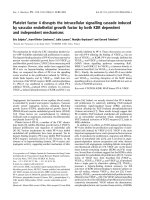
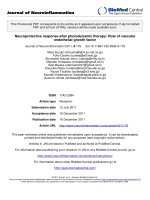
FIGURE 3. The mean excess foveal thickness at each study visit in all patients with diabetic macular edema that was treated with
ranibizumab. Each bar represents the mean value for excess foveal thickness for all patients at the designated study visit (data for
eight of 10 patients at month nine). The arrows show when intraocular injections of 0.5 mg of ranibizumab were administered.
Compared with baseline, foveal thickness was reduced by 246 m at the primary end point of the study, which constituted the
elimination of 85% of the excess foveal thickness that had been present at baseline.
foveal thickness was calculated by subtraction of the
measured foveal thickness value from the normal mean
value of 212 m that was calculated from measurements
on a large population of subjects.9 Excess macular volume
was determined by subtraction of the upper limit of the
normal range of 6.94 Ϯ 0.37 mm3 from the measured
value.
Statistical analyses were performed with Statistical Package for the Social Sciences
software (SPSS Inc, Chicago, Illinois, USA). The likelihood that the change in foveal thickness, macular volume,
and visual acuity from baseline to month seven was due to
ranibizumab rather than to chance was determined by the
Wilcoxon signed-rank test.
● STATISTICAL ANALYSIS:
RESULTS
There
were five men and five women in the study, with a median
age of 60 years. Eight of the 10 patients were insulindependent diabetics. The median and mean HbA1C values
at enrollment were 7.50% and 7.64%, respectively, and
were 7.90% and 7.91%, respectively, at month 6 (P ϭ
● CHARACTERISTICS OF THE STUDY POPULATION:
VOL. 142, NO. 6
RANIBIZUMAB
FOR
.240). Four patients had diabetic neuropathy, and three
patients had diabetic nephropathy with modest renal
insufficiency that did not require dialysis. Eight patients
were receiving treatment for hypertension, which was
well-controlled; seven patients had hypercholesterolemia,
five of whom were receiving treatment. There was no
significant change in mean systolic or diastolic blood
pressure during the study. The mean duration of DME was
4.75 Ϯ 1.22 years with a median duration of 3.5 years and
a range of six months to 10 years. Nine of the 10 patients
with DME had received previous treatment in the study
eye; eight of the patients had received at least two sessions
of focal/grid laser photocoagulation not less than 5 months
before study entry (range, five to 120 months), and three
patients had received intraocular corticosteroids not less
than 10 months before entry (range, 10 to 20 months).
Despite these treatments, the mean foveal thickness at
baseline was 503 Ϯ 115 m (range, 326 to 729 m).
Therefore, this patient population had severe, chronic
DME that was poorly responsive to standard therapies.
● EFFECT OF RANIBIZUMAB ON FOVEAL THICKNESS:
Several patients had a large reduction in foveal thickness
by seven days after the first intraocular injection of 0.5 mg
of ranibizumab (median, 88 m; mean, 130 m). OCT scans
DIABETIC MACULAR EDEMA
965
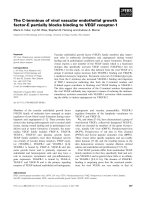
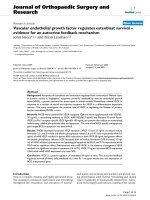
FIGURE 4. Mean and median change in visual acuity from baseline at each study visit in all patients with diabetic macular edema
that was treated with ranibizumab. The black line shows the mean change in visual acuity measured in the number of letters that
were read on an Early Treatment Diabetic Retinopathy Study (ETDRS) visual acuity chart, and the white line shows the median
change in visual acuity. The arrows show times of intraocular injection of 0.5 mg of ranibizumab. At the primary end point, month
seven, there was an improvement of 12.3 letters in mean visual acuity and 11 letters in median visual acuity.
from two patients whose condition showed such an immediate, dramatic response are shown in Figure 1. Patient 3 had
several large cysts within the retina at baseline that
resolved within a week of the first injection with return of
a normal contour that included a foveal depression. Much
of the improvement was lost at one month, just before the
second injection. Substantial thickening and cystic changes
were also seen at months two and three, which was one
month after the second and third injections, respectively.
To determine whether this patient had become refractory
to ranibizumab, an OCT scan was done seven days after
the month four injection. There was a marked improvement, with resolution of cysts and a normal foveal contour
that indicated that the patient was continuing to respond
well to ranibizumab, but the drug effect quickly dissipated
and was not apparent by one month after each injection.
The subsequent course showed that, when injections were
given two months apart, there might be a longer duration
of effect from a single injection. Like patient 3, patient 9
also showed substantial improvement at day seven, compared with baseline, with resolution of several large cysts.
However, unlike patient 3, patient 9 showed continued
improvement and then stability at subsequent time
966
AMERICAN JOURNAL
points, regardless of the time after the injection that the
scan was done. This suggests that the beneficial effects
of ranibizumab were more sustained in patient 9 than in
patient 3.
Excess foveal thickness is shown for each visit for all 10
patients in Figure 2. Patient 9, whose scans are shown in
Figure 1, experienced the disappearance of excess foveal
thickness after the first injection, with a persistent effect at
each subsequent time point that included the primary end
point at seven months. Patient 4 had a similar pattern.
Patient 3 (Figure 1) experienced a dramatic reduction in
foveal thickness at day seven, but fluctuation occurred
because of the dissipation of drug effect over the course of
one month and further worsening when injections were
delayed for two months. This same profile is shown to some
extent for patients 1, 2, 5, 7, and 10. Patients 6 and 8 had
a different pattern of more gradual, steady improvement,
regardless of the alteration of the injection interval.
Regardless of the different patterns that were exhibited,
all patients appeared to have a beneficial response to
ranibizumab. The magnitude of the beneficial response is
substantial, which is shown by the change from baseline in
median and mean excess foveal thickness for the entire
OF
OPHTHALMOLOGY
DECEMBER 2006
FIGURE 5. Scatter plot of reduction in foveal thickness vs gain in visual acuity at each study visit for all patients with diabetic
macular edema treated with ranibizumab. The reduction in foveal thickness in micrometers on the y-axis is plotted against the
improvement in visual acuity, which was measured by the numbers of letters that were read on an Early Treatment Diabetic
Retinopathy Study (ETDRS) visual acuity chart. There is a strong correlation with an R2 value of 0.78.
group of 10 patients (Figure 3). There was a substantial
drop seven days after the first injection, with further
improvement to a plateau between months one and three.
After an injection was skipped at month three, the foveal
thickening was slightly worse at month four but, after the
month four injection, improved beyond the previous
plateau level. After an injection was skipped at month five,
thickening was worse at month six, but after the month six
injection, thickening improved to the best level of the
study at the primary end point (month seven) when there
were median and mean reductions in foveal thickness
from baseline of 261 and 246 m, respectively, which
represented a resolution of 85% of the edema. At month
nine (three months after the last injection), there was
some increase in excess foveal thickness, compared with
the seven-month time point, but not back to the
baseline level.
● EFFECT OF RANIBIZUMAB ON MACULAR VOLUME:
Mean macular volume was 9.22 mm3 at baseline and was
reduced to 7.47 mm3 at seven months, which was a
reduction of 1.75 mm3 (Supplementary Figures 1S and 2S).
This is a significant reduction (P ϭ .009), which constitutes 77% of the excess macular volume that was present at
VOL. 142, NO. 6
RANIBIZUMAB
FOR
baseline. This large effect indicates that the reduction in
thickening that occurred in the center of the macula was
accompanied by global reduction in edema throughout the
entire macula.
Because of the chronicity of the DME and lack of response to
other treatments, we did not expect a large improvement
in visual acuity. However, mean and median visual acuities
were better than the acuities at baseline at all time points
and improved by 12.3 and 11 letters, respectively, at the
seven-month time point (Figure 4). This is an improvement of a little more than two lines. A scatter plot of
reduction in foveal thickness vs improvement in visual
acuity at each visit is shown in Figure 5. There is a strong
correlation with an R2 value of 0.78. This indicates that,
even for these patients with chronic macular edema, for
the group as a whole improvement in foveal thickening
correlates well with improvement in visual acuity at each
study visit. However, the rate of change of these two
outcome measures is different. A comparison of Figures 3
and 4 shows that change in visual acuity occurs more
slowly than change in foveal thickness. There was rapid
improvement in foveal thickness after the first injection of
● EFFECT OF RANIBIZUMAB ON VISUAL ACUITY:
DIABETIC MACULAR EDEMA
967
ranibizumab, with more gradual improvement in visual
acuity. The marked fluctuations in foveal thickness that
depended on time after the last injection of the OCT scan
was not accompanied by fluctuations in visual acuities,
which tended to show gradual improvement (this was the
first clue that patient 3 had not become refractory to
ranibizumab because, despite the prominent foveal thickening seen on sequential scans that were done one month
after injections, visual acuity showed progressive improvement). In view of this, it is not surprising that there was
good maintenance of the improvement in visual acuity
between seven and nine months, despite substantial worsening of foveal thickness, which indicates that return of
thickening precedes loss of visual acuity.
of the study. This was an 85% reduction of the excess
foveal thickening that was present at baseline. There was
a strong correlation between the change in foveal thickness over time and the change in macular volume over
time, which provided added confidence that the results are
reliable and meaningful. Visual acuity measurements are most
reliable when both patients and examiners are masked to
whether a treatment was actually administered, but the
anatomic evidence of improvement and the strong correlation between reduction in foveal thickening and improvement in vision support the reliability of the measured
gains in median and mean visual acuity of 11 and 12.3
letters, respectively.
Previous studies have also suggested that VEGF may
play a role in DME. An orally administered kinase inhibitor that blocks VEGF receptor signaling caused a dosedependent reduction in foveal thickness in patients with
DME, but because of other activities of this drug, the
improvement in DME could not be attributed solely to
inhibition of VEGF receptors.10 Recently, intraocular injections of pegaptanib, an aptamer that selectively binds
VEGF165, combined with focal laser photocoagulation
when considered needed, was found to cause a possible
small beneficial effect in patients with DME.11 Patients
who were randomly assigned to receive intraocular injections of 0.3 mg of pegaptanib had a median visual acuity of
20/50 at the primary end point, compared with 20/63 at
baseline, which was an improvement of approximately one
line. This was no different from the sham injection group,
which showed improvement of approximately one line
from 20/80 at baseline to 20/63. Change in foveal thickness from baseline was Ϫ68.0, Ϫ22.7, and Ϫ5.3 m in the
0.3-, 1-, and 3-mg pegaptanib treatment groups compared
with ϩ3.7 m in the sham injection group. These results
are confounded by the concomitant use of focal laser
photocoagulation in this study; fewer patients in the
0.3-mg treatment group (11/44 patients) compared with
the sham injection group (20/42 patients) were treated
with focal laser photocoagulation. The small benefit in the
0.3-mg treatment group cannot be attributed solely to the
inhibition of VEGF165, but rather to the combination of
VEGF165 blockade and focal laser compared with focal
laser alone in the sham injection group. Also, the relatively small effect of this combination therapy on foveal
thickness in patients with DME suggests that VEGF165
plays a relatively small role in DME and/or that pegaptanib
is an inefficient inhibitor. Although the current study
included only 10 patients, it is not confounded by any
concomitant treatments and demonstrates that a specific
VEGF antagonist that is given over seven months causes
reductions in median and mean retinal thickening of 261
and 246 m, respectively which results in the resolution of
most excess thickening (85%). This supports the conclusion that VEGF-A (probably multiple isoforms) plays a
major role in DME.
Intraocular injections of ranibizumab were tolerated well with no inflammation or other problems. The
mean systolic blood pressures at baseline, months one, two,
four, and six were 131.6, 139.0, 142.0, 138.4, and 135.0
mm Hg, respectively. The mean diastolic blood pressures at
baseline, months one, two, four, and six were 72.3, 75.1,
78.2, 78.2, and 76.8 mm Hg, respectively. One patient
received intraocular corticosteroids in the nonstudy eye for
DME, and severe intractable glaucoma developed that
required filtration surgery. There were no systemic adverse
events, no thromboembolic events, cerebral vascular accidents, or myocardial infarctions. Capillary nonperfusion
was measured by image analysis on baseline and month six
fluorescein angiograms, with the investigator masked with
respect to time point. The mean area of nonperfusion was
0.19812 disk areas at baseline and 0.19525 disk areas at six
months. Thus, there was no significant change in capillary
nonperfusion throughout the study.
● SAFETY:
DISCUSSION
THE DEVELOPMENT OF OCT HAS PROVIDED AN EXTREMELY
useful tool for the study and management of DME. It
allows noninvasive cross-sectional imaging of the retina
that provides reproducible measurements of retinal thickness with a resolution of 10 m.6 OCT provides an objective
assessment of treatment response that is not influenced by
observer or patient bias. Because reproducibility is high
and sudden changes in DME are unusual, spontaneous
short-term changes of more than 30 m are rarely seen.9
One week after a single injection of 0.5 mg of ranibizumab
(a specific antagonist of VEGF) in 10 patients with chronic
DME, there were median and mean reductions in foveal
thickness of 88 and 130 m, respectively. This strongly
suggests that VEGF is a stimulus for retinal thickening, which
is a conclusion that is supported by the added improvement
in foveal thickness that is achieved with four additional
injections of ranibizumab that result in median and mean
reductions in foveal thickness of 261 and 246 m, respectively, at seven months, which was the primary end point
968
AMERICAN JOURNAL
OF
OPHTHALMOLOGY
DECEMBER 2006
This study raises several questions. Are the different
patterns of response to intraocular injections of ranibizumab in different patients because of different levels of
VEGF production in these patients? What is the optimal
timing for injections? There appeared to be a plateau in the
amount of reduction of foveal thickening during the first
three months of the study when monthly injections of
ranibizumab were given, with additional benefit achieved
by switching to injections every other month. It is important to determine whether this is a valid observation that
can be confirmed or simply random variation. If it is a valid
observation, it suggests that there may be some compensatory response during the monthly injection phase, such as
increased expression of VEGF that is circumvented by less
frequent injections. The most important question raised by
the study is whether intraocular injections of ranibizumab can
provide long-term benefit in patients with DME. The mean
improvement of 12.3 letters of visual acuity over seven
months is suggestive, but a larger double-masked, randomized,
controlled trial that will span several years is needed to
determine the ultimate value of ranibizumab for patients with
DME. Such a trial is being planned.
REFERENCES
1. Klein R. Retinopathy in a population-based study. Trans Am
Ophthalmol Soc 1992;90:561–594.
VOL. 142, NO. 6
RANIBIZUMAB
FOR
2. Moore J, Bagley S, Ireland G, et al. Three dimensional
analysis of microaneurysms in the human diabetic retina.
J Anat 1999;194:89 –100.
3. Nguyen QD, Shah SM, van Anden E, et al. Supplemental
inspired oxygen improves diabetic macular edema: a pilot
study. Invest Ophthalmol Vis Sci 2003;45:617– 624.
4. Ozaki H, Hayashi H, Vinores SA, et al. Intravitreal sustained
release of VEGF causes retinal neovascularization in rabbits
and breakdown of the blood-retinal barrier in rabbits and
primates. Exp Eye Res 1997;64:505–517.
5. Derevjanik NL, Vinores SA, Xiao W-H, et al. Quantitative
assessment of the integrity of the blood-retinal barrier in
mice. Invest Ophthalmol Vis Sci 2002;43:2462–2467.
6. Huang D, Swanson EA, Lin CP, et al. Optical coherence
tomography. Science 1991;254:1178 –1181.
7. Hee MR, Izatt JA, Swanson EA, et al. Optical coherence
tomography of the human retina. Arch Ophthalmol 1995;
113:325–332.
8. The Early Treatment Diabetic Retinopathy Study Research
Group. Photocoagulation for diabetic macular edema, ETDRS
Report No. 1. Arch Ophthalmol 1985;103:1644 –1652.
9. Chan A, Duker JS, Ko TH, et al. Normal macular thickness
measurements in healthy eyes using Stratus optical coherence tomography. Arch Ophthalmol 2006;124:193–198.
10. Campochiaro PA, C99-PKC412-003 Study Group. Reduction of diabetic macular edema by oral administration of the
kinase inhibitor PKC412. Invest Ophthalmol Vis Sci 2004;
45:922–931.
11. Macugen Diabetic Retinopathy Study Group. A phase II
randomized double-masked study of pegaptanib, an antivascular endothelial growth factor aptamer, for diabetic
macular edema. Ophthalmology 2005;112:1747–1757.
DIABETIC MACULAR EDEMA
969
Biosketch
Quan Dong Nguyen, MD, MSc, is an Assistant Professor of Ophthalmology at Johns Hopkins, Baltimore, Maryland. A
graduate of Phillips Exeter Academy, Yale University, and University of Pennsylvania School of Medicine, Dr Nguyen
completed his residency and fellowships in Uveitis and Retina and Vitreous at the Massachusetts Eye and Ear Infirmary
and the Schepens Eye Research Institute, and a fellowship in Ocular Immunology at Wilmer. Dr Nguyen focuses his
research on early clinical trials of pharmacologic treatments for macular degeneration, macular edema, and ocular
inflammatory diseases.
969.e1
AMERICAN JOURNAL
OF
OPHTHALMOLOGY
DECEMBER 2006
Biosketch
Syed Mahmood Ali Shah, MBBS, is a Research Scientist managing the Retinal Imaging Research and Reading Center
(RIRRC) at the Wilmer Eye Institute of the Johns Hopkins Medical Institutions, Baltimore, Maryland. A graduate of the
Aga Khan University Medical College, Karachi, Pakistan, Dr Shah specializes in development of new and novel models
of digital retinal imaging and efficacy analysis for clinical trials in ophthalmology.
VOL. 142, NO. 6
RANIBIZUMAB
FOR
DIABETIC MACULAR EDEMA
969.e2
SUPPLEMENTARY FIGURE 1S. Excess macular volume measured by optical coherence tomography (OCT) in all patients at
each study visit. Each bar represents the macular volume above the normal mean value of 6.94 mm3, which is set to 0. The arrows
show intraocular injections of 0.5 mg of ranibizumab.
969.e3
AMERICAN JOURNAL
OF
OPHTHALMOLOGY
DECEMBER 2006
SUPPLEMENTARY FIGURE 2S. The mean excess macular volume for all 10 patients at each study visit. Each bar represents the
mean value for excess macular volume for all patients at the designated study visit. The arrows show when intraocular injections
of 0.5 mg of ranibizumab were administered. Compared to baseline, macular volume was reduced by 1.75 mm3 at the primary
endpoint of the study, constituting elimination of 77% of the excess macular volume that had been present at baseline.
VOL. 142, NO. 6
RANIBIZUMAB
FOR
DIABETIC MACULAR EDEMA
969.e4