Monitoring Extended Enterprise Operations Using KPIs and a Performance Dashboard
Bạn đang xem bản rút gọn của tài liệu. Xem và tải ngay bản đầy đủ của tài liệu tại đây (285.17 KB, 11 trang )
ABSTRACT NUMBER: 002-0038
TITLE OF THE PAPER: Monitoring Extended Enterprise Operations Using KPIs and
a Performance Dashboard
Second World Conference on POM and 15th Annual POM Conference, Cancun, Mexico,
April 30 - May 3, 2004.
Name: Marco Busi
Institution:
1. Norwegian University of Science and Technology, Department of Quality and
Production Engineering
2. SINTEF Industrial Management, Department of Economics and Logistics
Address: S.P. Andersens v. 5, 7491 Trondheim, Norway
E-mail :
Phone: +47 92618768
Fax: +47 73597117
Name: Jan Ola Strandhagen
Institution:
3. Norwegian University of Science and Technology, Department of Quality and
Production Engineering
4. SINTEF Industrial Management, Department of Economics and Logistics
Address: S.P. Andersens v. 5, 7491 Trondheim, Norway
E-mail :
Phone: +47 73593800
Fax: +47 73597117
-1-
Monitoring Extended Enterprise Operations Using KPIs and a Performance Dashboard
Marco Busi, Jan Ola Strandhagen
;
Department of Production and Quality Engineering, Norwegian University of Science and Technology
(NTNU), Trondheim, Norway
SINTEF Industrial Management, Trondheim, Norway
ABSTRACT
The importance of performance management in relation to supply chain management is to
play a vital role in translating strategy into achievable objective along and at the single
nodes of the chain. The subject of performance management being a wide one, the author
needs to narrow down the scope of this paper to the analysis of how performance indicators
selection and representation should be carried out in order to support such strategy
translation. This paper answers one main research question, i.e. how can key performance
indicators (KPIs) for controlling supply chain operations be identified and selected. In
addition it discusses how the existing information and communication technology could
enable true extended enterprise performance management through the development of a
performance dashboard. Answers to these questions are based on review of existing
literature as well as on results from action research in which the author has been involved.
INTRODUCTION
This paper analyzes the concept of performance management as being part of supply chain
management. The authors have been and are working on an innovative concept of supply
chain performance management, defining: an extended enterprise performance management
philosophy, proposing a list of extended enterprise key performance indicators (KPIs), and
designing an electronic KPIs dashboard 1.
In performance management related literature some terms, e.g. measure metric and indicator,
are used differently by different authors, often mixing research on performance measurement
with results on how to use performance indicator (Winston, 1999). One reason for this may
be the blurred borderline between some of the definitions. We therefore want to let the
reader know what the terms used in this paper mean for us who wrote it, establishing hence
a fix set of terms univocally defined.
DEFINITION OF A COMMON SET OF TERMS AND CONCEPTS RELATED TO
EXTENDED ENTERPRISE PERFORMANCE MANAGEMENT.
Some of the ideas and concept hereby presented originated from a European research project, MOMENT
(MObile extended Manufacturing ENTerprise). We hence would like to thanks all partners participating in the
development of such ideas. In particular we thank CIMRU (Ireland) for the programming development of the
electronic dashboard.
1
-2-
We use the term extended enterprise instead of supply chain to stress that with the result of
this research we aim to improve integration between chain partners. In developing a
performance management philosophy from an extended enterprise perspective we analyze
and model each value chain from a focal enterprise’s point of view. While considering the
whole value chain, our research sets the limits to operations models that include the closest
customers and suppliers of the focal enterprise. In more detail, we talk about extended
enterprise processes referring to those related with the flow of information and material from
the supplier’s outbound logistics, through the manufacturer’s manufacturing logistics
process, down to the customer’s inbound logistics. Though, the focal enterprise could be
any supplier in a value chain 2.
According to Kathuria and Partovi (2000) there is a general agreement in the manufacturing
strategy literature that the decisions regarding the structure and infrastructure of an
organisation should be in line with its competitive priorities (Hayes and Wheelwright, 1984;
Anderson, Cleveland and Schroeder, 1989; Ward, Leong and Snyder, 1990; Hill, 1994). In
this context, competitive priorities have been referred to as the dimensions of manufacturing
strategy or the content of manufacturing strategy. Hayes and Wheelwright (1979) identified
competitive priorities with certain “dominant competitive mode” and “key management
task”.
Enterprise competitive priorities depend on the customer’s order-winners and -qualifiers. In
order analyze how “good” an enterprise is in understanding and fulfilling customer
requirements we introduce the two terms of effectiveness and efficiency. Effectiveness refers
to the extent to which customer requirements are met, while efficiency is a measure of how
economically the firm’s resources are used when providing a given level of customer
satisfaction (Neely et al., 1995). Thus we say that performance measurement is the process
of quantifying the efficiency and effectiveness of an action (Neely et al., 1995).
A performance metric is a number or value that has been directly measured (e.g. no. of
failures per day); metrics used to quantify the efficiency and/or effectiveness of an action
are defined as performance measures and/or performance indicators.
A Key Performance Indicator (KPI) is a number or value which can be compared against an
internal target (or an external target - “benchmarking”) to give an indication of performance.
That value can relate to data collected or calculated from any process or activity (adapted
from Ahmad and Dhafr, 2002). Performance indicators and KPIs are descriptive, i.e. they are
derived from the performance metric measurement (e.g. % rejects) (Lupton and Dooley,
2003).
Last, a performance measurement framework assists in the process of performance
measurement system building, by clarifying performance measurement boundaries,
specifying performance measurement dimensions or views and may also provide initial
intuitions into relationships among the performance measurement dimensions.
DEVELOPMENT
OF
THE
EXTENDED
ENTERPRISE
MANAGEMENT CONCEPT.
2
From the MOMENT project deliverable, D1.4, The MOMENT conceptual framework
-3-
PERFORMANCE
The extended enterprise performance management concept hereby presented consists of the
following three components:
1. An extended enterprise performance management philosophy: the related research is
completed. The outcomes produced include:
a. Theoretical guidelines for extended enterprise management through
performance:
•
Description of the role of PM in translating extended enterprise
strategy into operations goals (top-down approach) 3.
•
Description of the role of actual performance of local nodes
operations as inputs to extended enterprise strategy definition or refinement
(bottom-up approach) 3.
•
Definition of the rules for linking the performance measures and
indicators to the extended enterprise operations and process model.
•
Development of the extended enterprise balanced scorecard concept
and methodology for its use.
b. Definition of the performance indicators selection framework:
•
For extended enterprise KPI selection.
•
For local node KPI selection.
c. Definition of the role of ICT to support extended enterprise performance
management:
•
Electronic performance management based on use of electronic KPIs
dashboard: definition of tool’s features.
2. A list of KPIs: research related to this particular issue is still on-going. We though
reached some milestones:
a. Definition of most relevant performance indicators groups 3.
b. Definition of a list of ~20 extended enterprise KPIs linked to the extended
enterprise process model3.
c. Selection of an additional list of ~100 indicators for local node performance
analysis3 and development of a selection support tool.
3. An electronic KPIs dashboard: research related to this tool is still on-going as for the
programming. Up-to-date we have developed an electronic first version prototype.
In this paper we will focus on considerations related to the KPIs -their selection, use and
display-.
SELECTION OF RELEVANT KPIS FOR EXTENDED ENTERPRISE AND LOCAL
NODE PERFORMANCE MANAGEMENT
Even though it is correct to consider the extended enterprise as one single unit, managing its
performance needs to consider both single nodes and extended enterprise processes. This in
turn means that the set of KPIs used to manage extended enterprise performance, may be
composed of two different types: indicators appraised at the single nodes, and indicators
appraised and analyzed at the extended enterprise level. The two sets are correlated in
different ways: extended enterprise can be aggregated value of single node indicators, or, as
For a more detailed discussion, please refer to Busi, M., Strandhagen, J.O., (2004), Translating Extended
Enterprise strategy into operations: a performance management approach. In Pre-Prints of the 13 th
International Working Seminar on Production Economics, Vol. 2, pp. 77 – 86.
3
-4-
well, they can be based on measurements done at different points of the extended enterprise
process. The major issue to solve is therefore how to cope with this bias between extended
enterprise and local node KPIs. The next paragraph describes the concept of extended
enterprise balance scorecard, which tackles this very issue.
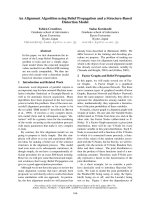
The extended enterprise balance scorecard
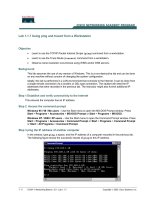
The development of an extended enterprise balance scorecard, which contains all relevant
indicators and give them an extended enterprise perspective may be developed using the
model shown in Fig. 1.
Extended Enterprise Perspective
(EE KPIs)
Supplier
S KPIs
(S1 - Sn)
Supplier Perspective
Company A
(Manufacturer)
Internal. Perspective
(X KPIs)
Customer Perspective
C KPIs
(C1 - Cn)
Customer
Fig. 1 -Extended enterprise balance scorecard - development model
Considering an extended enterprise, as shown in Fig. 1, one will notice that four different
perspectives must be considered when selecting indicators to include in the extended
enterprise balanced scorecard:
•
Internal-perspective (X KPIs) – inside the four walls of the
company.
•
Supplier-perspective (S1 - Sn KPIs) – located at the interface of the
company and its respective suppliers.
•
Customer-perspective (C1 - Cn KPIs) – located at the interface of
the company and its respective customers,
•
Extended Enterprise-perspective (EE KPIs) – the holistic system.
The model shown in Fig. 1, where only one supplier, one manufacturer and one customer are
included, must be replicated per each company in the extended enterprise. Each node must
examine both their intra- and inter-organisational performance. In addition, each node is
required to maintain their internal set of KPI as one perspective, while also up-keeping KPIs
at the two surrounding interfaces - supplier and customer; finally the holistic approach is
completely covered by asking each node to account for certain extended enterprise measures
in the extended enterprise-perspective.
At this point, the selected indicators grouped together will form the final extended enterprise
balanced scorecard, which will be used to manage the extended enterprise based on local as
well as global performance. In other words, considering that the different perspectives cover
the whole range of actors’ needs in the extended enterprise, it follows that the extended
enterprise balance scorecard can be used for both local as well as global management.
Now that the extended enterprise balance scorecard concept has been illustrated, we will
discuss how to filter the KPIs into suggested “scorecards” or “dashboards” for the different
actors in the extended enterprise.
Selection of KPIs for local node- and extended enterprise dashboard development.
-5-
Considering both the definition of extended enterprise given at the beginning of this paper
and the concept of the extended enterprise balance scorecard, it follows that at the local
node level, only three perspectives of the extended enterprise balanced scorecard are of
interest: the supplier-, internal-, and customer-perspective. The extended enterpriseperspective is dealt with at the higher extended enterprise level.
Before we discuss the selection framework, we need to introduce the concept of extended
enterprise host. The extended enterprise host is the member of the extended enterprise with
responsibilities for formulating, detailing and distributing information concerning the
extended enterprise direction and requirements to the other nodes of the extended enterprise.
Furthermore, the extended enterprise host controls the aggregated extended enterprise
perspective, and issue audit requests to the other nodes. The recommended extended
enterprise host is a first-tier supplier of the extended enterprise. The reasons for the
nomination of a first-tier supplier over other parties (in particular the Original Equipment
Manufacturer – the O.E.M.) are similar to those proposed by Gulledge (2002; 2003):
O.E.Ms. have few incentives to broker transactions with their smaller supplier counterparts
in the extended enterprise, and they have specific implementation conventions that they may
pressure their suppliers to adapt to. In extended enterprise performance management this
situation may lead to O.E.Ms. forcing particular KPIs upon their suppliers.
The requirements of the extended enterprise performance management concept hereby
described are: the full participation from those parties that are interested, and a common
electronic platform, as opposed to specific implementation conventions.
The separation of the supplier-, internal-, and customer-perspectives from the extended
enterprise-perspective is essential. Allowing the local node to concentrate upon their inner
processes and immediate linkages with their respective suppliers and customers, means that
the extended enterprise-perspective becomes independent, and is thus treated equally with
the other perspectives. The local node concentrates upon those perspectives that it sees as
being of immediate importance to its development, while leaving to the specialist extended
enterprise host the issue of determining the extended enterprise KPIs. Entrusting the
extended enterprise-perspective to the local nodes risks downgrading its importance; the
local node is unlikely to be in a good “position” (extended enterprise-wise) to develop such
perspective sufficiently.
The previous considerations have led to the development of two frameworks for the
selection of KPIs to display in the dashboard:
• Local node framework (concerned with the supplier-, internal-, and customerperspective);
• EE node framework (as implemented by the EE host) (concerned with the EEperspective).
Local node framework
The performance indicators selection framework for the local node level is a sequence of the
following steps:
• Define the company’s mission and strategy: important to allow effective translation
of the resulting strategy into effective KPIs.
-6-
•
•
•
•
•
Determine the importance of the competitive priorities 4 for each perspective: this
must be assessed according to the company’s strategy derived in the previous stage.
This step is crucial for determining the relevant KPIs.
Derive critical success factors and customer requirements from the company’s strategy:
using competitive priorities strategy, statements are translated and developed.
Select measures: At the end of this stage a list of KPIs for the internal-, supplier- and
customer-perspective should have been specified under the various competitive
priorities.
Implementation of KPIs: A performance measure record sheet is produced to
standardise the process of actually recording used KPIs in the company.
Periodic Review.
EE node framework
The extended enterprise performance measurement selection framework at the extended
enterprise level is similar to the previous one:
• Develop the extended enterprise direction and requirements plan: the extended
enterprise host should develop the plan through an examination of the four factors of
Waggoner et al. (1999): the internal, external, process and transformational factors.
• Translate the plan into KPIs: performed in a similar fashion to the second step
previously discussed.
• Select measures using extended enterprise KPI template list: at the end of this section
a list of KPIs for the extended enterprise perspective is specified under the various
macro measures of performance.
• Transmit the developed extended enterprise KPIs: the extended enterprise host must
transmit the KPIs to those parties that require them.
• Periodic Review
At this phase of implementation of the extended enterprise performance management
concept, each actor in the chain should have a balance scorecard available, and, at the same
time, the overall extended enterprise balance scorecard should be available as well.
Measures alone are though not useful. They must be appraised and analyzed periodically in
order to control extended enterprise operations and to support strategy refinements. An
important role in this regards is played by information and communication technology,
which makes it possible for globally distributed extended enterprise to maintain and
visualise real time measurements of the KPIs at different stages and in different views. In the
following paragraph we describe a first version of an ICT supported KPI dashboard we are
developing for supporting extended enterprise operation control based on performance
monitoring and analysis.
MONITORING SUPPLY CHAIN OPERATIONS USING A PERFORMANCE
DASHBOARD.
In the extended enterprise performance management concept, KPIs are used:
•
To monitor performance
•
To evaluate and analyze performance
4
Cost, time, quality, flexibility, precision, innovation, and environment
-7-
•
•
•
To monitor the status of the flows and processes in the logistics value chain
As a decision support for controlling the flow of goods and information in the value
chain (supply chain control)
To identify problems and focus effort in improvement projects.
That is, indicators show past, present and expected future performance levels, being
therefore used to monitor, evaluate and analyze the material- and information-flow
performance (Busi et al., 2003).
Considering the value of time savings in today’s global competition, it is clear that real-time
measurement of important indicators in the extended enterprise becomes utterly important.
Hence, the extended enterprise performance management concept requires an automated
measurement and analysis system: thanks to existing ICTs, an electronic performance
dashboard would enable the users to easily access real-time measurement, ensuring efficient
extended enterprise operation control.
Features of the ICT supported dashboard are:
1. Electronic and integrated measurement of KPIs along the whole extended enterprise:
collecting information from the ERP-system, the data collection system, the
communication system (EDI), etc., KPIs value is shown as measured on-demand and
therefore real-time.
2. Display of the KPIs as “linked” to the extended enterprise process model: KPIs must
be easy-to-find at different location on the process model, hence attaching the KPIs
as relevant data to the flow of information and material in the extended enterprise
3. Display of the KPIs values and trends in a user-friendly fashion: information built-in
the KPIs and useful for performance analysis must be shown using different display
technique, both graphical and text-based. This has a two fold objective: first, it
allows the performance analyst to get a quick but precise snapshot of the extended
enterprise performance at the instant he needs it; second, it support learning and
training of non-expert users in need of using extended enterprise performance related
information for any particular reason.
4. Display of the shared local KPIs and the extended enterprise KPIs as “linked” to the
extended enterprise operations model5: it gives the user to rapidly assess performance
at any virtual location in the chain, pinpointing for example weak links in the
extended enterprise.
At this stage of our work, we developed a very first draft of a KPIs dashboard together with
a case company that is moving towards integration with its partners to become an integrated
extended enterprise. In this case, the status of development of the tool, referring to the list of
features discussed above is as follows:
1. Electronic and integrated measurement of KPIs along the whole extended enterprise:
the dashboard gathers the needed measures (i.e. data) automatically from the
different management system already in use. It therefore must be seen as a system
above the typical for example ERP systems; like an integration platform common to
all extended enterprise actors. The data gathering is based on accessing the different
management system databases of information and extracts only the data of interest.
2. Display of the KPIs as “linked” to the extended enterprise process model: after
having implemented the extended enterprise performance management concept, a list
For more information related to the extended enterprise operation model please refer to Busi, M.,
Strandhagen J.O., (2003). Towards Extended Enterprise Integration, in Proceedings of the International
Symposium on Logistics, Sevilla (Spain), 2003.
5
-8-
of about 20 KPIs plus an additional ~100 (for local node dashboard), have been
defined. At this stage the graphical representation of the link between indicators and
process model is still missing; though, formulas of indicators use existing measures
located at specific and unique position in the process model.
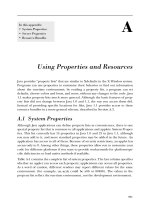
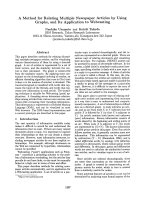
3. Display of the KPIs values and trends in a user-friendly fashion: different
possibilities have been analyzed so far and several proposals are under study. Fig. 2
shows one possible way of graphically displaying the KPIs values and trends in the
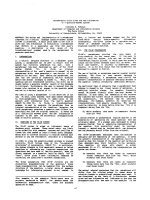
dashboard. While Fig. 4 shows a text-based representation of the list of KPIs in the
dashboard.
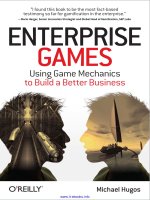
4. Display of the shared local KPIs and the extended enterprise KPIs as “linked” to the
extended enterprise operations model: selecting an actor from the extended enterprise
operation model is now possible to access the relevant KPIs he’s for the moment
willing to share. The access page, which is an electronic version of the extended
enterprise operation model is shown in Fig. 3.
Fi
g. 2 - The KPI dashboard should enable the performance analyzer to quickly see performance.
Fig. 3 - Electronic extended enterprise operations model. It can be used for performance monitoring.
-9-
Fig. 4 - A KPIs dashboard should support several reporting possibilities. Example of KPIs textual
representation
CONCLUSION
In this paper we discussed the extended enterprise performance management concept. We
focused mainly on the importance of selecting relevant indicators, and we proposed a model
for extended enterprise balance scorecard development. In addition we discussed the
features that a KPIs dashboard should have in order to support extended enterprise
operations control and we finally presented an ICT supported performance dashboard that
we are developing in a case company.
With this paper we aim to contribute to the scientific literature with the extended enterprise
performance management concept we have discussed; and to the industrial world with the
electronic performance dashboard we have presented.
REFERENCES
- 10 -
Ahmad, M. M., and Dhafr, N. (2002). "Establishing and improving manufacturing
performance measures." Robotics and Computer-Integrated Manufacturing, 18(3-4), 171176.
Anderson, J.C., Cleveland, G., & Schroeder, R.G. (1989). “Operations strategy: A literature
review”. Journal of Operations Management, 8(2), 133–158.
Busi, M., Strandhagen J.O., (2003). ”Towards Extended Enterprise Integration”, in
Proceedings of the International Symposium on Logistics, Sevilla (Spain), 2003.
Busi, M., Strandhagen, J.O., (2004), “Translating Extended Enterprise strategy into
operations: a performance management approach”. In Pre-Prints of the 13th International
Working Seminar on Production Economics, Vol. 2, pp. 77 – 86.
Gulledge, T. (2002). "B2B eMarketplaces and small- and medium-sized enterprises."
Computers in Industry, 49(1), 47-58.
Gulledge, T. (2003). "e-Hubs: The Critical Role of First-Tier Suppliers." E-Business
Applications: Technologies for Tomorrow's Solutions, J. Gasos and K. Thoben, eds., SpringerVerlag, Berlin.
Hayes, R.H., & Wheelwright, S.C. (1979). “Link manufacturing process and product life
cycles”. Harvard Business Review, Jan./Feb., 133–140.
Hayes, R.H., & Wheelwright, S.C. (1984). “Restoring our competitive edge: Competing
through manufacturing”. New York: Wiley.
Hill, T. (1994). “Manufacturing strategy: Text and cases” (2nd ed.). Homewood, IL: Richard
D. Irwin.
Kathuria and Partovi (2000), “Aligning Work Force Management Practices With
Competitive Priorities And Process Technology: A Conceptual Examination”, The Journal of
High Technology Management Research, Vol. 11, Number 2, pages 215–234, Elsevier
Science Inc.
Lupton, G., and Dooley, L. (2003). "Product Life Cycle Performance Indicators." Proc. 20th
Inter. Manuf. Conf. IMC 20, Cork, 591-597.
Neely, A., Gregory, M., and Platts, K. (1995). "Performance measurement system design - A
literature review and research agenda." International Journal of Operations & Production
Management, 15(4), 80-116.
Waggoner, D., Neely, A., and Kennerley, M. (1999). "The forces that shape organisational
performance measurement systems: An interdisciplinary review." International Journal of
Production Economics, 60-61, 53-60.
Ward, P.T., Keong Leong, G., & Snyder, D.L. (1990). “Manufacturing strategy: An overview
of current process and content models”. In Ettlie, J.E., Burstein, M.C., & Fiegenbaum, A.,
(Eds.), Manufacturing strategy. Boston, MA: Kluwer Academic Publishers.
Winston, J. (1999). "Performance Indicators - Promises Unmet: A Response to Perrin."
American Journal of Evaluation, 20(1), 95-99.
- 11 -