TechnoGIN, a tool for exploring and evaluating resource use efficiency of cropping systems in east and southeast asia
Bạn đang xem bản rút gọn của tài liệu. Xem và tải ngay bản đầy đủ của tài liệu tại đây (486.59 KB, 21 trang )
AGRICULTURAL
SYSTEMS
Agricultural Systems 87 (2006) 80–100
www.elsevier.com/locate/agsy
TechnoGIN, a tool for exploring and
evaluating resource use efficiency of
cropping systems in East and Southeast Asia
Thomas C. Ponsioen a,*, Huib Hengsdijk b, Joost Wolf
Martin K. van Ittersum d, Reimund P. Roătter c,
Tran Thuc Son e, Alice G. Laborte f
c,*
,
a
d
Agricultural Economics and Rural Policy, Wageningen University, P.O. Box 8130,
6700 EW Wageningen, The Netherlands
b
Plant Research International, Wageningen University and Research Centre,
P.O. Box 16, 6700 AA Wageningen, The Netherlands
c
Alterra, Wageningen University and Research Centre, P.O. Box 47,
6700 AA Wageningen, The Netherlands
Plant Production Systems, Wageningen University, P.O. Box 430, 6700 AK Wageningen, The Netherlands
e
National Institute for Soils and Fertilisers, Chem, Tu Liem, Hanoi, Vietnam
f
International Rice Research Institute, DAPO Box 7777, Metro Manila, Philippines
Received 18 February 2004; received in revised form 20 August 2004; accepted 29 November 2004
Abstract
Agricultural research in East and Southeast Asia is increasingly challenged by the search
for land-use options that best match multiple development objectives of rural societies (e.g.,
increased income, food security, and reduced environmental pollution). In order to support
the identification of sustainable land-use options and to support decision making with respect
to land use, a tool was developed for quantifying inputs and outputs of cropping systems at
the field level. TechnoGIN, the tool described in this paper, integrates systems analytical
and expert knowledge and different types of agronomic data enabling the assessment of inputs
*
Corresponding authors. Tel.: +31 317 482949; fax: +31 317 484736 (T.C. Ponsioen), Tel.: +31 317
474593; fax: +31 317 419000 (J. Wolf).
E-mail addresses: (T.C. Ponsioen), (J. Wolf).
0308-521X/$ - see front matter Ó 2005 Elsevier Ltd. All rights reserved.
doi:10.1016/j.agsy.2004.11.006
T.C. Ponsioen et al. / Agricultural Systems 87 (2006) 80–100
81
and outputs of a broad range of cropping systems and the evaluation of their resource use efficiencies. By using methods of spatial aggregation in combination with linear programming,
results can also be used to explore trade-offs in resource-use efficiencies at higher levels such
as the farm household, municipality and province. New features in TechnoGIN compared
with similar tools include the annual rotation of up to three crops, the distinction between aerobic and anaerobic growing conditions of crops, and the procedure for estimating crop nutrient uptake. TechnoGIN is illustrated with results from the Tam Duong district in North
Vietnam. The design of TechnoGIN enables easy access to its data, parameters and assumptions, and rapid generation and evaluation of input–output relationships of cropping systems
in order to add new information and to improve data. TechnoGIN raises awareness about the
assumptions incorporated and thus supports data collection and setting of the research agenda
with respect to agro-ecological processes for which knowledge is incomplete, and is relevant
for showing trade-offs between production, economic and environmental impacts of different
land-use systems.
Ó 2005 Elsevier Ltd. All rights reserved.
Keywords: Land-use systems; QUEFTS; Resource-use efficiency; Rice-based systems; Systems analysis;
Linear programming
1. Introduction
East and Southeast Asia is increasingly challenged by various development objectives of rural societies such as increased income, employment, improved natural resource-use efficiency, food security, and reduced environmental pollution.
Agricultural research therefore needs to be focused on the search for land-use options that best match these objectives. This calls for effective research tools enabling
resource-use analysis at different levels of integration (i.e., farm household, municipality or district, province, and state) to support decision making with respect to
agricultural land use. These tools must be able to identify potential conflicts among
land-use objectives and resource use in order to generate technically feasible, environmentally sound, and economically viable land-use options that best meet a
well-defined set of rural development goals.
Since the 1980s, the method of interactive multiple goal linear programming
(IMGLP) has been proposed for an integrated analysis of resource use at regional
or farm level (De Wit et al., 1988). This method has been applied in various landuse studies (e.g., Van Latesteijn, 1995; Barbier, 1998; Bouman et al., 1999; Lu
et al., 2004). Key components in this approach are (1) databases on biophysical
and socio-economic resources and development targets, (2) a description of inputs
and outputs of promising land-use activities, (3) a multiple criteria decision method
(optimisation), and (4) sets of goal variables representing specific objectives and
constraints.
This framework has been further improved and applied within the SysNet project,
aimed at the development and evaluation of methodologies for exploring land-use
options at regional scale in South and Southeast Asia (Hoanh and Roetter, 1998;
82
T.C. Ponsioen et al. / Agricultural Systems 87 (2006) 80–100
Roetter et al., 2005). Building upon this experience, a new research network, ‘‘Systems Research for Integrated Resource Management and Land Use Analysis in East
and Southeast Asia (IRMLA)’’, has been set up for several multi-scale case studies in
East and Southeast Asia. These studies combine the assessment of land-use alternatives with evaluation of stakeholder-negotiated choices at different decision levels
(farm, district, and province) and supportive policy measures. TechnoGIN, the tool
described in this paper, has been developed within this IRMLA project. Within
IRMLA four case study areas have been selected: Batac and Dingras municipalities
(Ilocos Norte province, Philippines), Pujiang county (Zhejiang province, China),
Tam Duong district (Red River Delta, Vietnam), and O Mon district (Mekong
Delta, Vietnam).
TechnoGIN allows the quantification of inputs and outputs of large numbers of
current and prospective cropping systems in these case study areas. TechnoGIN
stands for Technical coefficient Generator for Ilocos Norte province, Philippines,
as it was originally developed for this province (Ponsioen et al., 2003). The term technical coefficient generator (TCG) is used for similar tools that were developed for the
purpose of explorative land-use analysis under multiple goals (De Koning et al.,
1995; Hengsdijk et al., 1996, 1998, 1999; Bouman et al., 1998). The term Ôtechnical
coefficient (TC)Õ refers to the inputs and outputs of land-use systems in economic
and physical terms as quantified by this type of tool.
The purpose of this paper is to present the innovative aspects of TechnoGIN that
add to the variety of approaches available. TechnoGIN allows integration of different types of information on crop production and may support the scientific community in integrated analysis of cropping systems. Important concepts that are used in
TechnoGIN are defined in Section 2. The structure of the tool and its data requirements are presented in Section 3. The calculation rules that were applied for nutrient
and water balances, labour requirements and cost-benefit analyses, are presented in
Section 4. To illustrate the type of output generated, an application is presented in
Section 5 for the case study Tam Duong district. In addition, application domains
of TechnoGIN output are indicated. The new features of TechnoGIN compared
with other TCGs, and factors that may affect the quality of its output, are discussed
in Section 6.
2. Concepts
TechnoGIN enables the calculation of inputs and outputs of the so-called landuse systems (LUS), which are combinations of different land units (LU), land-use
types (LUT) and production techniques. Land units refer to areas of land that are
relatively homogenous in their biophysical (climate and soil characteristics) and socio-economic properties (input and output prices). Here, LUT is defined as a crop
sequence of one, two or three crops per year. Production techniques refer to the complete sets of inputs used to realise a well-defined yield (Van Ittersum and Rabbinge,
1997). In TechnoGIN, most inputs and outputs are calculated on a cropping season
and an annual basis. Exceptions are labour and water requirements, which are
T.C. Ponsioen et al. / Agricultural Systems 87 (2006) 80–100
83
expressed on a 10-day basis because the availability of both can be highly variable in
time and may thus be decisive in trade-off analysis. Besides marketable products and
crop residues, the undesirable outputs of cropping systems, such as soil nutrient
depletion and pollution of the environment by nitrate leaching and biocide emission,
are calculated too.
TCGs are specifically developed to quantify differences in resource use of conventional and improved land-use systems. Hence, TechnoGIN enables us to analyse input–output relationships for both current and prospective cropping systems.
Quantification of the relationships for current cropping systems is based on interpretation of survey data, whereas TechnoGIN simulates the information that is often
not available from surveys, such as the amount of nutrients lost and water balances.
Prospective or future-oriented cropping systems, however, are based on productionecological knowledge, technical insight and required objectives, warranting increased
resource-use efficiency and yield levels as compared with those in current systems
(Hengsdijk and Van Ittersum, 2002). Differences in efficiencies between production
techniques can be ascribed to differences in farmersÕ management, knowledge (education), infrastructure (market for inputs and outputs), labour availability, etc.
Key in calculating TCs for future-oriented cropping systems is the so-called Ôtarget-orientedÕ approach implying that first a target output (i.e., yield) level is determined, based on the biophysical conditions and the objectives for future crop
production in the area under study. Subsequently, the optimal combination of inputs
required to realise this target yield is calculated with TechnoGIN. This target-oriented approach enables us to quantify the minimum required amount of various inputs such as labour, water, and fertiliser for a well-defined output. In TechnoGIN,
target yields are set equal to yields under Ôcurrent practiceÕ and Ôbest farmer practiceÕ,
based on information from field surveys and experiments, literature, modelling, and
expert knowledge.
3. Model structure and input data
3.1. Structure and features
Similar to TCGs developed for West Africa (Hengsdijk et al., 1996) and Costa
Rica (Hengsdijk et al., 1998), TechnoGIN is programmed in Microsoft Excel
whereas all calculation rules are programmed in Microsoft Visual Basic for Applications. TechnoGIN consists of two files. The main file contains the calculation rules, a
user interface, and the generated TCs. The database file must be created for each
area under study and contains different types of data sets, organised into different
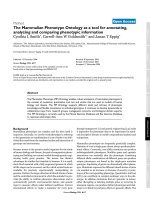
worksheets. A simplified representation of the structure is shown in Fig. 1. This figure shows the main parts of the system: (a) data bases, (b) user interface, (c) calculations, (d) technical coefficients (i.e., the system output). The data bases in Excel
sheets contain the required data described in Section 3.2 and listed in more detail
in Table 1. The user interface is described in the next paragraph. The calculations
84
T.C. Ponsioen et al. / Agricultural Systems 87 (2006) 80–100
Fig. 1. Schematic representation of the structure of TechnoGIN. The arrows represent flows of data.
Table 1
Data requirements per data sheet in TechnoGINa
Data sheet
Data requirements
Production techniques
Relative nutrient use (R), biocide use (R) and water use efficiencies (R)
compared with those for current techniques. Labour (R), fuel (R), machine
(R) and animal use (R) proportionally to those under current techniques.
Prices of labour, fuel, machinery, draft animal and irrigation water (S).
Maximum yield (S or F), dry matter content (F), harvest index (F),
minimum and maximum N, P and K concentrations (F) in harvested
products and crop residues, crop duration (S), crop coefficients (S), labour
requirements per labour task (S), number of dekads needed for land
preparation and harvesting (F), seed amount (F), fuel (S), machinery use
(S), draft animal use (S), investments (S), recovery correction factor (F),
anaerobic/aerobic (F), biocide use (S), farm gate prices (S), seed prices (S),
current fertiliser rates for each land unit (S).
Crop rotation in one year (S), fraction of crop residues used as fodder,
burnt or mulched (S), low and high target yields per crop type and land unit
(S).
Long-term soil supply of N, P and K (S), maximum soil water holding
capacity (F), elevation and slope (S), fractions of sand, silt and clay (S),
rainfall (S) and reference evapotranspiration (S) per dekad.
Active ingredient (S), duration (S), EPA/WHO index (S), and prices (S) for
each biocide type.
DM content (S), N, P and K concentrations (S) and prices (S) for each
fertiliser type.
Relative nutrient use (R), biocide use (R) and water use efficiencies (R)
proportionally to relative yield level.
Conversion rates (S) between different currencies for several years.
Crops
Land use types
Land units
Biocides
Fertilisers
Efficiencies
Currencies
a
For each type of data, it is indicated whether its value is generally applicable and can be considered as
fixed (F), whether its value should be established specifically (S) for each land use system, or whether its
value is a relative fraction (R) which allows a rapid analysis of the effects (e.g., fertiliser demand) of relative
changes in a factor compared with the standard value for a land use system (e.g., 20% more or less efficient
nutrient use).
are described in Sections 4.1–4.5. The technical coefficients, or system output as exported to Excel or ASCI files, are also described in Sections 4.1–4.5. Examples of
output are given in Sections 5.4.1,5.4.2,5.4.3,5.4.4.
T.C. Ponsioen et al. / Agricultural Systems 87 (2006) 80–100
85
The user-friendly interface of the calculation file consists of buttons and userforms required for database management and output analysis. The buttons and
user-forms give access to data stored in the database file and allow rapid selection
of specific combinations of LUTs, LUs and production techniques. After selection,
TechnoGIN performs the input and output calculations of the required land-use systems. Generated TCs of cropping systems are stored in the main file as matrices and
can be exported to separate files, to be used in IMGLP models for further analysis.
Various TCs can also be viewed in charts such as the monthly distribution of evapotranspiration, crop water requirements and labour requirements per LUT. Charts
are available showing different costs and economic returns of each generated cropping system facilitating cost-benefit analysis. The calculated nutrient dynamics of
cropping systems are presented in a flow chart showing at a glance the nutrient flows
between different components for each crop in a LUT.
3.2. Data requirements
Current data used in TechnoGIN are based on farm surveys, field experiments,
literature studies, and expert knowledge. TechnoGIN uses simple relationships to
calculate the use of biocides, labour, fuel, machines, draft animals and seeds from
these input data. Next, the corresponding economic costs are determined in cost-benefit calculations. These input data sets require information from typical farmers
reflecting the current practice in the defined cropping systems (current systems)
and from outstanding farmers using improved techniques in the same study area
or in similar circumstances (future-oriented systems). More information about these
systems that may differ in their productivity, resource-use efficiency and environmental impact are given in Section 3.3. Table 1 summarises the specific data requirements
for TechnoGIN, organised into different worksheets (e.g., crop, land unit and fertilisers). In this table, it is indicated which data can be considered universally applicable (e.g., nutrient concentrations per crop type) and which data should be specifically
determined for each land-use system. By using relative factors (Table 1), the technical coefficients for a system can be easily varied for analysing the sensitivity of the
land-use system and its output to changes in nutrient use efficiency, water use efficiency, and labour demand, for example. Note that as the data requirements of TechnoGIN are considerable, the system can also be applied if part of the data (e.g.,
water and/or biocide use) are not (yet) available. A Quickstart manual is available
for more information on minimum data requirements for TechnoGIN and its initial
application (see Availability of TechnoGIN and documentation).
3.3. Production techniques
TechnoGIN enables the definition of different production techniques such as current systems and prospective systems with high target yields and possibly increased
resource-use efficiencies (future-oriented systems). Some inputs are substitutable,
such as herbicides and manual labour for weed management, and the use of draft
animals and machines for field preparation. Production techniques may differ in
86
T.C. Ponsioen et al. / Agricultural Systems 87 (2006) 80–100
Table 2
Characteristics of three different production techniques
Characteristic
Target yields
Amount of fertilisers
Recovery fraction of applied fertiliser nutrients
Labour requirements for crop management
Labour requirements for other tasks
Machine and fuel use
Evapotranspiration
Biocide use
Production technique
A
B
C
Low
Current
Calculated
Current
Current
Current
Standard
Current
Low
Calculated
Standard
Increased
Current
Current
Standard
Current
High
Calculated
Increased
Increased
Decreased
Increased
Decreased
Reduced
the use efficiency of resources. For example, water-use efficiency depends on different
aspects of the applied irrigation technique, i.e., surface water or groundwater, sprinkler or furrow irrigation, irrigation intervals and timing (Bouman and Tuong, 2001).
Similarly, nutrient-use efficiency depends on the method of fertiliser application (e.g.,
single or split applications and/or balanced nutrient applications (Witt and Dobermann, 2002)).
As an example, qualitative characteristics of three production techniques are described in Table 2. Technique A represents the current mode of production. Technique B has the same yield level as technique A but the inputs (e.g., fertiliser use)
are calculated in a target-oriented way based on yield level. Production technique
C is also defined in a target-oriented way assuming a further improved system with
a higher target yield and an increased use efficiency of fertiliser nutrients and biocides.
This requires improved farm management and mechanisation of farm operations.
4. Calculations
The following calculation methods are described: nutrient balances (Section 4.1),
crop nutrient uptake (Section 4.2), water balance (Section 4.3), labour requirements
(Section 4.4), and cost-benefit analysis (Section 4.5). A complete overview of calculation methods is given in the documentation of TechnoGIN (Ponsioen et al., 2003).
4.1. Nutrient balances
N, P and K balances are calculated in kilogram hectareÀ1 for each crop in a LUT
(i.e., annual crop rotation). The incoming and outgoing nutrient flows and those between the different components of a LUS (inorganic nutrient pool, crop, animal and
organic nutrient pool) are illustrated in Fig. 2. Crop nutrient uptake (U) results
partly in removal of nutrients in harvested products (H) and partly in recycling of
nutrients in crop residues. These recycled nutrients largely come through the inorganic pool available to the crop in the next season. The efficiency of nutrient recycling depends on the type of applied crop residue management, which may be
T.C. Ponsioen et al. / Agricultural Systems 87 (2006) 80–100
87
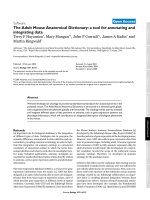
Fig. 2. Incoming and outgoing nutrient flows of a LUS and flows between different components of the
LUS. F, fertilisers; S, mineralisation from long-term soil supply; WD, wet deposition; FL, nitrogen
fixation by free-living organisms; SY, symbiotic nitrogen fixation; L, N and K leaching; D, denitrification;
V, N volatilisation; X, Irreversible P and K fixation; B, burning; A, removal of animal product; H,
harvesting; U, nutrient uptake by the crop; AD, ash deposition; M, mineralisation of crop residues and
manure.
burning resulting in ash deposition (AD), ploughing in of the residues, and animal
use for fodder resulting in manure application (M). For each land-use system, the
natural nutrient inputs from soil mineralisation (S), wet deposition (WD) and biological fixation (FL, SY) should be specified, which depend on location-specific conditions (soil, climate) and management.
Nutrient losses by leaching (L), denitrification (D), volatilisation (V) and fixation
(X) are calculated as fractions of fertiliser application (F), manure application (M)
and nutrient recycling. These loss fractions are established on the basis of field conditions (e.g., soil texture, anaerobic or aerobic) and may be based on results from
representative field trials. One minus the loss fractions results in the recovery fraction
(RF) of applied nutrients. The fertiliser requirement of future-oriented cropping systems (see end of Section 2) is calculated by balancing all flows in and out of the inorganic nutrient pool:
F¼
U À S À SY À WD À FL M ỵ AD
RF
1
1ị
4.2. Crop nutrient uptake
Crop nutrient uptake is calculated using the QUEFTS approach (Janssen et al.,
1990; Witt et al., 1999) for a specified target yield level. The QUEFTS approach used
in TechnoGIN calculates N, P and K uptake assuming a balanced nutrient supply
for the selected crop. The calculated uptake of N, P and K is bound by two borderlines describing the maximum dilution (D) and accumulation (A) of N, P and K in
the plant in relation to yield level (Fig. 3: YND and YNA, etc.). At low yield levels,
calculated N uptake is near the YND line and at high yield levels (near Ymax) N uptake is approaching the YNA line. The same applies for the other two nutrient elements. The two border lines are calculated from crop-specific minimum and
maximum N, P and K concentrations (Table 1).
88
T.C. Ponsioen et al. / Agricultural Systems 87 (2006) 80–100
Fig. 3. Two borderlines indicating maximum dilution (D) and accumulation (A) of N (left), P (centre) and
K (right) in the plant in relation to yield level. Lines apply to rice and are used in the QUEFTS approach
for calculating N, P and K uptake for a specified target grain yield. Maximum yield level for rice is
indicated by Ymax.
4.3. Water balance
Water requirements, calculated per dekad (WMO, 1992) using a simple water balance, are mainly determined by water losses minus water inflow. Water losses consist
of actual evapotranspiration (ET) and additional losses due to puddling and percolation only with rice cultivation. TechnoGIN calculates actual ET by multiplying a
crop coefficient and reference ET (Doorenbos and Pruitt, 1977). This reference ET is
calculated using the Penman–Monteith equations (Allen et al., 1998) and long-term
mean daily weather data. Crop coefficients are defined per crop per dekad over the
growing season.
Water balance calculations start after the dekad in which the smallest amount of
water is to be expected in the soil. Irrigation water requirements are calculated for
each dekad by subtracting ET and losses from water inflow (due to precipitation)
and amount of available water in the topsoil at the beginning of the dekad. A maximum amount is specified for available water in the rooted topsoil layer (e.g.,
AVAIL = 100 mm). Excess amounts of rainfall (after filling AVAIL up to maximum) are lost by percolation to deep soil layers.
4.4. Labour requirements
Labour requirements are defined for four types of operations: (1) land preparation, (2) crop establishment, (3) crop management, and (4) harvesting. For each crop
within a LUT, total crop duration and number of dekads needed for land preparation and harvesting are specified. The time needed for crop establishment is set at one
dekad and the rest of the total crop duration is reserved for crop management. Labour requirements are calculated per dekad by dividing the amount of labour needed
for each of the four operations evenly over the dekads in which they take place.
4.5. Cost-benefit calculations
Prices for different inputs such as labour, machinery and draft animal use, different types of fertilisers and different types of biocides are specified in the input data
T.C. Ponsioen et al. / Agricultural Systems 87 (2006) 80–100
89
files. The costs of the specified LUS can be calculated from these prices and the calculated input use. The price for each crop product is also specified in the input file.
Crop yields times corresponding prices give the economic benefits from the specified
LUS. These benefits minus total costs (including labour costs) give the net return and
the benefits minus the total non-labour costs give the gross return (Section 5.4.4).
5. Application to the case study Tam Duong district
5.1. Case study area description
Tam Duong district (Vinh Phuc province, North Vietnam) is located upstream in
the Red River Basin (21°18 0 –21°27 0 N, 105°36 0 –105°38 0 E), about 60 km northwest of
Hanoi. The district covers almost 20,000 ha of which half is mountainous with altitudes between 100 and 1400 m above sea level and the other half flat to hilly. Climate
is characterised by an annual rainfall between 1400 mm in the lower part and
2000 mm in the upper part of the district with more than 80% of the rainfall between
May and October (Fig. 4). Temperatures range between 15 and 21 °C in January,
and 26 and 33 °C in June to August.
There are three seasons in the Tam Duong cropping systems: the dry season between the end of January and May, the wet season between May and September, and
the autumn season between September and January. Rice, peanut, tomato, cucumber and eggplant are the most common crops in the dry season; the most common
choice in the wet season is rice. A wide variety of vegetables, i.e., cabbage, tomato,
cucumber, kohlrabi, chilli, soybean, peanut, maize, and sweet potato, are grown in
the autumn season.
The region is characterised by a large surplus of agricultural labour. With a population of 1,20,000, population density is very high (625 persons kmÀ2), and there
are few off-farm employment opportunities. Intensification of agricultural production has resulted in decreasing water quality. Hence, policy priorities in the Tam
Fig. 4. Monthly mean rainfall (mm) and monthly mean minimum and maximum temperatures (°C) at the
Vinh Yen station site (105°37 0 , 21°23 0 ) in Tam Duong (1992 and 2002).
90
T.C. Ponsioen et al. / Agricultural Systems 87 (2006) 80–100
Duong district are further intensification of agriculture, diversification from rice cultivation in order to provide employment to the large agricultural population, and
improvement of production techniques and management to reduce environmental
pollution.
5.2. Data collection
A farm survey was conducted, covering different types of farms in several parts
across the district. Data from this survey were used to quantify the inputs and outputs of current systems and for calibrating the calculations of fertiliser and water
requirements. Different maps (elevation, texture, annual rainfall, administrative)
were digitised and used in a GIS to determine the land units. Literature and expert
knowledge provided crop-specific data, which, combined with data from field trials
and very well managed farms, provided the information needed for defining futureoriented systems.
5.3. Validation
The quality of TechnoGIN output is strongly determined by the quality of the input data. For analyses of current systems, the input data have been based on verified
local information, i.e., farm surveys and field trials in Tam Duong district. For
exploring the potential of future-oriented cropping systems, input data have been
based on yield levels and inputs at Ôbest farmerÕs practiceÕ which were derived from
crop experiments under optimal field conditions and management, and from literature relating to Tam Duong district.
The main calculations in TechnoGIN are either balances which are completely
determined by the system input and data bases (Fig. 1), or they are distributions
of totals over the year. For example, the system output Ôwater requirementsÕ per
month is calculated from the actual evapotranspiration minus precipitation per
month and, hence, depends mainly on the input data ‘‘potential evapotranspiration’’
and ‘‘precipitation’’ for Tam Duong district and on crop coefficients (Section 4.3).
The system output labour demand per dekad depends on the input data ÔlabourÕ
specified per crop type for land preparation, crop establishment, crop management
and harvesting in Vietnam and crop growth period (Section 4.4). The costs and benefits from a specified crop rotation are determined by the required amounts of inputs
(e.g., labour, fertilisers) times their price level and the yields times the product prices
(Section 4.5), respectively. Hence, the validity of these outputs from TechnoGIN are
not determined by the model but only by the quality of the input data. However,
compiling a reliable input data set for analysing the main cropping systems in a region with TechnoGIN is not an easy task as most scientific information is mono-disciplinary and comprehensive data sets covering all aspects of cropping systems are
generally not available and have to be laboriously compiled.
TechnoGIN calculates nutrient balances and crop nutrient uptake with a submodel, the QUEFTS system. This sub-model has already been widely tested (Janssen
et al., 1990) and depends mainly on crop-specific data for minimum and maximum
91
T.C. Ponsioen et al. / Agricultural Systems 87 (2006) 80–100
nutrient concentrations that have been collected for main crop types. Nutrient cycling in soils, nutrient losses to deeper soil layers and air, depletion of the soil nutrient supply, and fertiliser nutrient demands for specified yields, cannot easily be
measured for a range of cropping systems and, hence, can only be established with
such a sub-model, and in particular for future-oriented systems. However, the validity of this approach is then crucial and should be tested against results of local fertiliser trials.
In the Red River Delta, site-specific nutrient management (SSNM) experiments
have been carried out for comparison with farmerÕs fertiliser practices (FFP) (Son
et al., 2004). These experiments have been done on both an alluvial soil (Phuc
Tho, about 100 km south of Tam Duong district and 25 km south of Hanoi) and
a degraded soil (Tam Dao in Tam Duong district). For testing the nutrient submodel in TechnoGIN for the Red River Delta, TechnoGIN has been applied for calculating the fertiliser nitrogen demands for both soil types in combination with both
fertiliser practices. For two years (1998, 1999) the mean yields of a double rice cropping system are given for both soil types in combination with both practices. Natural
nitrogen supply is also given for both soils, i.e., 75 and 52 kg N haÀ1 per rice crop in
the alluvial and the degraded soil, respectively (Son et al., 2004). TechnoGIN has
been calibrated for the alluvial soil by fitting the recovery fractions of applied fertiliser nitrogen to 35% and 56% for the FFP and SSNM trials, respectively. Next, the
calibrated model has been applied to calculate the fertiliser nitrogen demands for
double rice cropping on the degraded soil. The calculated fertiliser demand appears
to be 10% too high for the FFP trial (Table 3). A second calculation run with a
slightly increased natural nitrogen supply in the degraded soil (55 kg N haÀ1 per rice
crop) resulted in a better fit between observed and calculated fertiliser nitrogen demand. As natural nitrogen supply is generally not known with an accuracy less than
15% because of the generally large variation in soil characteristics within farmersÕ
fields, the accuracy of calculated fertiliser nutrient demands cannot be more precise
Table 3
Fertiliser nitrogen demands for double rice cropping systems on two land units in the Red River Delta,
Vietnam as observed in field experiments (mean over years 1998 and 1999) with two different fertiliser
practices (Son et al., 2004) and as calculated with TechnoGIN
Land unit, practicea
Grain yield
1st + 2nd
crop (ton haÀ1)
Fert.
N demand
observed (kg N haÀ1)
Fert. N demand
calculated Ib
(kg N haÀ1)
Fert. N demand
calculated IIc
( kg N haÀ1)
Alluvial soil, FFP
Alluvial soil, SSNM
Degraded soil, FFP
Degraded soil, SSNM
7.30 + 6.40
7.68 + 6.68
5.52 + 5.34
5.93 + 5.36
256
173
217
150
254
170
237
150
254
170
220
140
a
FFP, farmerÕs fertiliser practice; SSNM, site-specific nutrient management (see Dobermann et al.,
2004).
b
Natural nitrogen supply is set to 75 and 52 kg N haÀ1 per rice crop for alluvial soil in Phuc Tho and
degraded soil in Tam Dao, respectively (Son et al., 2004).
c
Natural nitrogen supply is set to 75 and 55 kg N haÀ1 per rice crop for alluvial soil in Phuc Tho and
degraded soil in Tam Dao, respectively.
92
T.C. Ponsioen et al. / Agricultural Systems 87 (2006) 80–100
than presented here with the nutrient sub-model of TechnoGIN (Table 3). This type
of uncertainty about soil characteristics under field conditions which, through their
use as input data, affect the TechnoGIN output, cannot easily be prevented.
5.4. Examples of land use systems
For illustrative purposes, three different LUTs, i.e., triple rice, peanut–rice–chilli,
and cucumber–rice–tomato, were selected. These are grown on the same land unit in
the low hills and use three different production techniques. For these systems, nitrogen flows (Section 5.4.1), water requirements (Section 5.4.2), labour requirements
(Section 5.4.3) and economic characteristics (Section 5.4.4), computed by TechnoGIN, are presented and discussed. The three production techniques A, B and C correspond with those described in Table 2 (Section 3.3). Technique A is a current
system with the present yield level and applications of fertiliser nutrients. In technique B, the labour requirement for crop management is increased by 50% as compared with technique A to improve crop management and fertiliser nutrient recovery
(e.g., reduced nutrient losses due to split nutrient application and more frequent
weeding). Technique C is much more advanced, being based on field trials and expert
expectations for the near future, and consists of (a) an increased target yield
(Table 4), (b) a 10% increase in recovery fractions of applied N, P and K, (c) a
50% reduction in the application of biocides (d) a 20% reduction in evapotranspiration (ET), (e) a 100% increase in labour requirements for crop management (f) a
100% increase in machinery use, and (g) a 20% decrease in labour requirements
for other tasks.
5.4.1. Nitrogen flows
Fig. 5 shows the N flows of the triple rice (a), peanut–rice–chilli (b), and cucumber–
rice–tomato (c) systems for the three production techniques. With the same yield
level, the triple rice system with production technique B shows considerably lower fertiliser requirements than the actual fertiliser applications of technique A. Technique B
constitutes an improvement in crop management (beginning of Section 5.4), and results in lower nutrient losses and hence in lower fertiliser requirements. The higher
yield under technique C results in a higher nitrogen uptake by the crops, and in higher
Table 4
Target yields (t haÀ1) of crops in three land use types in the Tam Duong district using three production
techniques A, B (both, current average) and C (future-oriented)
Land use type
Technique
Triple rice
A, B
C
Yield 1st crop
4.4
7.0
Yield 2nd crop
3.9
6.1
Yield 3rd crop
2.9
5.1
Peanut–rice–chilli
A, B
C
2.0
2.6
3.9
6.1
10.0
13.9
Cucumber–rice–tomato
A, B
C
24.5
30.0
3.9
6.1
10.8
15.0
T.C. Ponsioen et al. / Agricultural Systems 87 (2006) 80–100
93
Fig. 5. Nitrogen flows in the triple rice (a), peanut–rice–chilli (b), and cucumber–rice–tomato (c) systems
with three production techniques (A, B and C, see beginning of Section 5.4).
nitrogen losses and outflows. Hence, fertiliser nitrogen requirements are much higher,
despite the increased recovery fraction of applied fertiliser nutrients (beginning
of Section 5.4). Differences between cropping systems can be found in the type of
94
T.C. Ponsioen et al. / Agricultural Systems 87 (2006) 80–100
nitrogen loss. Under anaerobic circumstances (rice), nitrogen losses mainly occur by
volatilisation and under aerobic circumstances (peanut and maize), nitrogen losses by
leaching are more important, having a different impact on the environment. In the
cucumber–rice–tomato system (Fig. 5(c)), fertiliser nitrogen requirements are similar
for techniques A and C, although the target yield for technique C is much higher
(Table 4). This shows that improved crop management can reduce nitrogen losses
and increase yield without changing the level of material inputs.
5.4.2. Water requirements
Fig. 6 shows the monthly irrigation water requirements for the triple rice, peanut–
rice–chilli, and cucumber–rice–tomato systems for the three production techniques.
Techniques A and B are similar and technique C assumes a 20% higher water use
efficiency due to improvement in irrigation management (e.g., more precise and demand-driven timing of applications). Water requirements for the triple rice system
are high during the dry period in spring and, to a lesser extent, during the winter period. Technique C results in reduced water requirements compared with techniques A
and B, in particular in November when the wet season ends. With technique C, sufficient water is stored in the soil to allow ET in November without the need for additional irrigation water.
Water requirements of the peanut–rice–chilli and the cucumber–rice–tomato systems are much lower than those of the flooded triple rice systems. Irrigation water
can be saved in these systems by improved technique C but much more water can
be saved by replacing the triple rice system with these systems.
Fig. 6. Monthly water requirements for the triple rice, peanut–rice–chilli, and cucumber–rice–tomato
systems with three production techniques (with A and B similar, see beginning of Section 5.4).
T.C. Ponsioen et al. / Agricultural Systems 87 (2006) 80–100
95
Fig. 7. Monthly labour requirements for the triple rice, peanut–rice–chilli, and cucumber–rice–tomato
systems with production technique C.
5.4.3. Labour requirements
Fig. 7 shows the monthly labour requirements of the triple rice, peanut–
rice–chilli, and cucumber–rice–tomato systems for production technique C.
Labour requirements are high for the cucumber–rice–tomato system in January,
May–June and September, for peanut–rice–chilli in May–June, September and
December, and for triple rice in February, May–June and September. In a regional optimisation model, these peaks in labour demand for the different cropping
systems can be compared with the monthly available labour force to evaluate
whether the regional labour availability is restricting the maximum area cultivated
under any of these systems.
5.4.4. Cost-benefit analysis
Production costs were compared with the economic benefit for the three
cropping systems, using prevailing prices in Tam Duong. Results show that the
Fig. 8. Labour costs, other costs (including costs for seeds, fuel, machinery, draft animals, biocides,
fertilisers and irrigation), harvest benefits, net return (harvest benefits – other costs – labour costs) and
gross return (harvest benefits – other costs) per hectare.
96
T.C. Ponsioen et al. / Agricultural Systems 87 (2006) 80–100
peanut–rice–chilli system is most profitable (Fig. 8). However, prices of vegetables
are very volatile, i.e., for a given year price advantage of chilli as compared with
other vegetables may be much less favourable. Hence, the calculated difference in
gross returns is mainly to show the possibilities of TechnoGIN and should not be
taken too literally.
5.5. Application domains of TechnoGIN output
TechnoGIN output as described in detail in Section 5.4 can be used at various
scales and for various objectives. The main application domains are (a) resourceuse analysis at field level; (b) designing farming systems; (c) exploration of options
for future land use at the regional scale.
An example of the first application domain is described in detail in Section 5.4.
Such analyses allow the user to compare land-use systems with respect to fertiliser
demand, labour demand during particular peak periods, financial sustainability, risk
for environmental pollution, etc. This type of analyses can also be done to compare
present and future-oriented land-use systems, such as integrated nutrient management and/or integrated pest management. Information from these analyses can be
used to help set the research agenda, through the identification of options that are
promising but need further empirical testing and further study for optimising
land-use systems (Dogliotti et al., 2004).
In the second application domain, input–output relationships as produced by
TechnoGIN for land-use systems can be used in farm household models
(FHM). These models select land-use options from a range of alternatives generated with TechnoGIN while maximising farm income subject to boundary conditions and restrictions such as the availability of labour, capital, land, water, etc.
For example, a FHM was used for studying the performance of two household
types which differ in off-farm employment opportunities in Zhejiang province,
PR China (Hengsdijk et al., 2004). This showed that the economic performance
of farm households is dominated by their access to working capital through
off-farm employment, and that the introduction of vegetables in the cropping system leads to a strong increase in household income, but may increase income
inequalities among farm households and is detrimental for the environment. Such
FHM analyses can be used for designing farming systems which, in addition to
the first application domain of TechnoGIN, also take into account the socioeconomic conditions and constraints which farmers face.
In the third application domain, TechnoGIN output can be used in explorative
land-use studies at the regional scale (Bouman et al., 1999; Roetter et al., 2004).
In such studies, input–output relationships of land-use systems are used as building blocks in IMGLP models to explore options and trade-offs among policy
objectives that for reasons of scale are difficult to identify experimentally. Results
from these analyses can be used for discussions with the main stakeholders in
regional land use, and for interactive forms of land-use planning (Van Ittersum
et al., 2004).
T.C. Ponsioen et al. / Agricultural Systems 87 (2006) 80–100
97
6. Discussion and conclusion
TechnoGIN, the tool presented in this paper, allows the rapid quantification of
inputs and outputs of large numbers of current and future-oriented cropping systems
in a case study area. New features in TechnoGIN compared with other TCGs (De
Koning et al., 1995; Hengsdijk et al., 1996; Hengsdijk et al., 1999) include the annual
rotations of a maximum of three crops, which enable the calculation of nutrient and
water balances over the year taking into account the effects of crop production or a
fallow period in the preceding season. In addition, differences between crops that are
growing under aerobic or anaerobic circumstances are taken into account, as these
conditions can affect nutrient dynamics in land-use systems and nutrient emissions
considerably. Consequently, the nutrient dynamics in TechnoGIN are quite complex
and require a sound knowledge of plant and soil processes determining nutrient
flows to be able to assess the generated information. Another new feature of TechnoGIN is that the N, P and K uptake by the crop is calculated with the QUEFTS
approach (Janssen et al., 1990). Finally, different interfaces of TechnoGIN facilitate
easy operation and analysis of results. Though TechnoGIN has been developed for
East and Southeast Asia it can also be used in other parts of the world, as the data
structure is generic. Naturally, this requires calibration to new environments. TechnoGIN produces a lot of output data, which can easily be managed and interpreted
using the graphical output of TechnoGIN, and using statistics, geographic information systems, and optimisation models.
As in any model, the quality of TechnoGIN output is determined by the quality of
the input data. Input data should thus be based on well-established theoretical insight and verified local information (e.g., farm surveys, field trials). Generated output data need to be carefully evaluated on the basis of the various assumptions
made about the agricultural production systems in question. The rapid evaluation
of land-use systems with TechnoGIN is of great benefit in land-use studies that often
rely on secondary data and assumptions with a wide range of uncertainty (Hengsdijk
and Van Ittersum, 2001). TechnoGIN allows rapid identification of outliers and the
consequences of assumptions for input–output relationships of land-use systems. In
this way, TechnoGIN supports the identification of those data that hamper informed
and balanced decision-making with respect to resource-use problems.
Using TechnoGIN as a tool for land-use studies means changing and adding data,
parameters and assumptions, and evaluating the output against reference data and
expertise. TechnoGIN is designed to allow easy access to its data, parameters and
assumptions, and to rapidly generate and assess input–output relationships of
land-use systems in order to add new information and to make improvements. TechnoGIN is an important tool in the field of land-use analysis for the integration of
different types of data, enabling well-balanced decision-making with respect to resource use. TechnoGIN raises awareness concerning the assumptions incorporated
within it and thus also helps us to improve data collection and to set the research
agenda with respect to land-use processes for which knowledge is incomplete, and
is relevant for showing trade-offs between production, economic, and environmental
impacts of land-use systems.
98
T.C. Ponsioen et al. / Agricultural Systems 87 (2006) 80–100
7. Availability of TechnoGIN and documentation
The model, its documentation (Ponsioen et al., 2003) and a quickstart manual (for
first-time users) can be requested from Reimund Roătter, Alterra (reimund.
) or Joost Wolf, Alterra (), and can be downloaded
from the website of the IRMLA project: />docs/folder/irmla/irmla/default.htm
Acknowledgements
TechnoGIN was developed in the framework of the Integrated Resource Management and Land Use Analysis in East and Southeast Asia (IRMLA) project. This
project is funded by the European Union under the INCO-DEV program (Contract
no. ICA-CT-2001-10055) and DLO-IC, the research program International Cooperation of Wageningen University and Research Centre (Wagenignen UR), The
Netherlands. Herman van Keulen and Marrit van den Berg (Wageningen UR) are
acknowledged for their participation in the conceptual discussions and recommendations. The members of the different IRMLA project teams, and in particular Epifania Agustin (MMSU, Philippines), Wang Guanghuo (Zheijiang University, China)
and Nguyen Xuan Lai (CLRRI-ATTC, Vietnam), are acknowledged for their
contributions.
References
Allen, R.G., Pereira, L.S., Raes, D., 1998. Crop Evapotranspiration: Guidelines for Computing Crop
Water Requirements. FAO Irrigation and Drainage Papers. Food and Agriculture Organization of the
United Nations, Rome.
Barbier, B., 1998. Induced innovation and land degradation: results from a bioeconomic model of a village
in West Africa. Agricultural Economics 19, 15–25.
Bouman, B.A.M., Tuong, T.P., 2001. Field water management to save water and increase its productivity
in irrigated lowland rice. Agricultural Water Management 49, 11–30.
Bouman, B.A.M., Nieuwenhuyse, A., Hengsdijk, H., 1998. PASTOR: A technical coefficient generator for
pasture and livestock systems in the humid tropics, version 2.0. Quantitative Approaches in Systems
Analysis No. 18. AB-DLO/C.T. de Wit Graduate school for Production ecology, Wageningen, The
Netherlands.
Bouman, B.A.M., Jansen, H.G.P., Schipper, R.A., Nieuwenhuyse, A., Hengsdijk, H., Bouma, J., 1999. A
framework for integrated biophysical and economic land use analysis at different scales. Agriculture,
Ecosystems and Environment 75, 55–73.
De Koning, G.H.J., Van Keulen, H., Rabbinge, R., Janssen, H., 1995. Determination of input and output
coefficients of cropping systems in the European Community. Agricultural Systems 48, 485–502.
De Wit, C.T., Van Keulen, H., Seligman, N.G., Spharim, I., 1988. Application of interactive multiple goal
programming techniques for analysis and planning of regional agricultural development. Agricultural
Systems 26, 211–230.
Dobermann, A., Witt, C., Dawe, D., 2004. Increasing Productivity of Intensive Rice Systems through SiteSpecific Nutrient Management. IRRI, Los Ban˜os, Philippines.
T.C. Ponsioen et al. / Agricultural Systems 87 (2006) 80–100
99
Dogliotti, S., Rossing, W.A.H., Van Ittersum, M.K., 2004. Systematic design and evaluation of crop
rotations enhancing soil conservation, soil fertility and farm income: a case study for vegetable farms in
South Uruguay. Agricultural Systems 80, 277–302.
Doorenbos, J., Pruitt, W.O., 1977. Guidelines for Predicting Crop Water Requirements. FAO Irrigation
and Drainage Paper, 33, Rome, Italy.
Hengsdijk, H., Van Ittersum, M.K., 2001. Uncertainty in technical coefficients for future-oriented
land use studies: a case study for N-relationships in cropping systems. Ecological Modelling 144,
31–44.
Hengsdijk, H., Van Ittersum, M.K., 2002. A goal-oriented approach to identify and engineer land use
systems. Agricultural Systems 71, 231–247.
Hengsdijk, H., Quak, W., Bakker, E.J., Ketelaars, J.J.M.H., 1996. A Technical Coeffcient Generator for
Land Use Activities in the Koutiala Region of South Mali. AB-DLO/WAU DLV-Report No. 5.
Wageningen, The Netherlands.
Hengsdijk, H., Nieuwenhuyse, A., Bouman, B.A.M., 1998. LUCTOR: land use crop technical coefficient
generator; version 2.0. A model to quantify cropping systems in the Northern Atlantic zone of Costa
Rica. Quantitative Approaches in Systems Analysis No. 17. AB-DLO/C.T. de Wit Graduate school for
Production ecology, Wageningen, The Netherlands.
Hengsdijk, H., Bouman, B.A.M., Nieuwenhuyse, A., Jansen, H.G.P., 1999. Quantification of land use
systems using technical coefficient generators: a case study for the Northern Atlantic zone of Costa
Rica. Agricultural Systems 61, 109–121.
Hengsdijk, H., Van den Berg, M., Roetter, R., Wolf, J., Guanghuo, W., Lai, N.X., Cuong,
N.T., Van Keulen, H., 2004. Consequences of technologies and production diversification for
the economic and environmental performance of rice-based farming systems in East and
South-east Asia. Paper for the World Rice Conference 4–7 November 2004 in Tokyo and
Tsukuba, Japan.
Hoanh, C.T., Roetter, R.P., 1998. Towards decision support systems for land use planning. In: A Systems
Approach to Analyzing Land Use Options for Sustainable Rural Development in South and Southeast
Asia. IRRI Discussion Paper Series No. 28, SysNet Special Project Report, International Rice
Research Institute, Manila.
Janssen, B.H., Guiking, F.C.T., Van der Eijk, D., Smaling, E.M.A., Wolf, J., Van Reuler, H., 1990. A
system for quantitative evaluation of the fertility of tropical soils (QUEFTS). Geoderma 46, 299–
318.
Lu, C.H., Van Ittersum, M.K., Rabbinge, R., 2004. A scenario exploration of strategic land use options
for the Loess Plateau in northern China. Agricultural Systems 79, 145–170.
Ponsioen, T.C., Laborte, A.G., Roătter, R.P., Hengsdijk, H., Wolf, J., 2003. TechnoGIN-3: a technical
coefficient generator for cropping systems in East and Southeast Asia. Quantitative Approaches to
Systems Analysis No. 26. Wageningen, The Netherlands.
Roetter, R.P., Hoanh, C.T., Laborte, A.G., Van Keulen, H., Van Ittersum, M.K., Dreiser, C., Van
Diepen, C.A., De Ridder, N., Van Laar, H.H., 2005. Integration of Systems Network (SysNet)
tools for regional land use scenario analysis in Asia. Environmental Modelling and Software 20,
291–307.
Son, T.T., Chien, N.V., Thoa, V.T.K., Dobermann, A., Witt, C., 2004. Site-specific nutrient management
in irrigated rice systems of the Red River Delta of Vietnam. In: Dobermann, A., Witt, C., Dawe, D.
(Eds.), Increasing Productivity of Intensive Rice Systems through Site-Specific Nutrient Management.
IRRI, Los Ban˜os, Philippines, pp. 217–242.
Van Ittersum, M.K., Rabbinge, R., 1997. Concepts in production ecology for analysis and quantification
of agricultural input–output combinations. Field Crops Research 52, 197–208.
Van Ittersum, M.K., Roetter, R.P., Van Keulen, H., De Ridder, N., Hoanh, C.T., Laborte, A.G.,
Aggarwal, P.K., Ismail, A.B., Tawang, A., 2004. A systems network (SysNet) approach for
interactively evaluating strategic land use options at sub-national scale in South and South-east Asia.
Land Use Policy 21, 101–113.
Van Latesteijn, H.C., 1995. Assessment of future options for land use in the European Community.
Ecological Engineering 4, 211–222.
100
T.C. Ponsioen et al. / Agricultural Systems 87 (2006) 80–100
Witt, C., Dobermann, A., 2002. A site-specific nutrient management approach for irrigated, lowland rice
in Asia. Better Crops International 16, 20–24.
Witt, C., Dobermann, A., Abdulrachman, S., Gines, H.C., Wang, Guanghuo, Nagarajan, R.,
Satawatananont, S., Tran, Thuc Son, Pham, Sy Tan, Le, Van Tiem, Simbahan, G.C., Olk, D.C.,
1999. Internal nutrient efficiencies of irrigated lowland rice in tropical and subtropical Asia. Field
Crops Research 63, 113–138.
WMO (World Meteorological Organization), 1992. International Meteorological Vocabulary. 2nd ed.
Geneva. Publication No. 182.