How Modern Systems Engineering can reduce Congestion, Dependence on Oil, and Global Warming by introducing a New Form of Public Transportation
Bạn đang xem bản rút gọn của tài liệu. Xem và tải ngay bản đầy đủ của tài liệu tại đây (1.03 MB, 23 trang )
How Modern Systems Engineering
can reduce
Congestion,
Dependence on Oil, and
Global Warming
by introducing
a New Form of Public
Transportation
J. Edward Anderson, Ph.D., P. E.
Rocket Scientist
Professor of Mechanical Engineering
University of Minnesota
Boston University
Managing Director & Director of Engineering
PRT International, LLC
Minneapolis, Minnesota, USA
November 2006
Contents
Page
1
Introduction
3
2
The Problems to be Addressed
4
3
Rethinking Transit from Fundamentals
4
4
Derivation of the New System
5
5
Off-Line Stations are the Key Breakthrough
6
6
The Attributes of High-Capacity Personal Rapid Transit
7
7
The Optimum Configuration
7
8
Is High Capacity possible with Small Vehicles?
9
9
System Features needed to achieve Maximum Throughput Reliably and Safely
9
10
How does a Person use a PRT System?
11
11
Will PRT attract Riders?
12
12
Status
12
13
Economics of PRT
15
14
Land Savings
16
15
Energy Savings
17
16
Benefits for the Riding Public
18
17
Benefits for the Community
18
18
Reconsider the Problems
19
19
Significant PRT Activity
19
20
Development Strategy
19
References
20
Credits for Figures
21
Biography of the Author
22
2
How Modern Systems Engineering can reduce Congestion,
Dependence on Oil, and Global Warming
by introducing a New Form of Public Transportation
J. Edward Anderson, PhD, P. E.
Managing Director and Director of Engineering
PRT International, LLC
Minneapolis, Minnesota 55421 USA
1. Introduction
In their book The Urban Transport Crisis in Europe and North America, John Pucher and
Christian Lefèvre, discussing only conventional transportation, concluded with the grim
assessment: “The future looks bleak both for urban transport and for our cities: more traffic jams,
more pollution, and reduced accessibility.”
In the report Mobility 2030: Meeting the Challenges to Sustainability, 2004 by the World
Business Council for Sustainable Development (www.wbcsd.org), which was indorsed by the
leaders of major auto and oil companies, the authors site grim projections of future conditions
but no real hope for solutions.
C. Kenneth Orski, in his Innovation Briefs for Nov/Dec 2006 reports on Allan Pisarski’s
report Commuting in America, Transportation Research Board, 2006, which concludes that
“driving alone to work continues to increase,” “carpooling share declined by 7.5% since 1980,”
transit currently accounts for 4.6% of the trips, and “walking to work has suffered a sharp decline
. . .a reality check for those who claim to see a trend toward ‘walkable communities.’ ” Orksi
goes on to report that “Not only is population dispersing, it is dispersing farther and farther out,
leapfrogging over existing suburbs.”
In spring 1989 I was informed that
during a luncheon attended by a Northeastern
Illinois Regional Transportation Authority
(RTA) Chairman it was agreed that “We
cannot solve the problems of transportation in
the Chicago Area with just more highways and
more conventional rail systems. There must
be a rocket scientist out there somewhere with
a new idea!” The Illinois Legislative Act that
established the RTA had given the new agency
an obligation to “encourage experimentation
in developing new public transportation
technology.”
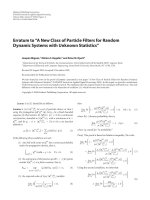
Figure 1. High-Capacity PRT
3
The new idea they needed was and is High-Capacity Personal Rapid Transit (PRT), a
version of which is illustrated in Figure 1. A March 2006 European Union Report concludes:
“The overall assessment shows vast EU potential of the innovative PRT transport concept” [1].
In April 1990 the RTA issued a request for proposals for a pair of $1.5 million Phase I
PRT design studies. Two firms were selected and after the studies were completed the RTA
selected one of the designs, similar to that shown in Figure 1, for a $40 million Phase II PRT
design and test program. Unfortunately, that program was not directly successful, not due to any
flaw in the basic concept of High-Capacity PRT, but to institutional factors. There is more and
more evidence that HCPRT is an important answer to many urban problems.
In early 2006, the Advanced Transit Association (www.advancedtransit.org) released a
paper “The Case for Personal Rapid Transit (PRT),” which states “In the face of failing
metropolitan transportation strategies, the need for fresh thinking is clearly evident and urgent.”
2. The Problems to be Addressed
•
•
•
•
•
•
•
•
•
•
•
•
Increasing congestion
Dependence on oil
Global warming
Excessive land use for roads and parking
Excessive energy use in transportation
Many people killed or injured in auto accidents
Overwhelming dominance of the auto
People who can’t or should not drive
Road rage
Terrorism
Excessive sprawl
Large transit subsidies
3. Rethinking Transit from Fundamentals!
To address these problems, a new transit system must be
•
•
•
•
•
•
•
•
•
•
•
•
•
Operational with renewable energy sources
Low enough in cost to recover all costs from fares and other revenue
Low in air and noise pollution
Independent of oil
Adequate in capacity
Low in material use
Low in energy use
Low in land use
Operational in all kinds of weather, except for extremely high winds
Safe
Reliable
Comfortable
Time competitive with urban auto trips
4
•
•
•
•
•
Expandable without limit
Able to attract many riders
Available at all times to everyone
An unattractive target for terrorist attacks
Compliant with the Americans with Disabilities Act
4. Derivation of the New System
It will not be possible to reduce congestion, decrease travel time, or reduce accidents by
placing one more system on the streets – the new system must be either elevated or underground.
Underground construction is extremely expensive,
so the dominant emphasis must be on elevation.
This was understood over 100 years ago in the
construction of exclusive-guideway rail systems
in Boston, New York, Philadelphia, Cleveland,
and Chicago. The problem was the size and cost
of the elevated structures. We have found that if,
as shown in Figure 2, the units of capacity are
distributed in many small units, practical now
with automatic control, rather than a few large
ones, and by taking advantage of light-weight
construction practical today, we can reduce the
weight per unit length of guideway by a factor of
at least 20:1! This enormous difference is worth pursuing.
Figure 2. Guideway Weight and
Size.
Offhand it is common to assume that there
must be an economy of scale, i.e. the cost of large
vehicles per unit of capacity must be lower than
the corresponding cost for small vehicles.
Examination of the data in Figure 3 show,
however, that this is not so. Each point in Figure
3 represents a transit system. The two upper
points correspond to systems developed by the U.
S. federal government in the early 1970s when
cost minimization was not a design criterion. For
the rest of the systems shown, a line of best fit is
close to horizontal, i.e., vehicle cost per unit of
capacity is independent of capacity.
Figure 3. Vehicle Cost per Unit
Capacity
With this finding in mind consider the cost of a fleet of transit vehicles. The cost of the
fleet is the cost per unit of capacity multiplied by the capacity needed to move a given number of
people per unit of time. The major factor that determines the capacity needed is the average
speed. If the average speed could be doubled, the number of vehicles required to move a given
5
number of people would be cut in half. The greatest increase in average speed without
increasing other costs is obtained by arranging the system so that every trip is nonstop. The trips
can be nonstop if all of the stations are on bypass guideways off the main line as shown in
Figures 1, 4.
5. Off-Line Stations are the Key Breakthrough!
• As just mentioned, because of increased average speed, off-line stations minimize the
fleet size and hence the fleet cost.
• Off-line stations permit high throughput with small vehicles. To see how this can be
so, consider driving down a freeway lane. Imagine yourself stopping in the lane,
letting one person out and then another in. How far behind would the next vehicle
have to be to make this safe? The answer is minutes behind. Surface-level streetcars
operate typically 6 to 10 minutes apart, and exclusive guideway rail systems may
operate trains as close as two
minutes
apart,
whereas
on
freeways cars travel seconds apart,
and often less than a second apart.
An example is given in Section 8.
• Off-line stations make the use of
small vehicles practical, which
permit small guideways, which
minimize both guideway cost and
visual impact.
• Off-line stations permit nonstop
trips, which decrease trip time and
increase the comfort of the trip.
Figure 4. An Off-Line Station
• Off-line stations permit a person to travel either alone or with friends with minimum
delay.
• Off-line stations permit the vehicles to wait at stations when they are not in use
instead of having to be in continuous motion as is the case with conventional transit.
Thus, it is not necessary to stop operation at night – service will be available at any
time of day or night.
• There is no waiting at all in off-peak hours, and during the busiest periods vehicles
are automatically moved to stations of need. Computer simulations show that the
peak-period wait time will average only a few minutes.
• Stations can be placed closer together than is practical with conventional rail. With
conventional rail, in which the trains stop at every station, the closer the station
spacing, the slower the average speed. So to get more people to ride the system, the
stations are placed farther apart to increase average speed, but then ridership suffers
because access is sacrificed. The tradeoff is between speed and access – getting more
of one reduces the other. With off-line stations one has both high average speed and
good access to the community.
• Off-line stations can be sized to demand, whereas in conventional rail all stations
must be as long as the longest train.
• All of these benefits of off-line stations lead to lower cost and higher ridership.
6
6. The Attributes of High-Capacity PRT
A system that will meet the criteria of Section 3 will have
•
•
•
•
•
•
•
•
•
•
•
•
•
•
•
•
•
•
Off-line stations
Adequate speed, which can vary with the application and the location in a network
Fully automatic control
Hierarchical, modular, asynchronous control to permit indefinite system expansion
Dual-redundant computers for high dependability and safety
Smooth, accurate running surfaces for a comfortable ride
All-weather propulsion and braking by use of linear electric motors
Switching with no moving track parts to permit no-transfer travel in networks
Minimum-sized, minimum weight vehicles
Small, light-weight, generally elevated guideways
Guideway support-post separations of 90 ft (27 m).
Vehicle movement only when trips are requested
Nonstop trips with known companions or alone
Propulsive power from dual wayside sources
Empty vehicles rerouted automatically to fill stations
Well lit, television-surveyed stations
Planned & unplanned maintenance within the system
Full compliance with the Americans with Disabilities Act
7. The Optimum Configuration
During the 1970s I accumulated a list
of 28 criteria for design of a PRT guideway
[2]. As chairman of three international
conferences on PRT, I was privileged to visit
all automated transit work around the world,
talk to the developers, and observe over time
both the good and the bad features. The
criteria listed in Figure 5 are the most
important. From structural analysis I found
that the minimum-weight guideway, taking
into account 150-mph crosswinds and a
maximum vertical load of fully loaded
vehicles nose-to-tail, is a little narrower than it is deep.
Configuration
Figure 5.
The Optimum
Such a guideway has minimum visual impact. A minimum weight elevated structure is a
truss, as shown in Figure 6. A stiff, light-weight truss structure will have the highest natural
7
frequency and will be most resistant to the horizontal accelerations that result from an
earthquake. Extensive computer analysis of the structure has produced the required properties.
I compared hanging, side-mounted, and top-mounted vehicles and found ten reasons to
prefer top-mounted vehicles. Considering the Americans with Disabilities Act, the vehicle had to
be wide enough so that a wheelchair could enter and face forward. Such a vehicle is wide
enough for three adults to sit side-by-side and for a pair of fold-down seats in front for small
people. Such a size can also accommodate a person and a bicycle, a large amount of luggage
with two people, a baby carriage plus two adults, etc. [3]
As shown in Figures 5 and 7, the
guideway will be enclosed with composite
covers, with a slot only four inches wide at the
top to permit the vertical chassis to pass, and a
slot eight inches wide at the bottom to permit
snow, ice, or debris to fall through. The
covers permit the system to operate in all
weather conditions, they minimize air drag,
they prevent ice accumulation on the power
rails, they prevent differential thermal
expansion, they serve as an electromagnetic
shield, a noise shield, and a sun shield, they
permit access for maintenance, and they
permit the external appearance to be whatever the local community Figure 6. A Low Weight,
Low-Cost Guideway
wishes. The covers enable the system to meet
nine of the 28 design criteria. Figure 8 shows an application of PRT in Minneapolis, which was
laid out and has been promoted by a Minneapolis City Councilman. Such an application
provides a degree of service for all people, including the elderly and disabled, not possible with
conventional transit, and can be built and operated without public subsidy.
Figure 7. The Covered Guideway
Figure 8. An Application in Minneapolis
8
8. Is High Capacity Possible with Small Vehicles?
Consider a surface-level streetcar or light rail system. A typical schedule frequency is 6
minutes. The new so-called “light” rail cars have a capacity of about 200 people. So with twocar trains the system can move a maximum of 400 people every 6 minutes. As shown below, a
high-capacity PRT system can operate with a maximum of 120 vehicles per minute or 720 in 6
minutes carrying up to five people per vehicle. However, if there was only one person per
vehicle, the HCPRT system would carry 720 people in 6 minutes, which is almost twice as many
people per hour as light rail can carry. Since the light rail cars are never full for a whole hour,
HCPRT has an even higher throughput margin over a light-rail system. A comprehensive
discussion of the throughput potential of HCPRT lines and stations has been developed [4].
In 1973 Urban Mass Transportation Administrator Frank Herringer told Congress that “a
high-capacity PRT could carry as many passengers as a rapid rail system for about one quarter
the capital cost” [5] (see next page). The effect of this pronouncement was to ridicule and kill a
budding federal HCPRT program. The best that can be said is that PRT was thought to be too
good to be true. But PRT was not an idea that would die. Work continued at a low level, which
is the main reason it has taken so long for PRT to mature.
During the 1990’s the Automated Highway consortium operated four 16-ft-long Buick
LeSabres at a nose-to-tail separation of six feet at 60 mph on a freeway near San Diego. The
nose-to-nose separation was 22 feet and 60 mph is 88 ft per sec, which gives a time headway or
nose-to-nose time spacing of 22/88 or a quarter second. Four vehicles per second is twice the
throughput needed for a large HCPRT system. The automated highway program was monitored
by the National Highway Safety Board.
9. System Features needed to achieve Maximum Throughput Reliably and Safely
The features needed are illustrated in Figure 9.
1. All weather operation: Linear induction motors (LIMs) provide all-weather acceleration
and braking independent of the slipperiness of the running surface.
2. Fast reaction time: For LIMs the
reaction time is a few milliseconds.
With human drivers the reaction time
is between 0.3 and 1.7 seconds.
3. Fast braking: Even with automatic
operation the best that can be done
with mechanical brakes is a braking
time of about 0.5 sec, whereas LIMs
brake in a few milliseconds.
4. Vehicle length: A typical auto is 15 to
16 feet long. A HCPRT vehicle is only
nine feet long.
These features together result in safe
Figure 9. How to achieve safe maximum flow.
9
operation at fractional-second headways, and thus maximum throughput of at least three freeway
lanes [6], i.e., 6000 vehicles per hour.
10
During the Phase I PRT Design Study for Chicago, extensive failure modes and effects
analysis [7], hazards analysis, fault-tree analysis, and evacuation-and-rescue analysis were done
to assure the team that operation of HCPRT would be safe and reliable. The resulting design has
a minimum of moving parts, a switch with no moving track parts, and uses dual redundant
computers [8]. Combined with redundant power sources, fault-tolerant software, and exclusive
guideways; studies show that there will be no more than about one person-hour of delay in ten
thousand hours of operation [9].
10. How does a Person Use a PRT System?
Figure 10. Pick a Destination and Pay the Fare
Figure 11. Transfer Destination to Vehicle
A patron arriving at a PRT station finds a map of the system in a convenient location with
a console below. The patron has purchased a card similar to a long-distance telephone card,
slides it into a slot, and selects a destination either by touching the station on the map or
punching its number into the console. The memory of the destination is then transferred to the
prepaid card and the fare is subtracted. To encourage group riding, we recommend that the fare
be charged per vehicle rather than per person. The patron (an individual or a small group) then
takes the card to a stanchion in front of the forward-most empty vehicle and slides it into a slot,
or waves it in front of an electronic reader.
This action causes the memory of the
destination to be transferred to the chosen
vehicle’s computer and opens the motordriven door. Thus no turnstile is needed. The
individual or group then enter the vehicle, sit
down, and press a “Go” button. As shown in
Figure 12, the vehicle is then on its way
nonstop to the selected destination. In addition
to the “Go” button, there will be a “Stop”
button that will stop the vehicle at the next
station, and an “Emergency” button that will
alert a human operator to inquire. If, for
11
example, the person feels sick, the operator can reroute the
Nonstop to the Destination
vehicle to the nearest hospital.
11. Will PRT attract riders?
Figure 12. Riding
• With a network PRT system there will be only a short walk to the nearest station.
• In the peak period, the wait time will typically be no more than a minute or two. In the
off-peak periods there will be no wait at all.
• The system will be available any time of day or night.
• The ride time will be short and the trip time predictable.
• A person can ride either alone or with chosen companions.
• Everyone will have a seat.
• The ride above the city will be relaxing, comfortable, and enjoyable.
• There will be no transfers.
• The fare will be competitive.
• There will be only a short walk to the destination.
A number of investigators, some of whom are mentioned in Reference 2, have developed
models to predict ridership on PRT systems, which show ridership in the range of 25 to 50%.
The U.S. average transit ridership is currently 4.6% [10]. Accurate methods are needed because
the system needs to be designed but not over-designed to meet anticipated ridership. People will
ride PRT voluntarily rather than because of coercion.
12. Status
At the present time, fall 2006, all of the technology needed to build HCPRT, including all
of the control hardware and software, has been developed. All that is needed in the United States
is the funds (about $15 million) to build a full-scale test system. Such programs are already
underway overseas. HCPRT is a collection of components proven in other industries. The only
new thing is the system arrangement. The system control software has been written and
excellent software tools are available from many sources for final design verification and
development of final drawings needed for construction. But, because there has been no U. S.
federal funding to support the development of HCPRT during the past three decades, few people
in the United States have been able to continue to study and develop these systems. This
problem is likely the major factor that caused the collapse of the Chicago RTA PRT program.
12
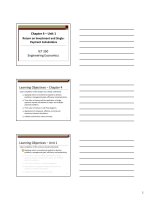
Figure 13. The Aerospace Corporation PRT System [11]
Figure 14. Cabintaxi [12]
The two leading HCPRT development programs during the 1970s are illustrated in
Figures 13 and 14. The Aerospace program ended in the mid 1970s because of the lack of
federal funding, and the Cabintaxi program (DEMAG+MBB) ended in 1980 when the Federal
Republic of Germany had to divert a substantial amount of money to NATO programs. These
HCPRT programs provided the bulk of the background that was needed to continue PRT
development during the next two decades. Without these programs, I don’t believe we would be
talking about PRT in any form today. The world owes them thanks for their pioneering efforts.
A
third
important
PRT-related
development program conducted during the
1970s still operates in Morgantown, West
Virginia. I call it “PRT-related” because it has
characteristics of PRT but uses 20-passenger
vehicles, and thus is more correctly classified as
Group Rapid Transit. Contracts were let in
December 1970 to get the system operating only
22 months later. Since there was almost no
knowledge of the theory of PRT systems in 1970,
many decisions were made that increased size,
weight and cost. The gross (fully loaded) vehicle
weight is about 11,800 lb and the operating headway is 15 seconds.
Morgantown
Figure
15.
In Section 1, I mentioned work of the Northeastern Illinois Regional Transportation
Authority (RTA). It led, beginning in 1993, to a public/private partnership between the RTA and
Raytheon Company. The next figure, Figure 16, shows the Raytheon system that was developed.
As a result of cost overruns, this program died, mercifully in my opinion, because the lack of
13
experience on the part of the development teams resulted in a vehicle four times the weight and a
guideway twice as wide and twice as deep as that which came out of the RTA’s Phase I PRT
Design Study. As a result the capital cost of a system proposed for Rosemont, Illinois, more than
tripled and the operating costs were correspondingly high and uncertain. The gross weight of the
Raytheon system was about 6600 lb and the operating headway was about 3 seconds.
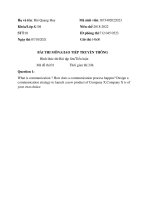
Figure 16. Raytheon PRT 2000
Figure 17. An Optimum HCPRT Design
Finally, consider the system shown in Figure 17. I designed it in 2001-2 for Taxi 2000
Corporation [14]. It opened to the public in April 2003 and over the next year thousands of rides
were given flawlessly to an enthusiastic public over a short piece of guideway. The fully loaded
vehicles have a maximum gross weight of about 1800 lb and I designed the control system so
that multiple vehicles can operate at half-second headways. This system, as we understood it in
1989, was the basis for the winning proposal in the RTA program. Unfortunately, when the
Phase II program got underway in October 1993, prior work, including work done in the Phase I
program, was mostly ignored, which resulted in major weight and cost overruns and program
cancellation.
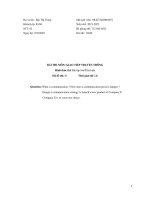
Gross Weight of P eople M overs, lb
Figure 18 shows the gross weights of the
systems shown in Figures 15, 16, and 17. Cost
data were available on the cost per mile of each of
these systems. Deflating these costs to the same
year I found that the system cost was very nearly
proportional to the vehicle weight. The challenge
is to keep costs down by using the smallest,
lightest-weight vehicles practical. They permit
the smallest, lowest-cost guideways and are fully
practical with today’s technology.
Figure 18. Vehicle weight comparison.
Figure 19 shows three
development. The picture on
(www.atsltd.co.uk), which is
University in the United
14
14000
12000
10000
8000
6000
4000
2000
0
Morgantown
Raytheon
Optimum P RT
PRT systems currently under
the left
is
ULTra,
being developed at Bristol
Kingdom. The great news in
fall 2005 was that the British Airport Authority announced that they will build the ULTra system
at Heathrow International Airport. This system is restricted to relatively small, low-speed
applications in areas with very little ice and snow. The center system is Vectus, which is being
developed by the Korean steel company Posco (www.vectusprt.com). They are building a test
system in Uppsala, Sweden. This system uses LIMs in the guideway, which increases guideway
weight and cost. The picture on the right is Microrail (www.megarail.com). It is one of a family
of automated guideway transit systems under development by Magarail Corporation of Ft.
Worth, Texas. Currently they advertise a trained version under manual control.
Figure 19.
ULTra, Vectus, and Megarail
PRT Systems
13. Economics of PRT
Figure 20 show the
Minneapolis light rail system
called the “Hiawatha Line.” The newspapers announced that its capital cost was $720,000,000
and that the ridership would be about 20,000 rides per day. That works out to $36,000 per daily
trip. Since the annual cost for capital amortization and operation is about 10% of the capital cost
and the yearly ridership will be roughly 300 times the daily ridership, the annual cost divided by
the annual ridership is about $12 per trip. The average trip length is roughly 6 miles, so the cost
per passenger-mile is about $2. This compares with the total cost per mile of an automobile of
around 40 to 60 cents.
HC PR T SYSTEM C OST per PASSEN GER -MILE
Figure 20. Minneapolis-Airport
light rail
Figure
21.
Cost Comparison
3.0
2.8
2.6
2.4
$ per passenger-mile
We laid out and estimated the
cost of a PRT system for downtown
Square grid, 0.5-mi line spacing, average trip length 5 mi
4 trips per person per day, 340 yearly trips per daily trip
Capital cost $12M per mile, annual cost 10% of capital cost
Revenue from passengers, freight, and advertising
2.2
2.0
Mode
Mode
Mode
Mode
1.8
1.6
Split
Split
Split
Split
=
=
=
=
0.1
0.3
0.5
0.7
1.4
1.2
1.0
0.8
0.6
0.4
15
0.2
0.0
2000
3000
4000
5000
6000
7000
8000
Po p ulatio n Den sity, p eop le p er sq uare mile
9000
10000
Minneapolis. It is compared with the Hiawatha light-rail line in Figure 21. Our estimate was
about $100 million capital cost and a professional ridership study showed about 73,000 trips per
day. Because this system has not yet been built, let’s double its cost. Then on the same basis the
capital cost per daily trip would be $2740 and the total cost for each trip would be $0.91. On this
PRT system the average trip would be about two miles so the cost per passenger-mile or breakeven fare would be about $0.46 – about one fourth that of conventional light rail.
What would be the cost per passenger-mile on a built-out PRT system? Figure 22 shows
the cost per passenger-mile on a square-grid PRT system as a function of population density for
values of the fraction of all vehicle trips taken by PRT, called the mode split, from 0.1 to 0.7.
Several studies cited in Reference 2 suggest that an area-wide PRT system with lines a half mile
Figure 22. System cost per passenger-mile.
apart would attract at least 30% of the trips. On this basis, one can estimate from Figure 22 the
population density and mode split needed for a PRT system to break even. As mentioned in
Figure 22, revenue will be obtained not only from passenger trips, but from goods movement and
advertising as well – roughly half is a reasonable estimate, meaning that a passenger would have
to pay only half the amount determined from Figure 22. For example if the population density is
6000 persons per square mile (Chicago density is about 13,000 people per square mile) and the
mode split to PRT is 30%, the total cost per passenger-mile is about 40 cents, of which the breakeven cost for the passengers would be about 20 cents.
14. Land Savings
Figure 23. A Freeway Running at Capacity.
Figure 24. The People riding.
Figure 23 shows a freeway running on the left side at capacity, which is about 6000 cars
per hour [14]. This is a three-lane freeway with the fourth lane just an acceleration lane. Figure
24 shows the people riding. In over 90% of the autos there is only one person, occasionally two,
and very occasionally three. (In a 1990 study, the Twin Cities Metropolitan Council found that
the average rush-hour auto occupancy was 1.08 and the average daily occupancy was 1.2.)
Figure 25 shows all of the people moved to the center and Figure 26 shows the PRT vehicles in
which they could be riding. This pair of guideways can also carry 6000 vehicles per hour – the
16
throughput of the entire three-lane freeway. We would normally put these guideways along the
fence lines so that the stations would be near people’s destinations, but the figure illustrates the
land savings. A typical freeway width from fence line to fence line is about 300 feet. The two
PRT lines in the middle of Figure 26 take up only 15 feet of width, giving a width reduction per
unit of capacity of 20:1 or 5% of the land area. But, land for a PRT system is required only for
posts and stations, which is only 0.02% of city land. The land underneath the PRT guideways
can be used for walking or bicycle trails and would not interfere with pedestrian, vehicle, or
animal crossings. The auto requires about 30% of the land in residential areas and roughly 50%
to 70% of the land in downtown areas. This enormous land savings permits development of safe,
low-pollution, energy-efficient, quiet, environmentally friendly, high-density living.
Figure 25. The people moved to center.
Figure 26. All riding PRT.
Figure 27 illustrates the tiny fraction of
land required by a PRT system, which can
carry substantially more people per hour than
the arterial streets shown. An area formerly
cleared for surface parking could be restored
into a park or garden, thus making the inner
city more people-friendly and reducing the
summer temperature because concrete and
asphalt absorb sunlight and immediately
release it as heat, whereas plants soak up solar
energy in plant growth. As they grow, plants
remove carbon dioxide from the air.
Figure 27. A restored park thanks to
PRT.
15. Energy Savings
17
Minimum energy use requires very light-weight vehicles; smooth, stiff tires for low road
resistance; streamlining for low air drag; and efficient propulsion, all of which can be designed
into a PRT system if the designer wishes to do so. Moreover, unlike conventional transit, in
which the cars must run to provide service whether or not anyone is riding, PRT cars need run
only when people wish to travel. Studies have shown that this on-demand service reduces the
number of vehicle-miles per day of operation needed to move a given number of people by more
than a factor of two, which lowers the energy use and operating cost in proportion [15].
Figure 28 gives a comparison of the energy use per passenger-mile of eight modes of
urban transportation – heavy rail, light rail, trolley bus, motor bus, van pool, dial-a-bus, auto, and
PRT [16]. Data for the first seven modes are the averages from federal sources. The energy use
for kinetic energy, road resistance, air drag, heating-ventilating-air-conditioning, and
construction are shown. In summary PRT will be more than twice as energy efficient as the auto
system, which in turn is almost twice as energy efficient as the average light rail system.
16. Benefits for the Riding Public
•
•
•
•
•
•
•
•
•
•
•
•
•
•
•
The system will be easy for everyone to use. No driver’s license needed.
The vehicles wait for people, rather than people for vehicles.
The trip cost will be competitive.
The trip will be short, predictable, and
nonstop.
There will be minimum or no waiting.
Everyone will have a seat.
The system will always be available at
any hour.
The vehicles will be heated, ventilated,
and air conditioned.
There will be no crowding.
There will be no vehicle-to-vehicle
transfers within the system
The ride will be private and quiet.
The chance of injury will be extremely
remote.
Personal security will be high.
The ride will be comfortable.
There will be space for luggage, a
wheelchair, a baby carriage, or a bicycle.
Figure 28. Energy-use comparison.
17. Benefits for the Community
• The energy use will be very low.
• PRT can use renewable energy.
• The system does not directly pollute the air. Being more energy efficient than the auto
system and by using renewable energy, total air pollution will be reduced substantially.
18
• PRT will be attractive to many auto users, thus reducing congestion.
• There will be huge land savings: 0.02% is required vs. 30-70% for the auto system.
• As to accidents, no one can say that there will never be an accident, but the rate per
hundred-million miles of travel will be less than one millionth of that experienced with
autos.
• Seniors, currently marooned, will have much needed mobility and independence.
• PRT can augment and increase ridership on existing rail systems.
• By spreading the service among many lines and stations, there will be no significant
targets for terrorists.
• Deployment of PRT will reduce transit subsidies.
• PRT will permit development of more livable high-density communities.
• The ride will be pleasant for commuting employees, thus permitting them to arrive at
work rested and relaxed.
• PRT will permit more people-attracting parks and gardens.
• PRT will permit safe, swift movement of mail, goods and waste.
• PRT will provide easier access to stores, clinics, offices and schools.
• PRT will provide faster all-weather, inside-to-inside transportation.
• PRT will enable more efficient use of urban land.
• By making the inner city more attractive, urban sprawl will be less likely.
18. Reconsider the Problems
.
High-Capacity PRT addresses all of the problems listed in Section 2, of which
congestion, peak oil and global warming are much in the news [17]. According to Andrew
Euston, now retired from the U. S. Department of Housing and Urban Development where he
was Coordinator of the Sustainability Cities Program, PRT “is an essential technology for a
Sustainable World.”
19. Significant PRT Activity
•
•
•
•
•
•
A series of studies of PRT in Sweden in 1990’s resulted in the statement: “Our
recommendation is therefore clear—a PRT system provides such a broad range of desired
qualities that it should be given highest priority in research, development, testing, and
demonstration for implementation in the urban environment.” Göran Tegnér, Business
Manager International, TRANSEK Consultants Company, Solna, Sweden. Infrastructure,
Vol. 2. No. 3, (1997).
As mentioned, the British Airport Authority is planning a PRT system at Heathrow
International Airport to move people and their luggage from parking lots to terminals.
As mentioned, the Korean steel company Posco is building a demonstration of their PRT
system, called Vectus, in Uppsala, Sweden.
In fall 2005, the Korean Railroad Research Institute announced that they will invest $57
million in the development of PRT.
The New Jersey State Legislature has funded a study very favorable to PRT, which is
expected to be released very soon.
The Dubai International Financial Center sent out a request for information for a PRT
system in August 2004.
19
• The leadership of a large mall called DestiNY USA planned for Syracuse, New York, has
stated that they need a PRT system in and around their facility.
• The City of SeaTac, Washington, spent about $1 million on studies of PRT during the
1990s and awaits a viable PRT system.
• Official research by the European Union concluded in March 2006: “PRT contributes
significantly to transport policy and all related policy objectives. This innovative
transport concept allows affordable mobility for all groups in society and represents
opportunities for achieving equity. . . PRT is the personalization of public transport, the
first public transport system which can really attract car users and which can cover its
operating cost and even capital cost at a wider market penetration. PRT complements
existing public transport networks. PRT is characterized through attractive transport
services and high safety. ” [18]
20. Development Strategy
• Seek first private applications.
• Fund a full-scale PRT test, which can now be completed for no more than $15 million,
provided that the program is led by a person of knowledge and commitment.
• Inform consultants, planners, and financiers about PRT.
• Perform specific PRT planning studies.
• Teach the engineering, economic, and planning sciences of PRT.
• Emulate other public works on which companies bid and win projects based on
competence and by giving the buyer assurance of multiple sources of supply.
21. References
1. />2. J. E. Anderson, “The Future of High-Capacity PRT,” Advanced Automated Transit Systems
Conference, Bologna, Italy, November 7-8, 2005.
/>3. J. E. Anderson, “Automated Transit Vehicle Size Considerations,” Journal of Advanced Transportation,
20:2(1986):97-105.
4. J. E. Anderson, “PRT: Matching Capacity to Demand,” />5. Department of Transportation and Related Agencies Appropriations for 1974. Hearings before a Subcommittee of the Committee on Appropriations, House of Representatives, Ninety-Third Congress, John J. McFall, Chairman, Part I, Urban Mass Transportation Administration, page 876.
See Section 8 for a reproduction of page 876.
6. J. E. Anderson, "Safe Design of Personal Rapid Transit Systems," J. Adv. Trans. 28:1(1988): 1-15.”
7. J. E. Anderson, “Failure Modes and Effects Analysis,” www.skyloop.org/cals/rebuttal/06-07-FailureModes-&-Effects-Analysis.pdf
8. J. E. Anderson, "Control of Personal Rapid Transit Systems," J. Adv. Trans., 32:1(1998):57-74.
9. J. E. Anderson, "Dependability as a Measure of On-Time Performance of Personal Rapid Transit
Systems," J. Adv. Trans., 26:3(1992):201-212.
10. C. K. Orski, Innovation Briefs, Nov/Dec 2006. www.innovriefs.com.
11. Irving, J. H., Bernstein, H., Olson, C. L., and Buyan, J. Fundamentals of Personal Rapid Transit,
20
Lexington Books, D. C. Heath and Company, Lexington, MA, 1978.
12. Development/Deployment Investigation of Cabintaxi/Cabinlift System, Report No. UMTA-MA-060067-77-02, NTIS Report No. PB277 184, 1977.
13. For a video of a system based on the author’s design, see
/>14. W. A Wilde, “The Simple, Compelling Case for PRT,” J. Adv. Trans., 32:1(1998).
15. J. E. Anderson, "Optimization of Transit-System Characteristics," J. Adv. Trans., 18:1(1984):77-111.
16. J. E. Anderson, "What Determines Transit Energy Use," J. Adv. Trans., 22:2(1988):108-132.
17. />18. See Reference 1.
Papers not easily available can be obtained from the author:
Credits for the Figures
Figure 1. Woobo Enterprises, Ltd., Seoul, Korea
Figure 2. University of Minnesota Graphics
Figure 3. Stone & Webster Engineering Corporation
Figure 4. Phase I PRT Design Study, Chicago RTA
Figure 5. Automated Transportation Systems, Inc.
Figure 6. University of Minnesota Graphics
Figure 7. Taxi 2000 Corporation
Figure 8. www.cprt.org
Figure 9. University of Minnesota Graphics
Figures 10, 11, 12. Minneapolis Architectural Illustrator
Figure 13. The Aerospace Corporation
Figure 14. Photo taken by the author
Figure 15. Photo taken by the author
Figure 16. Photo taken by the author
Figure 17. Photo taken by Short Elliott Hendrickson, Inc.
21
Figure 18, 21, 22. The author
Figure 19. www.atsltd.co.uk, www.vectusprt.com, www.megarail.com
Figure 20. www.metrocouncil.org
Figures 23, 24, 25, 26. William A. Wilde, Reference 12
Figure 27. Minneapolis Architectural Illustrator
Figure 28. Author’s paper, Reference 14
J. Edward Anderson, BSME, Iowa State University, MSME, University of Minnesota
Ph.D. in Aeronautics and Astronautics, Massachusetts Institute of Technology.
Following his undergraduate work he developed methods of structural analysis of supersonic-aircraft wings at the
Structures Research Division of NACA (now NASA), and contributed to the design of the F-103 wing. He then
moved to the Honeywell Aeronautical Division where he designed aircraft instruments including the first
transistorized amplifier used in a military aircraft and performed computer analysis of autopilots for military and
space applications. While there he invented and led the development of a new type of inertial navigator now used
widely on military and commercial aircraft, and also led the advanced development of a solar-probe spacecraft.
In 1963 he joined the Mechanical Engineering Department at the University of Minnesota and later directed its
Industrial Engineering Division. He chaired a Symposium on the Role of Science and Technology in Society;
initiated, managed and lectured in a large interdisciplinary course "Ecology, Technology, and Society;" coordinated a
15-professor Task Force on New Concepts in Urban Transportation; and chaired three International Conferences on
Personal Rapid Transit (PRT) following which he was elected first president of the Advanced Transit Association.
During the 1970s, Dr. Anderson consulted on PRT planning, ridership analysis, and design for the Colorado
Regional Transportation District, Raytheon Company, the German joint venture DEMAG+MBB, and the State of
Indiana. For several years he was Distinguished Lecturer for the American Institute of Aeronautics and
Astronautics. He lectured widely on new transit concepts and was sponsored on several lecture tours abroad by the
United States Information Agency and the United States State Department. In 1982 he was presented with the
George Williams Fellowship Award sponsored by the YMCA and presented for public service, and the MPIRG
Public Citizen Award.
In 1978 he published the textbook Transit Systems Theory (D. C. Heath, Lexington Books), which he uses in his
course "Transit Systems Analysis and Design." In addition to engineering students, enrollment in this course has
included professional transportation engineers from across United States as well as from Sweden and Korea. In
1981 he initiated and led the development of a High-Capacity PRT system through five stages of planning, design
and costing. He developed computer programs for vehicle control, station operation, operation of multiple vehicles
in networks, calculation of guideways curved in three dimensions to ride-comfort standards, study of the dynamics
of transit vehicles, economic analysis of transit systems, and calculation of transit ridership.
In 1986 he was attracted to the Department of Aerospace and Mechanical Engineering at Boston University where
he taught engineering design and transit systems analysis and design; and where he organized, coordinated and
lectured in an interdisciplinary course "Technology and Society." On his own time, he organized a team of a halfdozen engineers and managers from major Boston-Area firms to further develop High-Capacity PRT. In May 1989,
the Northeastern Illinois Regional Transportation Authority (RTA) learned of his work together with Raytheon
22
Company and, as a result, initiated a program to fully develop PRT. This led to a $1.5M PRT design study led by
Stone & Webster Engineering Corporation, followed by a $40M joint development program funded by Raytheon
Company and the RTA. While at Boston University, he developed the Maglev Performance Simulator used by the
National Maglev Initiative Office, U. S. Department of Transportation, to study the performance of high-speed
maglev vehicles traveling within ride-comfort standards over the curves and hills of an interstate expressway.
Following the RTA program, Dr. Anderson gave courses on transit systems analysis and design to transportation
professionals in the U. S. and Europe and engaged in PRT planning studies including simulations of PRT and
automated baggage-handling systems. He further developed PRT technology culminating in a full-scale vehicle
operating automatically on a short segment of guideway (Figure 17). In 1996 he chaired an international conference
on PRT and related technologies in Minneapolis. In 1998 his work led to acceptance of his PRT system as the
preferred technology promoted for the Greater Cincinnati Area by a committee of Forward Quest, a Northern
Kentucky business organization. He is a founder of PRT International, LLC.
For his patents on PRT, the Intellectual Property Owners Foundation named Dr. Anderson an Outstanding American
Inventor of 1989. In 1994 he was Distinguished Alumni Lecturer at North Park University in Chicago. In 2001 he
was elected Fellow of the American Association for the Advancement of Science for his work on PRT. He registered
as a professional engineer in Minnesota and Illinois, authored over 100 technical papers and three books, and is
listed in 36 biographical reference works including Who’s Who in America and Who’s Who in the World.
23