SOLVING THE PROBLEM OF CHILDHOOD OBESITY WITHIN A GENERATION potx
Bạn đang xem bản rút gọn của tài liệu. Xem và tải ngay bản đầy đủ của tài liệu tại đây (3.2 MB, 124 trang )
M AY 2 0 10
White House Task Force on Childhood Obesity
Report to the President
SOLV ING THE PROBLEM
OF CHILDHOOD OBESIT Y
W ITHIN A GENER ATION
Table of Contents
The Challenge We Face . . . . . . . . . . . . . . . . . . . . . . . . . . . . . . . 3
I. Early Childhood . . . . . . . . . . . . . . . . . . . . . . . . . . . . . . . . 11
A. Prenatal Care . . . . . . . . . . . . . . . . . . . . . . . . . . . . . . . 11
B. Breastfeeding. . . . . . . . . . . . . . . . . . . . . . . . . . . . . . . 13
C. Chemical Exposures . . . . . . . . . . . . . . . . . . . . . . . . . . . . 17
D. Screen Time . . . . . . . . . . . . . . . . . . . . . . . . . . . . . . . 18
E. Early Care and Education . . . . . . . . . . . . . . . . . . . . . . . . . . 19
II. Empowering Parents and Caregivers . . . . . . . . . . . . . . . . . . . . . . . 23
A. Making Nutrition Information Useful . . . . . . . . . . . . . . . . . . . . . 23
B. Food Marketing . . . . . . . . . . . . . . . . . . . . . . . . . . . . . . 28
C. Health Care Services . . . . . . . . . . . . . . . . . . . . . . . . . . . . 33
III. Healthy Food in Schools . . . . . . . . . . . . . . . . . . . . . . . . . . . . 37
A. Quality School Meals . . . . . . . . . . . . . . . . . . . . . . . . . . . . 37
B. Other Foods in Schools . . . . . . . . . . . . . . . . . . . . . . . . . . . 42
C. Food-Related Factors in the School Environment . . . . . . . . . . . . . . . . . 44
D. Food in Other Institutions . . . . . . . . . . . . . . . . . . . . . . . . . . 46
IV. Access to Healthy, Aordable Food . . . . . . . . . . . . . . . . . . . . . . . . 49
A. Physical Access to Healthy Food . . . . . . . . . . . . . . . . . . . . . . . 49
B. Food Pricing . . . . . . . . . . . . . . . . . . . . . . . . . . . . . . . 55
C. Product Formulation . . . . . . . . . . . . . . . . . . . . . . . . . . . . 59
D. Hunger and Obesity . . . . . . . . . . . . . . . . . . . . . . . . . . . . 61
V. Increasing Physical Activity . . . . . . . . . . . . . . . . . . . . . . . . . . . 65
A. School-Based Approaches . . . . . . . . . . . . . . . . . . . . . . . . . 68
B. Expanded Day and Afterschool Activities . . . . . . . . . . . . . . . . . . . . 74
C. The “Built Environment”. . . . . . . . . . . . . . . . . . . . . . . . . . . 78
D. Community Recreation Venues. . . . . . . . . . . . . . . . . . . . . . . . 82
Conclusion . . . . . . . . . . . . . . . . . . . . . . . . . . . . . . . . . . 87
Summary of Recommendations . . . . . . . . . . . . . . . . . . . . . . . . . . 89
Endnotes . . . . . . . . . . . . . . . . . . . . . . . . . . . . . . . . . . . 99
1
★ ★
Letter to the President
Dear Mr. President,
I am pleased to present you with the White House Task Force on Childhood Obesity’s action plan for
solving the problem of childhood obesity in a generation.
Parents across America are deeply concerned about their children’s health and the epidemic of childhood
obesity. One out of every three children is now overweight or obese, a condition that places them at
greater risk of developing diabetes, heart disease, and cancer over the course of their lives. This is not
the future we want for our children, and it is a burden our health care system cannot bear. Nearly $150
billion per year is now being spent to treat obesity-related medical conditions.
Fortunately, there are clear, concrete steps we can take as a society to help our children reach adult-
hood at a healthy weight. As you requested in the Memorandum you signed on February 9, our new
interagency Task Force on Childhood Obesity has spent the past 90 days carefully reviewing the research,
and consulting experts as well as the broader public, to produce a set of recommended actions that,
taken together, will put our country on track to solving the problem of childhood obesity.
We heard from a broad array of Americans, and received more than 2,500 public comments with specic
and creative suggestions. Twelve Federal agencies participated actively in the Task Force, and provided
their ideas and expertise. They include the Departments of Agriculture, Defense, Education, Health and
Human Services, Housing and Urban Development, Interior, Justice, and Transportation, as well as the
Corporation for National and Community Service, the Environmental Protection Agency, the Federal
Communications Commission, and the Federal Trade Commission.
Our recommendations focus on the four priority areas set forth in the Memorandum, which also form
the pillars of the First Lady’s Let’s Move! campaign: (1) empowering parents and caregivers; (2) providing
healthy food in schools; (3) improving access to healthy, aordable foods; and (4) increasing physical
activity. In addition, we have included a set of recommendations for actions that can be taken very early
in a child’s life, when the risk of obesity rst emerges.
We cannot succeed in this eort alone. Our recommendations are not simply for Federal action, but
also for how the private sector, state and local leaders, and parents themselves can help improve the
health of our children. The Task Force will move quickly to develop a strategy for implementing this
plan, working in partnership with the First Lady to engage stakeholders across society. Indeed, many
Americans — including leaders in the public and private sectors — have already volunteered to join
this eort, and are ready and waiting to put this plan in action.
Sincerely,
Melody Barnes
Chair, Task Force on Childhood Obesity, and Director, Domestic Policy Council
3
★ ★
e Challenge We Face
The childhood obesity epidemic in America is a national health crisis. One in every three children
(31.7%) ages 2-19 is overweight or obese.
1
The life-threatening consequences of this epidemic create
a compelling and critical call for action that cannot be ignored. Obesity is estimated to cause 112,000
deaths per year in the United States,
2
and one third of all children born in the year 2000 are expected to
develop diabetes during their lifetime.
3
The current generation may even be on track to have a shorter
lifespan than their parents.
4
Along with the eects on our children’s health, childhood obesity imposes substantial economic costs.
Each year, obese adults incur an estimated $1,429 more in medical expenses than their normal-weight
peers.
5
Overall, medical spending on adults that was attributed to obesity topped approximately $40
billion in 1998, and by 2008, increased to an estimated $147 billion.
6
Excess weight is also costly during
childhood, estimated at $3 billion per year in direct medical costs.
7
Childhood obesity also creates potential implications for military readiness. More than one quarter of all
Americans ages 17-24 are unqualied for military service because they are too heavy.
8
As one military
leader noted recently, “We have an obesity crisis in the country. There’s no question about it. These are
the same young people we depend on to serve in times of need and ultimately protect this nation.”
9
While these statistics are striking, there is much reason to be hopeful. There is considerable knowledge
about the risk factors associated with childhood obesity. Research and scientic information on the
causes and consequences of childhood obesity form the platform on which to build our national poli-
cies and partner with the private sector to end the childhood obesity epidemic. Eective policies and
tools to guide healthy eating and active living are within our grasp. This report will focus and expand
on what we can do together to:
1. create a healthy start on life for our children, from pregnancy through early childhood;
2. empower parents and caregivers to make healthy choices for their families;
3. serve healthier food in schools;
4. ensure access to healthy, aordable food; and
5. increase opportunities for physical activity.
What is Obesity?
Obesity is dened as excess body fat. Because body fat is dicult to measure directly, obesity is often
measured by body mass index (BMI), a common scientic way to screen for whether a person is under-
weight, normal weight, overweight, or obese. BMI adjusts weight for height,
10
and while it is not a perfect
indicator of obesity,
11
it is a valuable tool for public health.
Adults with a BMI between 25.0 and 29.9 are considered overweight, those with a BMI of 30 or more are
considered obese, and those with a BMI of 40 or more are considered extremely obese.
12
For children and
adolescents, these BMI categories are further divided by sex and age because of the changes that occur
SO LVI N G THE P RO BLEM OF CH I LDH O OD OB E SI T Y
4
★ ★
during growth and development. Growth charts from the Centers for Disease Control and Prevention
(CDC) are
used to calculate children’s BMI. Children and adolescents with a BMI between the 85th and
94th percentiles are generally considered overweight, and those with a BMI at or above the sex-and
age-specic 95th percentile of population on this growth chart are typically considered obese.
Determining what is a healthy weight for children is challenging, even with precise measures. BMI
is often used as a screening tool, since a BMI in the overweight or obese range often, but not always,
indicates that a child is at increased risk for health problems. A clinical assessment and other indicators
must also be considered when evaluating a child’s overall health and development.
13
Who Does Obesity Impact? Prevalence and Trends
By gaining a deeper understanding of individuals who are impacted by obesity, we can better shape
policies to combat it. Since 1980, obesity has become dramatically more common among Americans of
all ages. Prevalence estimates of obesity in the U.S. are derived from the National Health and Nutrition
Examination Survey (NHANES), conducted by the National Center for Health Statistics of the CDC.
Between the survey periods 1976–80 and 2007–08, obesity has more than doubled among adults (rising
from 15% to 34%), and more than tripled among children and adolescents (rising from 5% to 17%).
14
The rapid increase in childhood obesity in the 1980s and 1990s has slowed, with no signicant increase
in recent years.
15
However, among boys ages 6–19, very high BMI (at or above the 97th percentile)
became more common between 1999–2000 and 2007–08; about 15% of boys in this age group are in
this category.
16
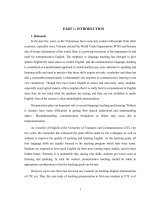
Growth in Childhood Obesity, 1971 to Present
Source: CDC, National Center for Health Statistics, National Health and Nutrition Examination Surveys.
Note: Obesity is dened as BMI ≥ gender- and weight-specic 95th percentile from the 2000 CDC Growth Charts
0%
2%
4%
6%
8%
10%
12%
14%
16%
18%
20%
1972
1976 1980 1984 1988 1992 1996 2000 2004 2008
Percent of children aged 2-19 who are obese
T HE CH A LLENG E WE FACE
5
★ ★
Race/Ethnic Disparities
Childhood obesity is more common among certain racial and ethnic groups than others. Obesity rates
are highest among non-Hispanic black girls and Hispanic boys. Obesity is particularly common among
American Indian/Native Alaskan children. A study of four year-olds found that obesity was more than
two times more common among American Indian/Native Alaskan children (31%) than among white
(16%) or Asian (13%) children. This rate was higher than any other racial or ethnic group studied.
17
Socioeconomic Disparities
Among adults, obesity rates are sometimes associated with lower incomes, particularly among women.
Women with higher incomes tend to have lower BMI, and the opposite is true, those with higher BMI
have lower incomes.
18
A study in the early 2000s found that about 38% of non-Hispanic white women
who qualied for the Supplemental Nutrition Assistance Program (known then as food stamps), were
obese, and about 26% of those above 350% of the poverty line were obese.
19
Also, a recent study of
American adults found lower rates of obesity among individuals with more education. Specically, the
study found that nearly 35% of adults with less than a high school degree were obese, compared to
21% of those with a bachelor’s degree or higher.
20
The relationship between income and obesity in children is less consistent than among adult
women,
21
and sometimes even points in the opposite direction. Another study from the early 2000s
found that only among white girls were higher incomes associated with lower BMI. Among African-
American girls, the prevalence of obesity actually increased with higher socioeconomic status, sug-
gesting that eorts to reduce ethnic disparities in obesity must target factors other than income and
education, such as environmental, social, and cultural factors.
22
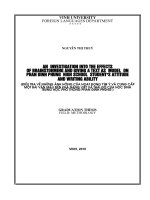
Childhood Obesity Rates by Race, Ethnicity, and Gender, 2007-08
Source: CDC, National Center for Health Statistics, National Health and Nutrition Examination Survey;
Note: Obesity is dened as BMI ≥ gender- and weight-specic 95th percentile from the 2000 CDC Growth Charts
0%
5%
10%
15%
20%
25%
30%
Percent of children aged 12-19 who are obese
BOYS
GIRLS
BOYS
GIRLS
BOYS
GIRLS
Non-Hispanic White Non-Hispanic Black Hispanics
16.7%
14.5%
19.8%
29.2%
25.5%
17.5%
SO LVI N G THE P RO BLEM OF CH I LDH O OD OB E SI T Y
6
★ ★
Regional Disparities
Across the country, the prevalence of obesity has been found to be highest in southeast states such as
Alabama, Mississippi, South Carolina, Tennessee, and West Virginia, as well as in Oklahoma. It is lowest
in Colorado.
23
Another study showed obesity was most common among adults in the Midwest and the
South, as well as among adults who did not live in metropolitan areas.
24
How Does Obesity Impact Our Health?
Obese adults have an increased risk for many diseases, including type 2 diabetes, heart disease, some
forms of arthritis, and several cancers.
25
Overweight and obese children are more likely to become
obese adults.
26
Specically, one study found that obese 6-8 year-olds were approximately ten times
more likely to become obese adults than those with lower BMIs.
27
The association may be stronger for
obese adolescents than younger children.
28
Obese children are also more likely to have increased risk
of heart disease.
29
One study found that approximately 70% of obese children had high levels (greater
than 90th percentile) of at least one key risk factor for heart disease, and approximately 30% had high
levels of at least two risk factors.
30
There is evidence that heart disease develops in early childhood and
is exacerbated by obesity,
31
and people as young as 21 have been found to display early physical signs
of heart disease due to obesity.
32
Obese children are also more likely to develop asthma.
33
Obesity is the most signicant risk factor for type 2 diabetes, a disease once called “adult onset diabetes”
because it occurred almost exclusively in adults until childhood obesity started to rise substantially. The
number of hospitalizations for type 2 diabetes among Americans in their 20s has gone up substantially,
for example.
34
A 2001 study found that more than 75% of children ages 10 and over with type 2 diabetes
were obese.
35
Type 2 diabetes occurs more frequently among some racial and ethnic minority groups,
and rates among American Indians are particularly high.
36
In addition to the physical health consequences, severely obese children report a lower health-related
quality of life (a measure of their physical, emotional, educational, and social well-being). In fact, one
study found that they have a similar quality of life as children diagnosed with cancer.
37
Childhood
obesity is a highly stigmatized condition, often associated with low self-esteem, and obese children
are more likely than non-obese children to feel sad, lonely, and nervous.
38
Obesity during childhood is
also associated with some psychiatric disorders, including depression and binge-eating disorder, which
may both contribute to and be adversely impacted by obesity.
39
What Causes Obesity?
Early Life
A child’s risk of becoming obese may even begin before birth. Pregnant women who use tobacco, gain
excessive weight, or have diabetes give birth to children who have an increased risk of being obese dur-
ing their preschool years.
40
Furthermore, although the evidence is not conclusive,
41
rapid weight gain
in early infancy has been shown to predict obesity later in life.
42
Racial and ethnic dierences in obesity
may also be partly explained by dierences in risk factors during the prenatal period and early life.
43
T HE CH A LLENG E WE FACE
7
★ ★
Studies show that early inuences can aect obesity rates. The increased occurrence of obesity among
children of obese parents suggests a genetic component.
44
Multiple twin and adoption studies also
indicate a strong genetic component to obesity.
45
However, genes associated with obesity were present
in the population prior to the current epidemic; genes only account for susceptibility to obesity and
generally contribute to obesity only when other inuences are at work. Genetic susceptibility to obesity
is signicantly shaped by the environment.
46
In addition to genetic factors, recent research has focused
on other factors, such as maternal nutrition, environmental toxins, and the prenatal environment, which
may shape later risk for childhood obesity.
Environmental Factors During Childhood
There have been major changes in Americans’ lifestyles over the last 30 years, as childhood obesity rates
have been rising. This includes what and where we eat. Given the pace of modern life, Americans now
consume more fast-food and sugar-sweetened beverages, eat outside the home more frequently,
47
and
spend less time enjoying family meals. In addition, prepared and processed food is easily accessible
and inexpensive. These items are also heavily promoted, as evidenced in a Federal Trade Commission
(FTC) report revealing that at least $1.6 billion is spent annually on food advertising directed to children
and adolescents.
48
All this adds up to poor eating habits. For example, 13% of the daily caloric intake
for 12-19 year-olds now comes from sugar-sweetened beverages.
49
At the same time, adults and children alike are getting less physical activity. Some schools have cut
back on activities like physical education and recess, in part due to budget pressures at the state and
local level. And children are increasingly driven to school by car or bus, rather than walking or biking.
50
In part, these shifts in transportation reect changes in community design. Physical activity is higher
in more “connected” communities that provide safe and reliable access to public transportation, as well
as other forms of active transport like biking and walking.
51
Meanwhile, “screen time” has increased, including television viewing, which is directly associated with
childhood and adult obesity.
52
Among children, watching television or time spent on computers or
gaming systems takes away from engaging in physical activity like organized sports or informal playing.
It also has a more harmful eect on healthy eating habits; as children watch television, they are more
likely to snack, including on the foods advertised.
53
In addition, screen time has been associated with
children getting less and poorer quality sleep,
54
and insucient sleep has been linked to a heightened
risk of obesity.
55
What Can We Do?
While additional studies to identify the precise causes of obesity will be useful, we do not need to wait
to identify specic actions that we can take as a society to prevent obesity. There are many examples
of eective therapies for diseases whose cause has not been fully identied. For example, remission
rates of acute lymphocytic leukemia in children have been dramatically improved over the last 20 years,
although the causes of the disease remain uncertain.
No single action alone will reverse the childhood obesity epidemic, although there is no question that
improving eating habits and increasing physical activity are two critical strategies. As with tobacco
prevention and control, comprehensive, multi-sectoral approaches are needed to address the many
SO LVI N G THE P RO BLEM OF CH I LDH O OD OB E SI T Y
8
★ ★
behavioral risk factors associated with obesity.
56
These risk factors fall into three general categories: (1)
material incentives, such as the cost of food or the desire to avoid poor health; (2) social norms, such as
the nutritional and physical activity habits of friends and family, which inuence us greatly; and (3) the
broader environment, such as whether grocery stores and playgrounds are nearby or far away. Changes
in each of these risk factors are possible. For example, with sound information, parents and caregivers
will be able to seek out the most nutritious foods to improve their children’s health; changes in social
norms can be brought about through movements such as the successful seatbelt buckling campaigns
of the late 20th century; and changes can be made in the broader environment by eliminating “food
deserts” or “playground deserts.”
In many parts of the country, we already have a head start, and initiatives that are already underway will
provide instructive lessons. Comprehensive, community-wide eorts to reduce obesity have recently
been initiated by both the public and private sectors. The American Recovery and Reinvestment Act of
2009 included $1 billion in funding for prevention and wellness investments, more than half of which
was directed to prevention strategies to reduce tobacco use and obesity rates. Specically, $373 mil-
lion supported direct community-based interventions and $120 million supported state-based eorts
in all 50 states and 25 communities in urban, rural, and tribal areas. Funds to support comprehensive
strategies were awarded to states in February and to communities in March. The recently-enacted
Patient Protection and Aordable Care Act, as amended by the Health Care and Education Aordability
Reconciliation Act (collectively referred to as the “Aordable Care Act”) provides for additional invest-
ments in chronic disease and improving public health, which could include community-based preven-
tion strategies. In addition, the philanthropic sector has been leading the way with stepped-up, focused
investments. For example, the Robert Wood Johnson Foundation has created a “Healthy Kids, Healthy
Communities” initiative that is funding 50 communities to implement strategies to prevent childhood
obesity,
57
and the California Endowment recently launched a large-scale “Building Healthy Communities”
project in 14 communities that will include a focus on childhood obesity prevention.
58
Reducing childhood obesity does not have to be a costly endeavor, however. And indeed, in many
communities it simply cannot be. Times are tough, and federal, state, local, and family budgets are all
feeling squeezed. But a great deal can be accomplished without signicant expenditures, and some
steps may ultimately save money.
59
While many of the recommendations in this report will require
additional public resources, creative strategies can also be used to redirect resources or make more
eective use of existing investments.
In total, this report presents a series of 70 specic recommendations, many of which can be implemented
right away. Summarizing them broadly, they include:
• Getting children a healthy start on life, with good prenatal care for their parents; support for
breastfeeding; adherence to limits on “screen time”; and quality child care settings with nutri-
tious food and ample opportunity for young children to be physically active.
• Empowering parents and caregivers with simpler, more actionable messages about nutri-
tional choices based on the latest Dietary Guidelines for Americans; improved labels on food
and menus that provide clear information to help make healthy choices for children; reduced
marketing of unhealthy products to children; and improved health care services, including BMI
measurement for all children.
T HE CH A LLENG E WE FACE
9
★ ★
• Providing healthy food in schools, through improvements in federally-supported school
lunches and breakfasts; upgrading the nutritional quality of other foods sold in schools; and
improving nutrition education and the overall school environment.
• Improving access to healthy, aordable food, by eliminating “food deserts” in urban and rural
America; lowering the relative prices of healthier foods; developing or reformulating food prod-
ucts to be healthier; and reducing the incidence of hunger, which has been linked to obesity.
• Getting children more physically active, through quality physical education, recess, and other
opportunities in and after school; addressing aspects of the “built environment” that make it
dicult for children to walk or bike safely in their communities; and improving access to safe
parks, playgrounds, and indoor and outdoor recreational facilities.
Many of these recommendations are for activities to be undertaken by federal agencies. All such activi-
ties are subject to budgetary constraints, including the weighing of priorities and available resources
by the Administration in formulating its annual budget and by Congress in legislating appropriations.
How Will We Know We Have Succeeded?
Our goal is to solve the problem of childhood obesity in a generation. Achieving that goal will mean
returning to the expected levels in the population, before this epidemic began. That means returning to
a childhood obesity rate of just 5% by 2030. Achieving this goal will require “bending the curve” fairly
quickly, so that by 2015, there will be a 2.5% reduction in each of the current rates of overweight and
obese children, and by 2020, a 5% reduction. Our progress can be charted through the CDC’s annual
National Health and Nutrition Examination Survey (NHANES), which is aggregated every two years.
Bending the Curve: Childhood Obesity, 1972 to 2030
Source: CDC, National Center for Health Statistics, National Health and Nutrition Examination Surveys.
Note: Obesity is dened as BMI ≥ gender- and weight-specic 95th percentile from the 2000 CDC Growth Charts.
0%
2%
4%
6%
8%
10%
12%
14%
16%
18%
20%
1972 1976 1980 1984 1988 1992 1996 2000 2004 2008
Percent of children aged 2-19 who are obese
2012 2016 2020 2024 2028
2007-08: 19.6%
2015: 17.1%
2020: 14.6%
2030: 5.0%
SO LVI N G THE P RO BLEM OF CH I LDH O OD OB E SI T Y
10
★ ★
In addition to monitoring the overall trends in childhood obesity, two key indicators will show the
progress achieved:
1. The number of children eating a healthy diet, measured by those who follow the most
recent, science-based Dietary Guidelines for Americans (Dietary Guidelines). We can monitor
our progress through the U.S. Department of Agriculture’s (USDA) Healthy Eating Index (HEI),
which reects the intake of 12 dietary components: total fruit (including juice); whole fruit (not
juice); total vegetables; dark green and orange vegetables and legumes; total grains; whole
grains; milk products; meat and beans; oils; saturated fat; sodium; and calories from solid fats
and added sugars. USDA generally regards a score of at least 80 out of 100 points as reecting
a healthy diet. Currently, the average child scores a 55.9 on the HEI.
60
To achieve a score of 80
for the average child by 2030, the average child should score 65 by 2015, and 70 by 2020. Two
indicators should be monitored particularly closely:
− Less added sugar in children’s diets. Children today consume a substantial amount
of added sugars through a whole range of products. Using existing data sources, CDC’s
National Center for Health Statistics can determine how much added sugar children are
currently consuming. Targets for reducing added sugar will then need to be established
that track the overall goal of driving obesity rates down to 5% by 2030.
− More fruits and vegetables. Currently, children and adolescents consume far lower quanti-
ties of fruits and vegetables than recommended in the Dietary Guidelines.On average, chil-
dren consumed only 64% of the recommended level of fruit and 46% of the recommended
level of vegetables in 2003-04. Average fruit consumption should increase to 75% of the
recommended level by 2015, 85% by 2020, and 100% by 2030; vegetable consumption
should increase to 60% of recommended levels by 2015, 75% by 2020, and 100% by 2030.
2. The number ofchildren meeting current physical activity guidelines. Right now, the only
regular survey that shows whether children are meeting the Physical Activity Guidelines is lim-
ited to high school students, and regular data on younger children is not available. Resources
will have to be redirected to develop a survey instrument that can provide a full picture of
physical activity levels among children of all ages. Once baseline data is available, targets for
improving the level of physical activity among children will need to be established that track
the overall goal of driving obesity rates down to 5% by 2030.
Additional benchmarks of success, tied to specic recommendations in this report, are included through-
out. The Healthy People goals set every decade by experts convened by the U.S. Department of Health
and Human Services will provide additional, complementary opportunities to measure our progress in
helping children achieve and maintain a healthy weight.
Monitoring our progress and the impact of our interventions, so that we know what is working and
what strategies or tactics need to be adjusted, will be critically important. This is not an easy challenge,
but it is one that we can solve as a society, and within a generation.
11
★ ★
I. Early Childhood
Studies show that approximately one in ve children are overweight or obese by the time they reach
their 6th birthday,
61
and over half of obese children become overweight at or before age two.
62
Even
babies are aected. Between 1980 and 2001, the prevalence of overweight infants under six months
almost doubled, from 3.4% to 5.9%.
63
More can and must be done to ensure our youngest children
begin life on a healthy path.
This chapter provides recommendations for reducing the risk of obesity in the early years of a child’s
life by:
• strengthening prenatal care;
• promoting breastfeeding;
• evaluating the impact of chemical inuences in the environment;
• reducing “screen time;” and
• improving the quality of our nation’s child care settings so they can consistently support
our children’s healthy development.
A. Prenatal Care
Mothers’ pre-conception weight and weight gain during pregnancy are two of the most important
prenatal determinants of childhood obesity. Several factors may inuence the association of maternal
weight and weight gain during pregnancy with long-term child health outcomes. These factors include
maternal and paternal BMI, maternal smoking during pregnancy, blood sugar levels during pregnancy,
fetal growth, birth weight, and infant feeding practices.
64
Higher maternal weight is a risk factor for gestational diabetes or related conditions during pregnancy.
Children born to mothers who had diabetes during pregnancy are at higher risk of being overweight
and having gestational and type 2 diabetes. In a study of low-income children, there was a association
between maternal BMI in the rst trimester and the probability of being overweight at 2, 3, and 4 years
of age.
Recent ndings suggest that very low birth weight and very high birth weight are both associated
with childhood obesity. Although the link between very high birth weight and childhood obesity is
studied more, the link between low birth weight and obesity may be the result of accelerated growth
immediately after birth. Babies who were “deprived of nutrition” before birth may be primed for accel-
erated growth after birth when exposed to a rich nutrient environment (which often consists of infant
formula).
65
This rapid growth in the rst few months and even perhaps the rst days of postnatal life,
are associated with increased risk of children being overweight.
66
SO LVI N G THE P RO BLEM OF CH I LDH O OD OB E SI T Y
12
★ ★
Maternal smoking during early pregnancy is associated with a 500% greater risk of obesity at age 5, and
a 260% greater risk at ages 9-10.
67
The duration of smoking while pregnant and number of cigarettes
smoked per day are both associated with increases in rates of childhood obesity.
68
Maternal smoking is
linked to low intrauterine growth, which can be associated with accelerated postnatal growth and child-
hood obesity. Notably, the recently-enacted Aordable Care Act requires coverage of counseling and
pharmacotherapy for cessation of tobacco use for pregnant women in Medicaid, with no cost-sharing
for these services, eective October 1.
69
To improve children’s health, the Surgeon General recommends promoting eective prenatal counsel-
ing about: maternal weight gain; breastfeeding; the relationship between obesity and diabetes; and
avoiding alcohol, tobacco, and drug use during pregnancy.
70
Recent clinical trials indicate that weight
gain can be modied by prenatal counseling.
71
Currently, however, only about 30% of pregnant women
receive appropriate counseling and guidance from a medical professional on how to achieve recom-
mended weight goals during pregnancy.
72
Higher maternal weight gain during pregnancy is also associated with excess maternal weight retained
afte childbirth.
73
A higher BMI after childbirth can be a health risk for the mother but also sets the stage
for a higher pre-pregnancy weight in future pregnancies.
A more complete picture of maternal and child weight is needed to monitor these trends and better
inform policymakers and health professionals.
Recommendations
Recommendation 1.1: Pregnant women and women planning a pregnancy should be informed of
the importance of conceiving at a healthy weight and having a healthy weight gain during preg-
nancy, based on the relevant recommendations of the Institute of Medicine. Specically, health
care providers, as well as Federal, state, and local agencies, medical societies, and organizations that
serve pregnant women or those planning pregnancies should provide information concerning the
importance of conceiving at a normal BMI and having a healthy weight gain during pregnancy. Those
who provide primary and prenatal care to women should oer them counseling on dietary intake and
physical activity that is tailored to their life circumstances. In many cases, conceiving at a normal BMI
will require some weight loss.
Recommendation 1.2: Education and outreach eorts about prenatal care should be enhanced
through creative approaches that take into account the latest in technology and communications.
Partners in this eort could include companies that develop technology-based communications tools,
as well as companies that market products and services to pregnant women or prospective parents.
Text4baby: Providing Health Tips to Pregnant Women and New Parents
Text4baby, an educational program of the U.S. Department of Health and Human Services and the
National Healthy Mothers, Healthy Babies Coalition, is a free mobile information service that provides preg-
nant women and new parents with health tips to help them give their babies the best possible start in life.
I. EA RLY CHI LDH O OD
13
★ ★
Benchmarks of Success
A higher percentage of women conceiving at a normal BMI, and at an appropriate gestational
weight gain during pregnancy, based on the Institute of Medicine’s gestational weight guidelines.
74
To measure this, HHS should redirect existing resources to prioritize routine surveillance of weight gain
during pregnancy and postpartum weight retention on a nationally representative sample of women
and to report the results by pre-pregnancy BMI (including all classes of obesity), age, racial/ethnic group,
and socioeconomic status.
Some states also collect maternal and child weight information on birth certicates, and states should
be encouraged to work with HHS to ensure that a complete set of data is collected. The 2003 version
of the U.S. Standard Certicate of Live Birth includes elds for maternal pre-pregnancy weight, height,
weight at delivery, and age at the last measured weight, facilitating improved public health surveillance.
75
By 2007, 24 states adopted this form, representing an estimated 60% of all births.
76
States should strive
for 100% completion of elds related to maternal weight and height, as well as share data to provide
a full national picture and regional snapshots. HHS should work with the remaining states to encour-
age adoption of the updated birth certicate form. The President’s FY2011 Budget includes increased
resources for all States to have an electronic birth record in 2011.
As an interim step, prenatal counseling rates can be measured as a proxy. The Pregnancy Risk Assessment
Monitoring System (PRAMS) is a surveillance project of the CDC and state health departments. PRAMS
collects state-specic, population-based data on maternal attitudes and experiences before, during,
and shortly after pregnancy, including information on prenatal counseling, cigarette use, alcohol use,
breastfeeding, and pre-conception health (including height and weight). PRAMS will be revised to
capture prenatal counseling on appropriate weight gain.
B. Breastfeeding
Children who are breastfed are at reduced risk of obesity.
77
Studies have found that the likelihood of
obesity is 22% lower among children who were breastfed.
78
The strongest eects were observed among
adolescents, meaning that the obesity-reducing benets of breastfeeding extend many years into a
child’s life. Another study determined that the risk of becoming overweight was reduced by 4% for each
month of breastfeeding.
79
This eect plateaued after nine months of breastfeeding.
Despite these health benets, although most (74%) babies start out breastfeeding, within three months,
two-thirds (67%) have already received formula or other supplements. By six months of age, only 43%
are still breastfeeding at all, and less than one quarter (23%) are breastfed at least 12 months.
80
In addi-
tion, there is a disparity between the prevalence of breastfeeding among non-Hispanic black infants and
those in other racial or ethnic groups. For instance, a recent CDC study showed a dierence of greater
than 20 percentage points in 13 states.
81
SO LVI N G THE P RO BLEM OF CH I LDH O OD OB E SI T Y
14
★ ★
The protective eect of breastfeeding likely results from a combination of factors. First, infant formula
contains nearly twice as much protein per serving as breast milk. This excess protein may stimulate
insulin secretion in an unhealthy way.
82
Second, the biological response to breast milk diers from that
of formula. When feeding a baby, the mother’s milk prompts the baby’s liver to release a protein that
helps regulate metabolism.
83
Feeding formula instead of breast milk increases the baby’s concentra-
tions of insulin in his or her blood, prolongs insulin response,
84
and, even into childhood, is associated
with unfavorable concentrations of leptin, a hormone that inhibits appetite and controls body fatness.
85
Despite the well-known health benets of breastfeeding and the preference of most pregnant women
to breastfeed,
86
numerous barriers make breastfeeding dicult. For rst-time mothers, breastfeeding
can be challenging, even for those who intend to breastfeed. For those who have less clear intent to
breastfeed, cultural, social, or structural challenges can prevent breastfeeding initiation or continuation.
For example, immediately after birth, many babies are unnecessarily given formula and separated from
their mothers, making it harder to start and practice breastfeeding. Also, hospital sta are often insuf-
ciently trained in breastfeeding support.
The Joint Commission on the Accreditation of Hospitals, the body that accredits hospitals and health
care organizations for most State Medicaid and Medicare reimbursement, now expects hospitals to
track and improve their rates of exclusive breastfeeding. Hospitals that meet specic criteria for optimal
breastfeeding-related maternity care are designated as “Baby Friendly” by Baby-Friendly U.S.A. This
non-governmental organization has been named by the U.S. Committee for UNICEF as the designating
authority for UNICEF/WHO standards in the United States. Currently only 3% of births in America occur
in Baby-Friendly facilities.
87
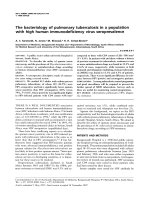
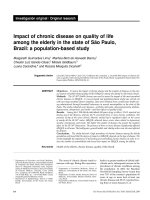
Breastfeeding Initiation Rates by Race/Ethnicity
Source: Centers for Disease Control, Division of Nutrition, Physical Activity and Obesity, National Center for Chronic Disease Prevention
and Health Promotion. Breastfeeding Among U.S. Children Born 1999−2006, CDC National Immunization Survey.
0
10
20
30
40
50
60
70
80
90
Overall Asian Hispanic Native Hawaiian
and Other
White,
Non-Hispanic
American Indian/
Native Alaskan
Black,
Non-Hispanic
73.9%
84.4%
82.1%
73.8%
69.9%
78.2%
56.5%
I. EA RLY CHI LDH O OD
15
★ ★
While breastfeeding could be far more widespread than it is today, it is not a viable alternative for all
mothers and babies. Specic guidance and support options should also be made available for those
who cannot breastfeed. Parents and caregivers of babies also may benet from guidance about when
to start feeding them solid foods, since early introduction of solids (prior to six months) increases the
risk for childhood obesity.
88
Workplace and Child Care Accommodations
Research has demonstrated that support is essential for helping mothers establish and continue breast-
feeding as they return to work or school and make use of child care services.
89
Many women return
to work soon after their baby’s birth, yet 75% of employers do not oer accommodations for them to
breastfeed or express milk at work.
90
Changes are underway, however. Following the lead of states whose laws requiring employers to make
accommodations, the recently-enacted Aordable Care Act requires employers to provide a reasonable
break time and a place for breastfeeding mothers to express milk for one year after their child’s birth.
91
Employers with fewer than 50 employees are not subject to these requirements if compliance would
impose an undue hardship. The location cannot be a bathroom, and must be shielded from view and
free from intrusion from co-workers and the public. The return on investment of companies that assist
breastfeeding employees through appropriate support and accommodations is well-documented.
Companies benefit through better employee retention, lower health care costs, and better work
attendance.
92
Support for breastfeeding in child care settings is important as well. Among women whose infants are
cared for outside the home, irrespective of their intent to breastfeed, those who report better support for
breastfeeding from early learning settings (such as refrigerated storage for breast milk, a commitment
to feed it to the child, or privacy space for on-site breastfeeding) are more likely to breastfeed longer.
93
Support Programs
In many communities, role models for breastfeeding are rare, and new mothers do not know where to
turn for breastfeeding assistance. Volunteer networks of experienced breastfeeding mothers such as
the La Leche League provide help for some mothers, but networks like this are not available in many
communities. According to the CDC’s annual State Breastfeeding Report Card, there were 34 breastfeed-
ing support groups per 100,000 live births in 2009, which means about one support group for every
3000 new babies. Peer support programs, such as the Peer Counselor program delivered as part of the
Special Supplemental Nutrition Program for Women, Infants and Children (WIC), provide counseling
skills, training, and support to experienced breastfeeding mothers so they can eectively support new
mothers. Recently, federal funds were provided to further expand the availability of peer counseling in
local WIC clinics. Prenatal counseling on breastfeeding can also have positive impacts on breastfeeding
rates,
94
and pre- and postnatal intervention together with peer counseling is most eective.
95
SO LVI N G THE P RO BLEM OF CH I LDH O OD OB E SI T Y
16
★ ★
Recommendations
Recommendation 1.3: Hospitals and health care providers should use maternity care practices that
empower new mothers to breastfeed, such as the Baby-Friendly hospital standards. Hospitals and
health care providers should routinely provide evidence-based maternity care that empowers parents
to make informed infant feeding decisions as active participants in their care, and improves new moth-
ers’ ability to breastfeed successfully. Examples of specic practices and policies include: skin-to-skin
contact between the mother and her baby; teaching mothers how to breastfeed; and early and frequent
breastfeeding opportunities.
Hospitals, health care providers, and health insurers should also help ensure that new mothers receive
proper information and support on breastfeeding when they are released from the hospital.
Recommendation 1.4: Health care providers and insurance companies should provide information
to pregnant women and new mothers on breastfeeding, including the availability of educational
classes, and connect pregnant women and new mothers to breastfeeding support programs to help
them make an informed infant feeding decision.
Recommendation 1.5: Local health departments and community-based organizations, working
with health care providers, insurance companies, and others should develop peer support pro-
grams that empower pregnant women and mothers to get the help and support they need from
other mothers who have breastfed. Peer support networks should exist in all communities across
the country, allowing all new mothers to easily identify and obtain help from trained breastfeeding
peer counselors. Community organizations can foster the creation of peer support networks through
expansion of programs like the WIC Breastfeeding Peer Counseling program. They can work with local
breastfeeding coalitions to ensure existence of other peer support networks, such as La Leche League
groups or Nursing Mothers Councils. They can also foster the creation of mother-to-mother support
groups in community health centers and advertise these groups, particularly as part of the hospital
discharge process.
Early Head Start (EHS) programs that enroll pregnant women, including pregnant teenagers, can also
support community breastfeeding networks. EHS can provide home visits and reach out to pregnant
and breastfeeding mothers to encourage and support breastfeeding, including by providing profes-
sional and peer opportunities to disseminate information and provide on-going support. Funding for
evidence-based home visitation programs in the recently-enacted Aordable Care Act
96
will comple-
ment this program.
Private companies, including those that market baby products, can also help support and promote
these types of community supports for mothers.
Recommendation 1.6: Early childhood settings should support breastfeeding. Child care centers and
providers, health care providers, and government agencies should provide accurate information about
the storage and handling of breast milk. They should also make sure child care employees and provid-
ers know how to store, handle, and feed breast milk, and understand the importance of breastfeeding.
I. EA RLY CHI LDH O OD
17
★ ★
Benchmarks of Success
An increase in breastfeeding rates. Several government sources provide statistics on breastfeeding
rates. The most comprehensive source of information is the National Immunization Survey, which
provides annual national, state, and selected urban-area estimates of breastfeeding initiation, duration,
and exclusivity. In addition to questions on breastfeeding, the survey asks about the introduction of
infant formula and other supplementary foods. As noted above, according to the survey, currently 30%
of babies age nine months or younger are breastfed. This should increase by 5% every two years, so
that by 2015, half of babies are breastfed for at least nine months.
C. Chemical Exposures
In addition to fetal “over-nutrition” or “under-nutrition,” it is possible that developmental exposure to
endocrine disrupting chemicals (EDCs) or other chemicals plays a role in the development of diabetes
and childhood obesity. Some scientists have coined the term “obesogens” for chemicals that they believe
may promote weight gain and obesity. Such chemicals may promote obesity by increasing the number
of fat cells, changing the amount of calories burned at rest, altering energy balance, and altering the
body’s mechanisms for appetite and satiety. Fetal and infant exposure to such chemicals may result in
more weight gain per food consumed and also possibly less weight loss per amount of energy expended.
The health eects of these chemicals during fetal and infant development may persist throughout life,
long after the exposures occur.
97
Research on such chemicals suggests that the origins of obesity may lie not only in well-established
risk factors such as diet and exercise, but also in the interplay between genes and the fetal and early
postnatal environment. The National Institute of Environmental Health Sciences, the Environmental
Protection Agency (EPA), and other research organizations have been working to understand the devel-
opmental origins of obesity and other diseases. Their activities have helped reveal the links between
environmental chemicals and obesity and diabetes, providing a sucient base of evidence to warrant
future research eorts in this area.
This issue could also be investigated further by the President’s Task Force on Environmental Health
Risks and Safety Risks to Children, led by HHS and EPA. An increased understanding of chemical toxicity
also adds strength to the existing recommendations for parents to avoid microwaving baby bottles or
plastic containers that are not explicitly stated by the manufacturer as safe for use in microwaving.
98
Government should work closely with industries to translate this emerging science into programs that
supports product reformulation (for example, of plastic containers) as appropriate.
Recommendations
Recommendation 1.7: Federal and State agencies conducting health research should prioritize
research into the eects of possibly obesogenic chemicals. As the research becomes clearer, reducing
harmful exposures may require outreach to communities and medical providers, and could also entail
regulatory action.
SO LVI N G THE P RO BLEM OF CH I LDH O OD OB E SI T Y
18
★ ★
Benchmarks of Success
A stronger knowledge of chemical exposures that may be related to obesity. Emerging research will
guide the direction of future intervention strategies for which progress metrics can then be developed.
The necessary research will control the timeline for at least the rst 4-5 years. After that time, while
research eorts will continue, there may be sucient information to develop strategies to eliminate
exposures identied as obesogenic.
D. Screen Time
The American Academy of Pediatrics (AAP) recommends that children two years old and under should
not be exposed to television, and children over age two should limit daily media exposure to only 1-2
hours of quality programming.
99
In contrast to these recommendations, one study found that 43% of
children under age two watch television daily, and 26% have a television in their room.
100
Preschool aged children are also watching more television than recommended by the AAP. Ninety per-
cent of children ages 4-6 use screen media for an average of two hours per day. Over 40% of children in
this age group have a television in their bedroom, a third have a portable DVD player, and a third have a
portable handheld video game player. Children from lower income families and children of color spend
more time watching television and are more likely to live in a home where it is left on most of the time.
101
Studies show an association between television viewing and risk of being overweight in preschool
children, independent of socio-demographic factors. Specically, for each additional hour of television
viewing, the odds ratio of children having a BMI greater than the 85th percentile was 1.06.
102
Having
a television in the bedroom had a stronger association, with an odds ratio of 1.31. One study noted
that preschool children who watched television for more than two hours a day were more likely to be
overweight than children who watched television two hours or less daily.
103
Television viewing is also linked to dietary intake. Another study found that television exposure was
correlated with fast-food consumption in preschool children, even after adjusting for a variety of socio-
demographic and socio-environmental factors.
104
Recommendations
Recommendation 1.8: The AAP guidelines on screen time should be made more available to parents,
and young children should be encouraged to spend less time using digital media and more time being
physically active. Health care provider visits and meetings with teachers and early learning providers
are an opportunity to give guidance and information to parents and their children.
Recommendation 1.9: The AAP guidelines on screen time should be made more available in early
childhood settings. Early childhood settings should be encouraged to adopt standards consistent with
AAP recommendations not to expose children two years of age and under to television, as well as to limit
media exposure for older children by treating it as a special occasion activity rather than a daily event.
I. EA RLY CHI LDH O OD
19
★ ★
E. Early Care and Education
More than 3.5 million children under age ve are cared for in child care centers, and many more are
cared for through less formal arrangements while a parent works.
105
Children in child care centers
spent an average of 33 hours a week in those settings.
106
Parents and child care providers are sharing
the responsibility for a large and growing number of children during important developmental years.
Early childhood settings, including both child care centers and informal care, present a tremendous
opportunity to prevent obesity by making an impact at a pivotal phase in children’s lives.
Physical Activity
Young children need opportunities to be physically active through play and other activities. Physical
activity assists children in obtaining and improving ne and gross motor skill development, coordina-
tion, balance and control, hand-eye coordination, strength, dexterity, and exibility—all of which are
necessary for children to reach developmental milestones.
Preschool years, in particular, are crucial for obesity prevention due to the timing of the development
of fat tissue, which typically occurs from ages 3-7. During these preschool years, children’s BMI typically
reaches its lowest point and then increases gradually through adolescence and most of adulthood.
However, if this BMI increase begins before ages 4 to 6, research has suggested that children face a
greater risk of obesity in adulthood.
107
Features of the child care center environment, including policies regarding activity and provider training,
as well as the presence of portable and xed play equipment, inuence the amount of physical activity
children engage in while at child care.
108
Healthy Eating
Eating well is equally important for the healthy development of young children, and research has shown
that public programs can improve the nutritional quality of the food consumed in child care settings.
Children in early childhood settings who are served by USDA’s Child and Adult Care Food Program
(CACFP) eat healthier food than children who bring meals and snacks from home.
109
A comparison of
meal quality among licensed early learning sites in California found that children eating meals provided
in Head Start had the highest meal quality scores, followed by those eating in non-Head Start under
CACFP. Meal quality scores were higher among center-based versus home-based facilities.
110
Many programs have already seized the opportunity to provide healthier foods and have implemented
evidence-informed initiatives that encourage healthy eating and fun, developmentally-appropriate
physical activity. Still, there is room for improvement.
111
Empirically-based and practice-tested strate-
gies for improving these settings have been identied and provide a basis for the recommendations
outlined in this chapter. Through concerted and coordinated eort at the Federal, state, and local levels,
today’s early learning settings can support healthy weight through the development of good habits for
nutrition, physical activity, and screen time.
Each state creates and enforces its own child care licensing standards, as well as other program standards
for center-based and family child care homes. Not all child care facilities are required to be licensed in
SO LVI N G THE P RO BLEM OF CH I LDH O OD OB E SI T Y
20
★ ★
order to legally operate within a state, but they must meet some basic requirements. A recent review
of state child care regulations by researchers at the Duke University School of Medicine, based on ten
expert-derived healthy eating model regulations, found that states had an average of 3.7 healthy eating
regulations for child care centers and 2.9 for family child care homes. No state had all ten model regula-
tions. States had particularly few regulations relating to physical activity and screen time.
112
Workforce qualifications and training requirements for child care providers also vary widely from
state to state. Many states are now implementing Professional Development Registries and other
methods to better track and document the providers’ training sessions. They are also implementing
observation and feedback opportunities to understand if training is being applied in the classroom. To
incorporate recommended nutrition, physical activity, and screen standards into their curricula, Federal
agencies and states can partner with national organizations such as the National Association of Child
Care Resource and Referral Agencies (NACCRRA), the National Association for the Education of Young
Children (NAEYC), and the National Head Start Association (NHSA), as well as community colleges and
other training providers.
Parents are often unaware of quality elements when choosing child care and early education settings,
including the importance of nutrition, physical activity, and screen time limits provided in these settings,
and they can nd it dicult to get this information. Quality Rating and Improvement Systems (QRISs)
are State systems that rate the quality of early child care settings (which can include Pre-K, Head Start,
child care, and others) based on a clear, common set of criteria. These rating systems can provide parents
with reliable, consistent information that can help them make informed decisions.
Innovative Early Childhood Programs
There are several evidence-informed initiatives and interventions for early childhood settings to combat
childhood obesity, including:
• I am Moving, I am Learning, a proactive approach to childhood obesity in preschool classrooms that
seeks to increase moderate to vigorous physical activity every day, improve the quality of movement
activities intentionally planned and facilitated by adults, and promote healthy food choices. This
approach is implemented by Head Start and has been adopted by some other child care programs as
well.
• Nutrition and Physical Activity Self-Assessment for Child Care (NAP SACC), an assessment tool for child care
settings, which uses an organizational assessment of 14 areas of nutrition and physical activity policy,
practices and environments to identify the strengths and limitations of the child care facility. NAP SACC
also includes goal setting and action planning, continuing education and skill building for providers.
• Nemours Program: Delaware, under the leadership of Nemours,an integrated child health sys-
tem,launched a statewide,multi-sectorprogram to combat childhood obesitythat includes changes in
child care licensing to set healthy eating and physical activity standards, along with technical assistance,
training and practical toolkits tohelp providers implement the standards. The new standards apply to
all licensed center and family day care providers, impacting 54,000 children.
I. EA RLY CHI LDH O OD
21
★ ★
Recommendations
Recommendation 1.10: The Federal government, incorporating input from health care providers
and other stakeholders, should provide clear, actionable guidance to states, providers, and families
on how to increase physical activity, improve nutrition, and reduce screen time in early child care
settings.
Recommendation 1.11: States should be encouraged to strengthen licensing standards and Quality
Rating and Improvement Systems to support good program practices regarding nutrition, physical
activity, and screen time in early education and child care settings.
Both federal guidance and state policies and practices may be drawn from:
• The guidelines for Out-of-Home Child Care Programs that will be outlined in the soon-to-
be released third edition of Caring for our Children: National Health and Safety Performance
Standards.
113
These nationally recognized standards include health and safety practices such as
physical activity, nutrition, and limited screen time for children from birth to age 12 in all types
of early childhood settings.
• The National Association for Sport and Physical Education (NASPE) recommendation that all
children in full-day child care are provided at least 60 minutes of structured and unstructured
physical activity per day. Others have recommended that infants be provided opportunities
for gross motor activity, and should not be unnecessarily conned.
• The revised Head Start Program Performance Standards, which include recommendations for
health, nutrition, and physical environments.
Recommendation 1.12: The Federal government should look for opportunities in all early childhood
programs it funds (such as the Child and Adult Care Food Program at USDA, the Child Care and
Development Block Grant, Head Start, military child care, and Federal employee child care) to base
policies and practices on current scientic evidence related to child nutrition and physical activity,
and seek to improve access to these programs.
Benchmarks of Success
An increased number of states will adopt more stringent licensing standards that include nutri-
tion, physical activity, and screen time that align with Caring for our Children: National Health and Safety
Performance Standards, 3rd edition and coordinate across systems with Pre-K, Head Start, and child care.
New or enhanced data sources may be needed to monitor progress in this area.