Báo cáo " Sol-gel synthesis and particle size characterization of CdSe Quantum dots " ppt
Bạn đang xem bản rút gọn của tài liệu. Xem và tải ngay bản đầy đủ của tài liệu tại đây (115.6 KB, 5 trang )
VNU Journal of Science, Mathematics - Physics 25 (2009) 207-211
207
Sol-gel synthesis and particle size characterization of CdSe
Quantum dots
Khong Cat Cuong
1
, Trinh Duc Thien
1
, Pham Thu Nga
2
,
Nguyen Van Minh
1
, Nguyen Van Hung
2,
*
1)
Hanoi National University of Education, 136 Xuan Thuy Road, Cau Giay, Hanoi, Vietnam
2)
Institute of Materials Science, Hoang Quoc Viet Road, Hanoi, Vietnam
Received 9 November 2009; received in revised form 24 November 2009
Abstract. In this article, we report on the preparation of CdSe quantum dots (QDs) by sol-gel
method and their optical properties. The average size of QDs is also estimated by using various
ways, such as the Scherer’s formula, The Effros-Brus-Kayanuma’s theoretical expression, TEM
etc. The TEM images of samples show that the mean sizes of QDs are 4 nm. The mean sizes of
QDs are smaller than that of other methods and arranging from 2 to 3.6 nm.
1. Introduction
Size-dependent optoelectronic properties of CdSe quantum dots (QDs) make them ideal candidates
for tunable absorbers and emitters in application, such as nanoscale electronics, laser technology, and
biological fluorescent labeling.
The properties of QDs are strongly influenced not only by the composition and structure of the
matrix, but also by the preparation technique. The band-edge emission of CdSe QDs in a strongly
confined regime has been generally attributed to electron transitions from the highest occupied to the
lowest non-occupied molecular orbital [1]. Therefore, there exist many methods that have been
applied to synthesize CdSe quantum dot. A variety of methods has been employed to synthesize
semiconductor nanorods in recent years. These methods include the hot coordination solvents method
using tri-n-octylphosphine oxide (TOPO) and trioctylphosphine (TOP) [2], the hydrothermal or
solvothermal method [2,3] and the micelle or reverse micelle method [3]. The electrical and optical
properties of nanoparticles are affected by the chemistry involved in their synthesis. Bottom-up
approaches such as those using surfactants or micelles as the regulating agents are very effective for
the synthesis of one-dimensional nanostructure because of their high efficiency, controllability,
simplicity and versatility. Hydrothermal techniques have been widely applied for the synthesis of
conventional and advanced materials. The advantages of this method include the relatively low
temperature required for processing, the possibility of controlling particle morphology and the good
crystalline of the products. Peng et al. first employed ammonium as a completing agent for cadmium
ions to synthesize cadmium selenide (CdSe) nanocrystals using the hydrothermal method. They found
that at 140 ◦C, CdSe with a mixed morphology of branch-shaped fractals and nanorods was produced,
______
*
Corresponding author. E-mail:
K.C. Cuong et al. / VNU Journal of Science, Mathematics - Physics 25 (2009) 207-211
208
and at 180 ◦C, the products were mainly CdSe nanorods [4]. Chen et al. used a cationic surfactant,
cetyltrimethyl ammonium bromide (CTAB) via a hydrothermal method at 180 ◦C to synthesize CdSe
nanorods. They found that the concentration of CTAB is a key parameter in the control of nanoparticle
morphology [5]. However, to investigate the size effect we need the sample with homogeneous
distribution in particle size. Besides that, the hydrothermal method requires the long time reaction and
its distribution in particle size is in the broadening range.
In this article, we report on the preparation of CdSe quantum dots (QDs) by sol-gel method and
investigate their optical properties. This is a new route to get CdSe QDs and also very economic. We
also estimate the average size of QDs by using various ways, such as the Scherer’s formula, The
Effros-Brus-Kayanuma’s theoretical experssion, TEM etc.
2. Experiment
The method used to prepare QDs CdSe was presented in previous paper [6]. The crystalline
processes happened from 1 to 15 minutes, and QDs CdSe were dispersed in toluen solvent.
Powder X-ray diffraction (XRD) patterns were recorded using a D 5005 (Siemens) X-ray
diffractometer using CuKα radiation (λ = 0.15406 nm). Transmission electron microscopy (TEM) was
carried out using a microscope. Ultraviolet–visible (UV–vis) absorption spectra of the nanoparticles
were recorded by using a Jasco V670 spectrophotometer.
3. Result and discussion
To calculate the particle size of QDs we use some following models:
+ Using absorption spectra to estimate the mean sizes of QDs:
The Effros, Brus and Kayanuma’s theoretical expression shows the relation between mean size
and specific parameters of QDs [7]:
()
*
y
B
*
y
2
B
*
y
2
gg
R248,0
a
a
R786,1
a
a
REaE −
−
π+=
(1)
where E
g
(a) is the effective band gap of QDs with radius of a, the band gap E
g
, Bohr exciton radius
a
B
and Bohr exciton energy
*
y
R are the specific parameters of bulk material. From absorption
spectra, we can determine the E
g
(a) of QDs, hence can estimate the mean size of QDs.
From this formula, the standard curve and measured absorption spectra, we can estimate the mean
size of QDs.
Based on the analysis it has been expressed the experimental formula to estimate the mean sizes of
QDs CdSe as:
57,414277,0106242,1106575,2106122,1
233649
+−×+×−×=
−−−
λλλλD
(2)
where, D (nm) is the size of a given nanocrystal sample, and λ(nm) is the wavelength of the first
excitonic absorption peak of the corresponding sample.
+ The second one, we estimate the mean size of QDs by the Scherer’s formula [8]:
θ
λ
cos
D
k
r =
(3)
K.C. Cuong et al. / VNU Journal of Science, Mathematics - Physics 25 (2009) 207-211
209
where, D (rad) is the half width at half maximum
of the XRD peak; λ- the X-ray diffraction
wavelength (with radiation CuKα:
o
A5406,1=λ );
θ
: the diffractional angle and k- constant (k
= 0,9).
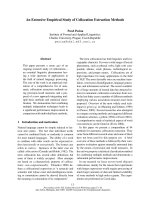
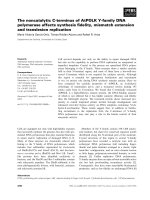
The structure and morphologies of the
CdSe nanoparticles were characterized using
transmission electron microscopy. The
morphologies of the CdSe nanoparticles were
mainly affected by the Cd:Se ratio, the reaction
temperature and time. From TEM image on fig.
1, we can see CdSe QDs are dispersed in
toluen solvent and have the spherical shapes
with the mean diameter of about 4 nm.
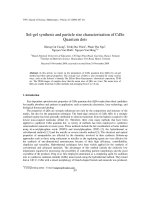
A typical XRD pattern from the prepared
CdSe nanoparticles and the positions of the X-
ray peaks for CdSe FCC are shown in Fig. 2. All the diffraction peaks from the CdSe nanoparticles are
consistent with the wurtzite structure of CdSe with measured lattice constants of a = 6.1 Å (this can be
compared to the lattice constants of a = 6,077 Å from JCPDS file No. 19-0191). The sharp diffraction
peaks also indicate that the products are highly crystalline. XRD analysis revealed no impurities such
as Se and SeO
3
in the sample.
As expected, the width of the diffraction peaks is considerably broadened and can be determined
easily because the size effect is exhibited very clear. By using the Scherrer formula, we can calculate
the mean sizes of the CdSe QDs from the peak width at half-maximum. Particle sizes obtained from
the width of the (111) diffraction are depicted in the table 1.
Table 1. Particle size of samples with reaction time 5 and 10 min
Samples
2θ
D (radian)
cosθ
d (nm)
5 minutes 25,381 0,0697 0,97555 2,039
10 minutes 25,402 0,06806 0,97553 2,088
These results show that the
particle sizes are about 2 nm.
When the crystalline time
increased from 5 to 10 minutes, the
peaks become broadening but not
very considerably.
The mean sizes of samples
obtained from XRD patterns are
smaller than those of these samples
obtained from TEM image. In this
method, we did not eliminate the
system standard error. In addition,
in this XRD method, the mean
sizes are obtained from all the
structural layers of samples
Fig. 1. TEM image of CdSe QDs.
10 20 30 40 50 60 70
5 min
10 min
CdSe FFC structure
Intensity (a.u.)
2 Theta (degree)
(111)
(220)
(311)
Fig. 2. XRD patterns of QDs CdSe with crystalline times of 5 and 10
minutes.
K.C. Cuong et al. / VNU Journal of Science, Mathematics - Physics 25 (2009) 207-211
210
involved diffraction process, so the results are the diameters of crystal cores. In the other methods,
there are some other objects which are involved in the shell of CdSe cores so it may be larger.
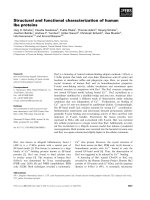
Fig. 3 shows absorption spectra, of the
prepared CdSe QDs. It can be seen from Fig. 3
that with increasing growing time, the redshift of
the spectra can be clearly observed and optical
absorption in the visible region due to CdSe QDs
is demonstrated. The average diameters of the
CdSe QDs for each growth time interval is
estimated using the effective mass approximation
giving diameters ranging from 2.2 nm to 2.6 nm.
These values are comparable to those obtained by
TEM and by the wavelength of the first excitonic
absorption peak (Table 2).
The deviation of the peaks in absorption
spectra is about 50 nm, which may be due to the
difference of surface states of these QDs. It is also
thought that the strong intensity from the CdSe
QDs can be attributed to their high crystallinity
[9], which is in good agreement with the XRD
patterns discussed earlier and the presence of good
surface states on the QDs.
Table 2. The parameters of the CdSe QDs vs. growing time
Ratio
Cd:Se
Name crystalline
time (minute)
The wavelength of the
first absorption excitonic
peak (nm)
The mean diameter of
CdSe QDs using formula
(1) (nm)
The mean diameter of
CdSe QDs using
formula (2) (nm)
CdSe 1 520 2.2 2.6
CdSe 5 557 2.5 3.2
CdSe 10 561 2.5 3.3
1 : 8
(260
o
C)
CdSe 15 574 2.6 3.6
Summary
In summary, QDs of CdSe with a diameter of 2.2 - 2.6 nm have been successfully synthesized
through a novel method at a relative low temperature. The morphologies of the prepared nanoparticles
can be controlled by the reaction time, the amount of Cd:Se ratio and the reaction temperature.
Acknowledgements. The authors express the sincere thanks to the NAFOSTED under Grant number
of 103.03.93.09 and Ministerial-level project of MOET for the financial support.
450 500 550 600 650
15 min
10 min
5 min
1 min
UV-Vis absorbance (a.u.)
Wavelength (nm)
Fig. 3. UV–vis absorption spectra of CdSe QDs with
various crystalline times.
K.C. Cuong et al. / VNU Journal of Science, Mathematics - Physics 25 (2009) 207-211
211
References
[1] Ekimov, J. Lumin. 70 (1996) 1; P.D. Persans, Au Tu, Y.J. Wu, M. Levis, J. Opt. Soc. Am. 6 (1989) 818.; V. Jungnickel,
F. Henneberger, J. Lumin. 70 (1996) 238; T. Arai, K. Matsuishi, J. Lumin. 70 (1996) 281; M. Kuno, J.K. Lee, B.O.
Dabbousi, F.V. Mikules, M.G. Bawendi, J. Chem. Phys. 106 (1997) 9869.
[2] X.G. Peng, L. Manna, W.D. Yang, J. Wickham, E. Scher, A. Kadavanich, A.P. Alivisatos, Nature 404 (2000) 59.
[3] L.F. Xi, Y.M. Lam, J. Colloid Interface Sci. 316 (2007) 771; M. Maillard, S. Giorgio, M.P. Pileni, Adv. Mater. 14
(2002) 1084.
[4] Q. Peng, Y.J. Dong, Z.X. Deng, Y.D. Li, Inorg. Chem. 41 (2002) 5249.
[5] M.H. Chen, L. Gao, J. Am. Ceram. Soc. 88 (2005) 1643.
[6] Khong Cat Cuong, Trinh Duc Thien, Pham Van Hai, Nguyen Phi Hung, Bui Thi Phuong Thanh, Nguyen Van Hung,
Pham Thu Nga, Vu Duc Chinh, Vu Thi Hong Hanh, Synthesis CdSe quantumdots and determine its size from optical
spectra, Advances in Optics Photonics Spectroscopy & Applications V (2008) 517.
[7] S.V.Gaponenko, Optical Properties of Semiconductor Nanocrystals, Cambridge University Press, 1998.
[8] Le Cong Duong, The structural analyze by X ray, Publishing House for Science and Technology Hanoi, 1984.
[9] R. Venugopal, P.I. Lin, C.C. Liu, Y.T. Chen, J. Am. Chem. Soc. 127 (2005) 11262.