Submarine Groundwater Discharge of Rare Earth Elements to a Tidal
Bạn đang xem bản rút gọn của tài liệu. Xem và tải ngay bản đầy đủ của tài liệu tại đây (1.58 MB, 17 trang )
Old Dominion University
ODU Digital Commons
OEAS Faculty Publications
Ocean, Earth & Atmospheric Sciences
2015
Submarine Groundwater Discharge of Rare Earth
Elements to a Tidally-Mixed Estuary in Southern
Rhode Island
Darren A. Chevis
Karen H. Johannesson
David J. Burdige
Old Dominion University,
Jianwu Tang
S. Bradley Moran
See next page for additional authors
Follow this and additional works at: />Repository Citation
Chevis, Darren A.; Johannesson, Karen H.; Burdige, David J.; Tang, Jianwu; Moran, S. Bradley; and Kelly, Roger P., "Submarine
Groundwater Discharge of Rare Earth Elements to a Tidally-Mixed Estuary in Southern Rhode Island" (2015). OEAS Faculty
Publications. 146.
/>
Original Publication Citation
Chevis, D. A., Johannesson, K. H., Burdige, D. J., Tang, J., Bradley Moran, S., & Kelly, R. P. (2015). Submarine groundwater discharge
of rare earth elements to a tidally-mixed estuary in Southern Rhode Island. Chemical Geology, 397, 128-142. doi: 10.1016/
j.chemgeo.2015.01.013
This Article is brought to you for free and open access by the Ocean, Earth & Atmospheric Sciences at ODU Digital Commons. It has been accepted for
inclusion in OEAS Faculty Publications by an authorized administrator of ODU Digital Commons. For more information, please contact
Authors
Darren A. Chevis, Karen H. Johannesson, David J. Burdige, Jianwu Tang, S. Bradley Moran, and Roger P. Kelly
This article is available at ODU Digital Commons: />
Chemical Geology 397 (2015) 128–142
Contents lists available at ScienceDirect
Chemical Geology
journal homepage: www.elsevier.com/locate/chemgeo
Submarine groundwater discharge of rare earth elements to a
tidally-mixed estuary in Southern Rhode Island
Darren A. Chevis a,⁎, Karen H. Johannesson a, David J. Burdige b, Jianwu Tang a, S. Bradley Moran c, Roger P. Kelly c
a
b
c
Department of Earth and Environmental Sciences, Tulane University, New Orleans, LA 70118, United States
Department of Ocean, Earth, and Atmospheric Sciences, Old Dominion University, Norfolk, VA 23529, United States
Graduate School of Oceanography, University of Rhode Island, Narragansett, RI 02882, United States
a r t i c l e
i n f o
Article history:
Received 10 October 2014
Received in revised form 11 January 2015
Accepted 18 January 2015
Available online 31 January 2015
Editor: Carla M Koretsky
Keywords:
Rare earth elements
Submarine groundwater discharge
Nd paradox
a b s t r a c t
Rare earth element (REE) concentrations were analyzed in surface water and submarine groundwater within the
Pettaquamscutt Estuary, located on the western edge of Narragansett Bay in Rhode Island. These water samples
were collected along the salinity gradient of the estuary. Rare earth element concentrations in the majority of
the groundwater samples are substantially higher than their concentrations in the surface waters. In particular,
Nd concentrations in groundwater range from 0.43 nmol kg−1 up to 198 nmol kg−1 (mean ± SD = 42.1 ±
87.2 nmol kg−1), whereas Nd concentrations range between 259 pmol kg−1 and 649 pmol kg−1 (mean ±
SD = 421 ± 149 pmol kg−1) in surface waters from the estuary, which is, on average, 100 fold lower than
Nd in the groundwaters. Groundwater samples all exhibit broadly similar middle REE (MREE) enriched shalenormalized REE patterns, despite the wide variation in pH of these natural waters (4.87 ≤ pH ≤ 8.13). The
similarity of the shale-normalized REE patterns across the observed pH range suggests that weathering of accessory
minerals, such as apatite, and/or precipitation of LREE enriched secondary phosphate minerals controls groundwater REE concentrations and fractionation patterns. More specifically, geochemical mixing models suggest that the
REE fractionation patterns of the surface waters may be controlled by REE phosphate mineral precipitation during
the mixing of groundwater and stream water with incoming water from the Rhode Island Sound. The estimated
SGD (Submarine Groundwater Discharge) of Nd to the Pettaquamscutt Estuary is 26 ± 11 mmol Nd day−1,
which is in reasonable agreement with the Nd flux of the primary surface water source to the estuary, the Gilbert
Stuart Stream (i.e., 36 mmol day−1), and of the same order of magnitude for a site in Florida.
© 2015 Elsevier B.V. All rights reserved.
1. Introduction
Submarine groundwater discharge (SGD) is most commonly defined
as water that flows from the seafloor to the overlying marine water column on the continental margin, without regard to the origin or composition of the fluid (Burnett et al., 2003). Thus, SGD can be driven by several
mechanisms, including terrestrial hydraulic gradients, tidal and wave
action, temperature and density differences, and bioirrigation (Li et al.,
1999; Kelly and Moran, 2002; Michael et al., 2005; Moore and Wilson,
2005; Martin et al., 2007; Smith et al., 2008a,b). Through the use of geochemical tracers such as 222Rn and radium isotopes, a number of studies
have shown that SGD can contribute a substantial amount of water to the
coastal ocean, which can be of similar magnitude as river input (Cable
et al., 1996; Moore, 1996, 2010; Moore et al., 2008). Specifically, Moore
(2010) reported that the annual average SGD flux to the South Atlantic
Bight on the southeastern coast of the U.S.A. is three times greater than
riverine supply in this region. Furthermore, SGD has also been reported
to be an important source of nutrients and trace elements to the coastal
⁎ Corresponding author.
E-mail address: (D.A. Chevis).
/>0009-2541/© 2015 Elsevier B.V. All rights reserved.
ocean (Kelly and Moran, 2002; Duncan and Shaw, 2003; Charette and
Sholkovitz, 2006; Johannesson et al., 2011).
Recently, Johannesson and Burdige (2007) examined the contribution of SGD to the flux of rare earth elements (REEs) to the coastal
ocean and suggested that SGD may be a source of the missing Nd
required to resolve the “Nd Paradox”. Resolving the “Nd Paradox”,
which refers to the apparent decoupling of the Nd concentration
profiles and present-day Nd isotopic measurements, εNd(0), in the
ocean (Bertram and Elderfield, 1993; Jeandel et al., 1995; Goldstein
and Hemming, 2003), is important because Nd isotopes are widely
used to investigate past changes in ocean circulation over glacial–
interglacial periods (Frank, 2002; Goldstein and Hemming, 2003; Via
and Thomas, 2006; Muinos et al., 2008). Johannesson and Burdige
(2007) computed a mean Nd concentration and εNd(0) value by
employing data from previous studies of terrestrial groundwater, together with an estimate of the terrestrial SGD volumetric flow rate, to
compute an SGD Nd flux. The computed SGD Nd flux by Johannesson
and Burdige (2007) is similar to the “missing Nd” flux that Tachikawa
et al. (2003) and Arsouze et al. (2009) proposed was needed to balance
the ocean Nd budget. Despite the relatively good agreement between
the “missing Nd flux” and the estimated terrestrial SGD Nd flux,
D.A. Chevis et al. / Chemical Geology 397 (2015) 128–142
Johannesson and Burdige (2007) did not explicitly account for the
recirculated, saline SGD component (marine SGD) of total SGD, which
can be important for some trace elements such as Fe (Taniguchi et al.,
2002; Roy et al., 2010, 2011), nor did they measure Nd in actual SGD.
Recent investigations of REEs that account for the terrestrial and
marine components of SGD indicate that SGD is an important source
of REEs to the overlying surface waters (e.g., Duncan and Shaw, 2003;
Johannesson et al., 2011; Kim and Kim, 2011, 2014; Chevis et al., in
review). Duncan and Shaw (2003) reported, for example, that SGD
exiting the North Inlet surficial aquifer, South Carolina, exhibits an increase in REE concentration with salinity. Lower salinity groundwaters
of the North Inlet surficial aquifer display shale-normalized HREEenriched patterns that differ from the primarily LREE-enriched high
salinity groundwaters. Submarine groundwater discharge of the REEs
to the Indian River Lagoon along Florida's Atlantic coast appears to
originate from two distinct sources: a HREE-enriched flux derived
from the advection of terrestrial groundwater; and a LREE-enriched
flux derived from bioirrigation of marine porewater (Johannesson
et al., 2011; Chevis et al., in review). The cycling of REEs in the Indian
River Lagoon is closely linked to the Fe cycle in contrast to the North
Inlet where REEs are instead released due to degradation of REE-rich,
relic terrestrial organic carbon (Duncan and Shaw, 2003). More recently,
Kim and Kim (2011, 2014) showed that SGD was a major source of REEs
to local coastal waters off Jeju Island, Korea. All of these studies point to
the need for further investigation of SGD REE fluxes to ultimately compute a global SGD flux of these important trace elements to the ocean.
In this study, we present REE data in surface water and groundwater
of the Pettaquamscutt Estuary, Rhode Island, USA, and evaluate the
cycling of REEs in the underlying subterranean estuary. Local aquifers
consist of fractured Proterozoic and Paleozoic crystalline bedrock and
associated overlying glacial deposits (Hermes et al., 1994), and thus differ lithologically from other sites investigated to date (i.e., North Inlet,
South Carolina; Indian River Lagoon, Florida; Jeju Island, South Korea).
Hence, the subterranean estuary associated with the Pettaquamscutt
Estuary represents a system underlain by old, felsic igneous and related
metamorphic rocks and associated glacial sediments, where the REE
behavior and SGD fluxes can be compared with our previous work in
the Holocene, mixed carbonate-siliciclastic system (i.e., Anastasia Formation) of the Indian River Lagoon, Florida, USA (Johannesson et al.,
2011; Chevis et al., in review).
2. Field site
The Pettaquamscutt Estuary is located on the western edge of
Narragansett Bay in the State of Rhode Island (Fig. 1). The average
depth of the estuary is 2 m; however, there are two deep, stratified anoxic basins, located north of Station 3 (Sta. 3; Fig. 1), with average
depths of ~ 20 m (Kelly and Moran, 2002, and references within). The
majority of the associated drainage basin consists of glacial outwash
and till deposited on top of Pennsylvanian metasedimentary rocks of
the Rhode Island Formation (Hermes et al., 1994; Boothroyd and
August, 2008; Nowicki and Gold, 2008). Late Proterozoic (~ 630–
600 Ma) felsic intrusive rocks of the Esmond Igneous Suite characterize
the northwestern and western portions of the drainage basin (Hermes
and Zartman, 1985; Hermes et al., 1994; Kelly and Moran, 2002). The
southern-most portion of the Pettaquamscutt Estuary is underlain by
the Permian Narragansett Pier Granite, which intrudes the Rhode Island
Formation (Zartman and Hermes, 1987).
The Gilbert Stuart Stream is the predominant surface source of freshwater to the Pettaquamscutt Estuary, and is estimated to discharge
~ 1 × 10⁸ L day− 1 of water to the estuary (Siffling, 1997). Estuarine
circulation within the Pettaquamscutt Estuary is tidally controlled and
the tidal prism volume is estimated at 1 × 10⁹ L (Siffling, 1997; Kelly
and Moran, 2002). Early estimates of groundwater discharge to the
Pettaquamscutt, based on tidal exchange (Siffling, 1997) and hydrologic
modeling (De Meneses, 1990) suggest that groundwater could account
129
for 50%–60% of the freshwater input to the estuary. Kelly and Moran
(2002) employed 226Ra and 228Ra to estimate the magnitude of the
SGD flux to the estuary and showed that it varies seasonally with
the highest input of SGD occurring in the summer months
(1.2 × 10⁷–3.78 × 10⁷ L day− 1) and the lowest SGD input occurring
during the winter (0.4 × 10⁷–1.3 × 10⁷ L day−1). Using water residence
times in the Pettaquamscutt Estuary ranging between 7 and 20 days
(based on Ra isotope analysis and tidal prism calculations), Kelly and
Moran (2002) estimated that the average yearly volume of SGD entering
the estuary is computed to range from 3.2 × 10⁹ to 9.4 × 10⁹ L. These SGD
estimates to the estuary are broadly similar to an independent estimate of
the aquifer recharge balance in the drainage basin (10 × 109 L; Kelly and
Moran, 2002) suggesting that the system is in balance.
3. Methods
3.1. Sample collection
Groundwater and surface water samples were collected in October
2010 from the same locations previously sampled by Kelly and Moran
(2002) (Fig. 1). Groundwater samples were collected from depths of
less than 2 m below the surface using a drive-point piezometer. A peristaltic pump was employed to extract groundwater through previously
cleaned, acid-washed Teflon® tubing attached to the tip of the drivepoint. For groundwaters and surface waters, 1 L of water was filtered
through 0.45 μm (pore-size) in-line filter cartridges (Gelman Science,
polyether sulfone membrane) attached to the output end of the Teflon®
tube, and collected into acid-cleaned HDPE bottles in the field after first
rinsing the bottle three times with the filtered water to condition the
bottle (Johannesson et al., 2004). All water samples for REE analysis
were sealed in two Ziplock®-style polyethylene bags for transport
back to the clean laboratory of the Graduate School of Oceanography
(GRO) of the University of Rhode Island acidified to pH b2 with ultrapure HNO3 (Seastar Chemicals, Inc., Baseline) using ultra-clean procedures (Johannesson et al., 2004) within 5 h of collection. Along with
the REE samples, ~125 mL of water at each sampling site was similarly
collected for major cation (Ca2+, Mg2+, Na+, K+) and for major anion
(Cl−, SO2−
4 ) analysis. Major cation samples were acidified with a drop
of ultra-pure HNO3 (Seastar Chemicals, Inc., Baseline), but the anion
samples were not acidified. For DOC analysis, a small aliquot of each filtered sample was taken with a 50 mL polypropylene syringe and stored
in a cooler for transport to the laboratory at the GRO of the University of
Rhode Island. Once at the laboratory, 5 mL of each sample was placed in
individual 10 mL glass ampules (cleaned and precombusted in a muffle
furnace prior to use) and acidified with 50 μL of 6 M HCl. The ampules
were then torched sealed and stored refrigerated until the time of
analysis.
3.2. Sample analysis
Major solutes (Ca2+, Mg2+, Na+, K+, Cl−, SO2−
4 ) were measured in
pore and surface waters by ion chromatography (Dionex DX300) at
The Ohio State University following the procedure of Welch et al.
(1996). Alkalinity was titrated in the field on filtered water samples
using a “digital” titrator (Hach, Model 16900) and either 0.8 M or
0.08 M H2SO4. Measurements for dissolved Fe (II), total Fe, and ΣS(-II)
(=H2S + HS− + S2− + …) in the groundwater samples were quantified in the field using a Hach© 2800 portable spectrophotometer
(Haque et al., 2008; Willis and Johannesson, 2011). Dissolved Fe (II)
was determined using the 1, 10-Phenanthroline method, and total dissolved Fe was determined by the FerroVerr method (Eaton et al.,
1995a). The method detection limits for the Fe (II) and total Fe methods
are 0.36 μmol kg− 1 and 0.16 μmol kg−1, respectively (Eaton et al.,
1995a). Dissolved S (-II) was measured by the methylene blue method
(Eaton et al., 1995b). The detection limit for the methylene blue method
is 0.29 μmol kg−1 of S (-II) (Cline, 1969; Eaton et al., 1995b). Dissolved
130
D.A. Chevis et al. / Chemical Geology 397 (2015) 128–142
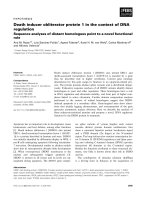
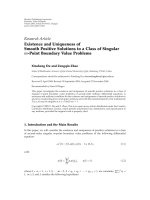
Fig. 1. Map of the Pettaquamscutt Estuary with sampling sites marked. The groundwater samples are the blue dots labeled A–E. The estuary surface water sites are labeled Sta. 1–5. Sta. R is
the sample of the Gilbert Stuart Stream.
organic carbon concentrations were quantified at Old Dominion
University by high temperature combustion using a Shimadzu TOC-V
total carbon analyzer.
For the REE analyses, approximately 60 mL of each sample was
passed through Bio-Rad® Poly-Prep columns packed with ~ 2 mL
of Bio-Rad® AG 50 W-X8 (100–200 mesh, hydrogen form) cationexchange resin to separate the REEs from the major dissolved solutes
(Greaves et al., 1989; Johannesson et al., 2005, 2011). Two 3 mL
acid rinses of 1.75 M ultra-pure HCl and 2 M ultra-pure HNO3 were
performed to elute Fe and Ba, respectively, from the columns. The
REEs were then eluted from each column with 10 mL of 8 M ultrapure HNO3, and the eluted solutions collected in Teflon® beakers.
The sample was evaporated to dryness and subsequently taken up
in 10 mL of a 1% v/v ultra-pure HNO3 solution. Because of high total
REE concentrations, groundwater samples B, C, and D were rerun
using ferric iron coprecipitation (Wiesel et al., 1984; Welch et al.,
1990). Here, 200 μL of an ~ 1 M ferric nitrate solution was added to
50 mL of sample. Approximately 3 mL of ultra-pure ammonium hydroxide (30% v/v) was added to induce the precipitation of the dissolved iron. The samples were briefly shaken and left for an hour to
allow the precipitate to form. The samples were then centrifuged
and the supernatant was removed. The precipitate was rinsed with
Milli-Q water and then centrifuged again and the supernatant was
removed. The ferric hydroxide precipitate was then dissolved in
2 M HCl, and the resulting solution was then passed Bio-Rad®
Poly-Prep columns packed with ~ 2 mL of Bio-Rad® AG 50 W-X8
(100–200 mesh, hydrogen form) cation-exchange resin to separate
the REEs from the major dissolved solutes following the procedure
described above. The only difference was that the 1.75 M HCl rinse
was omitted due to the fact that the sample matrix was 2 M HCl and,
therefore, should prevent the Fe in solution from binding to the cation
exchange resin.
D.A. Chevis et al. / Chemical Geology 397 (2015) 128–142
Each water sample was spiked with 115In at 1 μg kg−1 for use as an
internal standard and run for the REEs by HR-ICP-MS (Thermo Fisher
Element II) at Tulane University. We monitored 139La, 140Ce, 141Pr,
143
Nd, 145Nd, 146Nd, 147Sm, 149Sm, 151Eu, 153Eu, 155Gd, 157Gd, 158Gd,
159
Tb, 161Dy, 163Dy, 165Ho, 166Er, 167Er, 169Tm, 172Yb, 173Yb, and 175Lu in
low and high-resolution modes. In addition, we also monitored 139La,
140
Ce, 141Pr, 143Nd, and 145Nd in low and medium-resolution modes
during the analyses. Although many of these isotopes are free of isobaric
interferences, monitoring them in medium or high-resolution in
addition to low-resolution helps to resolve mass interferences such as
those caused by BaO+ on the Eu isotopes, and LREEO+ on isotopes of
the HREEs. The HR-ICP-MS was calibrated with a series of REE calibration standards (i.e., 5, 20, 100, 500, 1000 ng kg−1) that were prepared
from NIST traceable High Purity Standards (Charleston, SC). Check
standards for the REEs were also prepared using Perkin-Elmer multielement solutions. The Canadian Research Council Standard Reference
Material (SRM) for estuarine waters (SLEW-3) was analyzed as an additional check for accuracy by comparison to the measured REE values for
SLEW-3 reported by Lawrence and Kamber (2006). Analytical precision
of REE analyses was always better than 5% relative standard deviation
(RSD), and generally better than 2% RSD.
3.3. Geochemical modeling
Rare earth element solution complexation modeling was carried out
for the broad range of ionic strength found in Pettaquamscutt waters
(0.06 M b I b 0.63 M; Table 1) by employing a combined specific ion interaction and ion-pairing model initially developed for the REEs by
Millero (1992). The model links the specific ion interaction approach
(Pitzer, 1979) with an ion pairing model (Garrels and Thompson,
1962; Millero and Schreiber, 1982), thus allowing for the evaluation of
REE complexation with inorganic ligands in dilute to highly saline natural waters (Johannesson and Lyons, 1994; Johannesson et al., 1996a,b).
The model was updated by adding the most recently determined stability constants for REE complexation with inorganic ligands (Lee and
Byrne, 1992; Schijf and Byrne, 1999, 2004; Klungness and Byrne,
2000; Luo and Byrne, 2001, 2004). Free concentrations of inorganic li2−
gands (e.g. [CO2−
3 ]F, [SO4 ]F) used in solution complexation modeling
were computed from the major solute composition of Pettaquamscutt
waters via the SpecE8 program of the Geochemist's Workbench® (release 7.0; Bethke, 2008) using the thermodynamic database from
PHRQPITZ (thermo_phrqpitz.dat; Plummer et al., 1989), and following
the approach outlined by Millero and Schreiber (1982). We did not
model REE complexation with naturally occurring organic ligands because previous laboratory investigations (e.g. Sonke and Salters, 2006;
Pourret et al., 2007; Marsac et al., 2010; Tang and Johannesson, 2010)
were conducted using background electrolyte solutions with ionic
strengths less than 0.1 M. It is not clear how to correct for ionic strength
131
effects on the activity coefficients of natural organic matter in simulations for the higher salinity waters of the Pettaquamscutt Estuary
(Remi Marsac, 2014, pers. comm.; Stephen Lofts, 2014, pers. comm.)
Geochemist's Workbench® (release 7.0; Bethke, 2008) was used to
construct a geochemical mixing model to examine the influence of SGD
on the shale-normalized REE fractionation patterns of the Pettaquamscutt
surface estuary waters. The Lawrence Livermore National Laboratory
data base provided with the software (i.e., thermo.dat; Delany and
Lundeen, 1989) was modified by adding the 14 naturally occurring
REEs and important solution complexation reaction with inorganic ligands (bicarbonate, carbonate, chloride, sulfate, hydroxide, phosphate,
and fluoride) using the most up-to-date stability constants (Lee and
Byrne, 1992; Schijf and Byrne, 1999, 2004; Klungness and Byrne,
2000; Luo and Byrne, 2001, 2004). To account for solubility limits on
REEs we also added the solubility products for the REE-phosphate
phases (i.e., LnPO4·nH2O) determined by Liu and Byrne (1997) to
thermo.dat. We assumed that groundwater with a composition identical to groundwater from site A best represents the SGD composition to
the surface estuary (Table 4). The composition of Rhode Island Sound
waters was modeled using the major solute and REE concentrations of
the Station 5 surface water sample, and the Gilbert Stuart Stream
endmember was modeled using the measured REE concentrations of
this stream and assuming a major ion concentration similar to the Connecticut River (Table 4). This substitution of Connecticut River major
ion concentrations is reasonable to a first approximation because
broadly similar rock types characterize both drainage basins (Douglas
et al., 2002). Previously published phosphate data for groundwater, Gilbert Stuart Stream, and Rhode Island Sound were also employed in the
model (Kelly and Moran, 2002; Gaines and Pilson, 1972; Pilson, 1985;
Table 4).
4. Results
4.1. REE concentrations
Rare earth element concentrations for surface and groundwaters
from the Pettaquamscutt Estuary are presented in Table 2. Rare earth
element concentrations in the groundwaters of the Pettaquamscutt
Estuary are generally higher than those of the local surface waters.
The only exception is groundwater sample E, which has similar REE concentrations to the mean surface waters of the estuary. Unlike the surface
waters of the Pettaquamscutt Estuary, all of which have similar REE concentrations, the groundwaters from the subterranean estuary exhibit a
large range in their REE concentrations (Table 2). For example, Nd
concentrations of the groundwaters range from 0.43 nmol kg−1 up to
198 nmol kg− 1 (mean ± SD = 42.1 ± 87.2 nmol kg−1; Table 2). By
comparison, the Nd concentrations of the surface waters of the estuary
range from 259 pmol kg−1 to 649 pmol kg− 1 (mean ± SD = 421 ±
Table 1
Ancillary data for the surface and groundwaters of the Pettaquamscutt Estuary. Major ions, alkalinity, and DOC are in mmol kg−1. Fe2+, total Fe, and S(-II) are in μmol kg−1.
K
Mg
Ca
Cl
SO2−
4
pH
Alkalinity
Fe2+
Total Fe
S(-II)
DOC
Groundwaters
A
149
B
38.3
C
154
D
422
E
455
3.32
1.14
3.13
8.18
9.20
20.8
7.12
25.9
59.5
58.9
2.22
1.36
2.44
6.10
7.27
179
40.2
175
448
449
5.47
2.95
5.90
24.6
24.4
6.49
4.78
8.13
6.57
7.47
8.41
0.08
12.2
10.9
2.84
BD
3.58
0.895
0.895
BD
BD
6.45
2.15
1.07
3.58
9.61
0.125
25.1
27.5
0.717
0.80
0.38
7.28
6.36
0.44
Surface waters
Sta. 1
225
Sta. 2
333
Sta. 3
332
Sta. 4
428
Sta. 5
437
a
Mean
333 ± 74
4.60
6.94
6.49
8.57
9.01
6.84 ± 1.46
30.4
48.3
47.2
56.9
55.1
46.8 ± 9.9
3.49
9.96
8.84
9.82
5.46
8.66 ± 2.88
251
333
346
453
460
344 ± 75
15.0
17.4
17.5
25.0
26.9
18.6 ± 4.0
8.04
7.98
7.95
?
8.04
7.99 ± 0.03
0.56
1.67
1.82
1.13
2.28
1.35 ± 0.51
Na
BD indicates below detection.
a
Weighted mean of the surface waters within the Pettaquamscutt Estuary (18.7% Sta. 1, 54.5% Sta. 2, 5.1% Sta. 3, and 21.7% Sta. 4).
0.001
0.08
0.31
0.15
0.18
827
1094
1883
2332
611
493
1482 ± 68.7
24.8
7.08
9.26
11.8
2.99
2.21
7.62 ± 0.66
64.8
38.1
54.6
70.1
21.7
16.5
45.2 ± 3.62
10.6
5.09
9.11
11.2
3.48
2.58
7.25 ± 0.60
64.5
31.6
60.9
80
23
16.7
48.2 ± 4.41
22.3
9.2
19.1
25
7.16
5.13
15.0 ± 1.39
Gilbert Stuart Stream sample.
Weighted mean of the surface waters within the Pettaquamscutt Estuary (18.7% Sta. 1, 54.5% Sta. 2, 5.1% Sta. 3, and 21.7% Sta. 4).
b
a
16.5
7.24
13
16.8
6.31
4.87
10.6 ± 0.79
12.2
6.38
8.94
11.5
5.74
4.4
7.90 ± 0.40
73.9
45.2
66.4
87.8
38.9
32
57.5 ± 3.36
367
385
552
649
312
259
473 ± 22.2
350
522
584
707
460
398
552 ± 15.0
Surface water
Sta. Ra
453
Sta. 1
378
Sta. 2
776
Sta. 3
927
Sta. 4
258
Sta. 5
211
b
Mean
597 ± 44.3
95.3
64.1
103
128
53.1
43.9
86.3 ± 4.87
91.4
39.3
76.7
104
39.2
31.5
63.0 ± 4.98
94.6
62.5
105
133
48.4
37.4
86.2 ± 6.30
0.019
2.4
0.058
0.078
0.0027
0.0027
0.13
16.7
0.429
0.581
0.015
0.014
0.02
3.19
0.074
0.092
0.0024
0.0027
0.14
26.1
0.593
0.659
0.016
0.016
0.047
9.76
0.224
0.222
0.0056
0.0055
0.04
8.74
0.231
0.191
0.0072
0.0072
0.035
3.75
0.202
0.16
0.01
0.01
0.25
36.4
1.33
1.11
0.059
0.058
1.37
198
5.67
5.12
0.43
0.43
2.06
475
11.6
14.8
0.07
0.071
Groundwater
A
1.4
B
364
C
4.44
D
4.13
E
0.31
E Dup.
0.31
0.31
58
1.38
1.3
0.081
0.081
0.24
46.4
1.26
0.956
0.039
0.039
0.25
50.4
1.3
1.08
0.048
0.049
Lu
Yb
Tm
Er
Ho
Dy
Tb
Gd
Sm
Eu
Nd
Pr
Ce
La
Table 2
REE concentrations and loading ratios for surface and groundwaters of the Pettaquamscutt Estuary. REE ground water concentrations are in nmol kg−1. REE surface water concentrations are pmol kg−1.
3
512
7.13
8.04
0.39
0.39
D.A. Chevis et al. / Chemical Geology 397 (2015) 128–142
Y
132
149 pmol kg−1). Therefore, the Nd concentrations of Pettaquamscutt
Estuary groundwaters are a factor of 100 greater, on average, than the
Nd concentrations of the surface waters.
Surface and groundwater samples from the Pettaquamscutt Estuary
have negative Eu anomalies (Table 3) that most likely reflect water–
rock interactions with the local bedrock and glacial deposits, all of
which are also characterized by negative Eu anomalies (e.g., Buma et al.,
1971; Taylor and McLennan, 1985; Maria and Hermes, 2001; Dorias,
2003; Schulz et al., 2008; Dorias et al., 2012). Furthermore, it is unlikely
that redox conditions are sufficiently reducing in the Pettaquamscutt subterranean estuary to reduce Eu3+ to Eu2+ (Sverjensky, 1984; Middelburg
et al., 1988; Leybourne et al., 2006; Leybourne and Johannesson, 2008). In
addition, geochemical modeling of Eh using the SpecE8 and Act1 program
of Geochemist's Workbench® (release 7.0; Bethke, 2008) further suggests that the redox conditions are not sufficiently reducing to form Eu2+.
Groundwaters from the Pettaquamscutt subterranean estuary display middle REE (MREE) enriched shale-normalized patterns, with
most of the samples having Gd/YbPAAS and Gd/NdPAAS ratios greater
than 1 (Fig. 2a; Table 3). In contrast, the surface waters generally exhibit
flat to slightly HREE enriched, shale-normalized fractionation patterns
(Fig. 2b; Table 3). The shale-normalized REE pattern of groundwater
sample E near the outflow of the Pettaquamscutt Estuary to Rhode
Island Sound exhibits an “M-shaped” pattern with depleted HREEs
and LREEs, positive Nd and Dy “anomalies”, and a concave upwards pattern between Nd and Dy (Fig. 2c). Duplicate analyses of groundwater E
produced identical, shale-normalized REE patterns, indicating that the
unusual REE fractionation pattern of groundwater E is indeed characteristic of groundwater from this location. The shale-normalized REE pattern of groundwater sample E is similar to Narragansett Bay water
collected from the surf zone at Station 5 (Sta. 5), approximately
0.2 km to the southeast (Figs. 1 and 2). Specifically, the shalenormalized REE pattern of Sta. 5 water also exhibits HREE and LREE
depletions and positive Nd and Dy “anomalies”. Furthermore, the
“M-shaped” shale-normalized REE patterns of the Sta. 5 water and
groundwater E differ from the HREE enriched coastal seawater of
Buzzard's Bay and Long Island Sound (Elderfield and Sholkovitz, 1987;
Sholkovitz et al., 1989; Fig. 2).
4.2. REE solution complexation
The results for the REE solution complexation modeling for the
surface and groundwaters of the Pettaquamscutt Estuary are presented
Table 3
Shale-normalized fractionation factors, Ce-(Ce/Ce*), and Eu-anomalies (Eu/Eu*) for
surface and groundwaters of the Pettaquamscutt Estuary.
(Gd/Nd)PAAS
(Gd/Yb)PAAS
Ce/Ce*
Eu/Eu*
Groundwater
A
B
C
D
E
E Dup.
1.46
1.95
1.85
1.55
0.74
0.74
1.17
1.69
1.78
1.00
1.60
1.62
0.72
0.74
1.06
1.45
1.01
1.01
0.61
0.38
0.67
0.68
0.94
0.92
Surface water
Sta. Ra
Sta. 1
Sta. 2
Sta. 3
Sta. 4
Sta. 5
Meanb
2.07
0.85
1.16
1.33
1.04
1.01
1.08
0.85
0.62
0.85
0.90
1.10
1.16
0.86
0.39
0.76
0.46
0.46
0.90
0.95
0.61
0.62
0.66
0.53
0.51
0.63
0.60
0.58
Ce/Ce* = CePAAS/(0.5 × LaPAAS + 0.5 × PrPAAS).
Eu/Eu* = EuPAAS/(0.5 × SmPAAS + 0.5 × TbPAAS).
PAAS = Post-Archean Australian Shale composite.
a
Gilbert Stuart Stream.
b
Weighted mean of the surface waters within the Pettaquamscutt Estuary (18.7% Sta. 1,
54.5% Sta. 2, 5.1% Sta. 3, and 21.7% Sta. 4).
D.A. Chevis et al. / Chemical Geology 397 (2015) 128–142
133
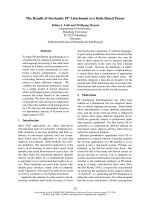
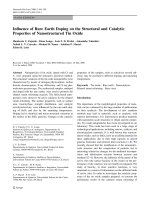
Fig. 2. REE patterns normalized to Post-Archean Australian Shale (PAAS; Nance and Taylor, 1976) for all surface and groundwaters presented in this study. (a) groundwaters A–D and
weighted mean of Pettaquamscutt Estuary surface water (18.7% Sta. 1, 54.5% Sta. 2, 5.1% Sta. 3, 21.7% Sta. 4, see text for details), (b) Pettaquamscutt Estuary surface waters, (c) coastal
groundwater discharging to (E and E Dup) and surface water (Sta. 5) of Rhode Island, and (d) Connecticut coastal seawater (Elderfield et al., 1990), Buzzards Bay, MA water column
(Sholkovitz et al., 1989), and Fisher's Island (Long Island Sound; Elderfield and Sholkovitz, 1987).
in Fig. 3. As mentioned above, major element data used in the model
calculations are given in Table 1. Model predictions for the majority of
the Pettaquamscutt waters suggest that REEs are predominately complexed with carbonate ions. For example, for groundwaters A and D,
which have pH values of 6.49 and 6.57, respectively, the model predicts
that carbonato complexes (i.e., LnCO+
3 , where Ln indicates any of the 14
naturally occurring lanthanides) predominate, accounting for 38% to
58% and 46% to 64%, respectively, of each REE in solution (Fig. 3). The
free metal ion, Ln3+, is also predicted to be important in these groundwaters, especially in the case of La, accounting for as much as 40% of La
in solution. For groundwaters C and E, Pettaquamscutt surface waters,
and Sta. 5 surface waters, the model predicts that REEs occur as both
the carbonato and dicarbonato complexes [i.e., Ln(CO3)−
2 ] in solution
(Fig. 3). Generally, dicarbonato complexes are predicted to increase in
importance with increasing pH of the subterranean and surface estuary
waters (Fig. 3). For example, groundwater C has the highest measured
pH of the Pettaquamscutt Estuary waters sampled (pH 8.13; Table 1),
and the model predicts that the REEs chiefly occur in this groundwater
as dicarbonato complexes (Fig. 3). As pH decreases, the relative amount
of each REE complexed as dicarbonato ions decreases as the relative
amount of each REE occurring as carbonato complexes increases
(Fig. 3). The primary exception is the acidic groundwater B sample
(pH 4.78) where the model predicts that REEs chiefly occur in solution
as free metal ion species, followed by sulfate complexes (Fig. 3).
We did not attempt to evaluate the possibility that REEs occur in
Pettaquamscutt Estuary groundwaters or surface waters complexed to
natural organic matter because it is not clear how to correct for ionic
strength effects on activity coefficients for natural organic matter in
simulations conducted for near seawater salinities.
5. Discussion
5.1. Controls on REE in Pettaquamscutt groundwater
Groundwaters from the Pettaquamscutt subterranean estuary
are characterized by MREE-enriched shale-normalized fractionation
134
D.A. Chevis et al. / Chemical Geology 397 (2015) 128–142
patterns [i.e., 0.74 ≤ (Gd/Nd)PAAS ≤ 1.95; 1.0 ≤ (Gd/Yb)PAAS ≤ 1.78] negative Eu anomalies [0.19 ≤ Eu/Eu* ≤ 0.47], and both small negative and
positive Ce anomalies [0.72 ≤ Ce/Ce* ≤ 1.45] (Fig. 2, Table 3). The MREEenriched fractionation patterns could reflect a number of processes including geochemical reactions occurring within the Pettaquamscutt
subterranean estuary between groundwater and aquifer minerals
(e.g., mineral dissolution/precipitation, ion-exchange), salt-induced coagulation and removal of REE-bearing Fe-organic colloids, or aqueous
complexation with ligands not included in the REE complexation
model (e.g., humic substances). Examining aqueous complexation
first, previous studies demonstrate that the predominate ligands
complexing REEs are dependent upon solution chemistry, especially
pH; therefore, the changes in solution composition that can occur
along groundwater flow paths can result in changes in solution complexation of REEs and presumably the REE fractionation patterns
(Johannesson et al., 1999, 2005; Dia et al., 2000; Tang and Johannesson,
2006; Tweed et al., 2006; Willis and Johannesson, 2011). A remarkable
feature of the Pettaquamscutt subterranean estuary is that the wide pH
range (4.78 ≤ pH ≤ 8.13; Table 1) exhibited by local groundwaters
does not appear to correlate with differences in the shapes of the shalenormalized REE patterns, despite the differences in the predicted aqueous complexation of the REEs in these groundwaters (Figs. 2 and 3). For
example, shale-normalized (Gd/Nd)PAAS and (Gd/Yb)PAAS ratios for the
acidic (i.e., pH 4.78) groundwater B are similar to those of alkaline
(i.e., pH 8.13) groundwater C (1.95 and 1.69 vs. 1.85 and 1.78, respectively; Table 3). The fact that groundwaters from the Pettaquamscutt
subterranean estuary all exhibit broadly similar, MREE-enriched
shale-normalized fractionation patterns independent of pH, and hence
inorganic aqueous complexation, suggests that solution complexation
reactions do not directly control the shale-normalized REE patterns of
these groundwaters. Nevertheless, solution composition in terms
of pH does appear to impart controls on the concentrations of REEs
in Pettaquamscutt Estuary groundwaters, as REE concentrations
are greatest in the acidic groundwater (pH 4.78) from location B
(Table 2). Specifically, the Nd concentration of groundwater B is
198 nmol kg− 1 compared to a mean ± SD Nd concentration of
3.15 ± 2.63 nmol kg−1 for the other Pettaquamscutt groundwaters,
which exhibit a mean ± SD pH of 7.15 ± 0.8. Many other researchers
(Johannesson et al., 1999, 2005; Dia et al., 2000; Tang and Johannesson,
2006; Tweed et al., 2006; Willis and Johannesson, 2011) have noted
the importance that pH plays in overall REE concentrations in natural
waters although it is recognized that the common inverse relationship
between pH and REE concentrations is complicated by the presence of
colloidal materials in natural waters (Goldstein and Jacobsen, 1987,
1988a; Elderfield et al., 1990).
Salt-induced coagulation of Fe-rich, organic colloids is recognized as
a major process that removes Fe and other trace elements, including the
REEs, as fresh river water mixes with seawater in surface estuaries
(e.g., Sholkovitz, 1976, 1978, 1992, 1993, 1995; Boyle et al., 1977;
Goldstein and Jacobsen, 1988b). The colloidal pool of REEs in many
rivers exhibits MREE-enriched patterns when normalized to shale composites (Elderfield et al., 1990; Åström and Corin, 2003; Stolpe et al.,
2013). Because we did not filter Pettaquamscutt Estuary surface or
groundwaters through filters with nominal pore sizes less than
0.45 μm, we cannot explicitly address the possible role that colloids
may play in influencing the REE concentrations and fractionation patterns of the Pettaquamscutt Estuary waters. Nevertheless, REE removal
via colloid coagulation in surface estuaries fractionates the REEs as the
LREEs are preferentially scavenged compared to the HREEs during the
process (Elderfield et al., 1990; Sholkovitz, 1992, 1995). Hence, saltinduced colloid coagulation and the resulting REE removal from
solution in low- to mid-salinity regions of surface estuaries lead to
shale-normalized REE patterns for the waters that are strongly enriched
in the HREEs. The fact that we see no fractionation of the REEs with
increasing salinity in the Pettaquamscutt subterranean estuary, but do
observe a decrease in REE concentrations with increasing salinity and
pH (e.g., r = − 0.67 for Nd vs. Cl−; Fig. 4), suggests that salt-induced
colloid coagulation is either not important in the subterranean estuary,
or if it is occurring, it does not fractionate the REEs. In either case,
additional field and laboratory investigations are required to address
these issues.
Therefore, we suggest that the MREE-enriched, shale-normalized
fractionation patterns that characterize groundwater from the
Pettaquamscutt Estuary likely reflect geochemical reactions occurring
in the subterranean estuary between the groundwater and aquifer minerals. One possible mineral phase influencing the shale-normalized REE
patterns of Pettaquamscutt groundwaters is apatite (Tricca et al., 1999;
Aubert et al., 2001; Hannigan and Sholkovitz, 2001). Both biogenic and
igneous apatites commonly exhibit enrichments in the MREEs when
normalized to shale composites such as PAAS (Hanson, 1980; Gromet
and Silver, 1983; Wright et al., 1984, 1987; Grandjean and Albarède,
1989; Grandjean-Lécuyer et al., 1993; Kemp and Truemann, 2003;
Leybourne and Johannesson, 2008). Moreover, apatite is a common accessory mineral in both the Esmond Igneous Suite and the Narragansett
Pier Granite (Hermes et al., 1994), and is expected to be present as a
trace mineral in the local glacial deposits. The solubility of apatite
increases with decreasing pH, and becomes substantial at pH less than
7 (Chaïrat et al., 2007). Consequently, apatite in contact with groundwaters A, B, and D, all of which have pH b 7, is expected to be susceptible to
dissolution reactions. Because the pH of groundwaters in the
Pettaquamscutt region is generally acidic (Rosenhein et al., 1968; Tim
Cranston, 2013, pers. comm.), conditions are expected to be suitable
for apatite dissolution within the surficial aquifer, especially where the
aquifer is recharged. Specifically, infiltration of acidic meteoric precipitation in conjunction with increased dissolved CO2 in soil zone waters,
owing to microbial respiration, can push the pH of recharge waters to
less than 5, which would favor apatite dissolution (Drever, 1997).
Apatite dissolution is not favored for groundwaters C and E, which
have more alkaline pH values (Table 1); however, the REEs could have
been released into the groundwater upgradient of the sampling locations. Instead, for these more alkaline groundwaters, the microbial
breakdown of organic material into organic acids may subsequently
facilitate apatite weathering (e.g., Taunton et al., 2000a,b; Welch et al.,
2002). The relative enrichment of MREEs in Pettaquamscutt groundwaters by apatite weathering may be further enhanced by the precipitation
of LREE bearing, secondary phosphate minerals such as rhabdophane
and florencite (Banfield and Eggleton, 1987; Braun et al., 1990, 1998).
For example, during rhabdophane precipitation, the LREEs between Ce
and Eu are preferentially removed from solution relative to heavier
REEs (Köhler et al., 2005).
Because many natural waters, including seawater, are saturated
with respect to REE-phosphate coprecipitates (i.e., LnPO4·nH2O), a
number of researchers have argued that dissolved REE concentrations
are limited by the solubility of these phases (Jonasson et al., 1985;
Byrne and Kim, 1993; Johannesson et al., 1995). Using REE-phosphate
solubility product data from Liu and Byrne (1997) and dissolved
inorganic phosphorus data for Pettaquamscutt groundwaters (Kelly
and Moran, 2002) and surface waters (Gaines and Pilson, 1972), we
computed saturation indices for Pettaquamscutt Estuary groundwaters
using Geochemist's Workbench® (release 7.0; Bethke, 2008). The
model calculations indicate that groundwaters discharging to the
Pettaquamscutt Estuary are all supersaturated with respect to the LREE-
Fig. 3. Results for REE complexation modeling for (a) Pettaquamscutt mean surface water. (b) Sta. 5, (c–g) groundwater samples A–E using the combined specific ion interaction and ionpairing model from Millero (1992) with the most recently determined stability constants for REE complexation with inorganic ligands (Lee and Byrne, 1992; Schijf and Byrne, 1999, 2004;
Klungness and Byrne, 2000; Luo and Byrne, 2001, 2004). The major ion and pH data used in the model are listed in Table 1. Plots show relative percent of each REE that occurs in solution as
a given aqueous complex.
D.A. Chevis et al. / Chemical Geology 397 (2015) 128–142
135
136
D.A. Chevis et al. / Chemical Geology 397 (2015) 128–142
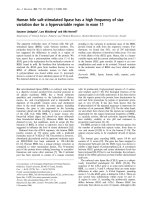
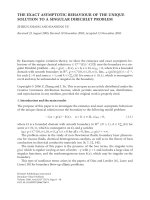
Fig. 4. REE vs. Cl− plots for Nd, Gd, and Yb for surface and groundwaters of the Pettaquamscutt estuarine system. Because no major ion data was available for the Gilbert Stuart Stream, the
average Cl− concentration for the Connecticut River is used (0.23 mmol kg−1; Douglas et al., 2002). Groundwater B values are not shown in this plot due to the fact that these values are
much higher than the other samples. Mean seawater values for Nd, Gd, and Yb are calculated from data in Piepgras and Jacobsen (1992), Westerlund and Öhman (1992), Sholkovitz et al.
(1994), German et al. (1995), Nozaki and Zhang (1995), Zhang and Nozaki (1996), and Nozaki and Alibo (2003). Solid lines represent the mixing lines that demonstrate surface waters
from Sta. 2 and 3 are a mixture of groundwater A and Rhode Island Sound waters (Sta. 5). The dashed line suggests that the northern most Pettaquamscutt surface water (Sta. 1) can be
explained as an ~50:50 mix of Gilbert Stuart Stream and Rhode Island Sound (Sta. 5).
and MREE-phosphate coprecipitates (i.e., LnPO4·nH2O) and groundwater
sample A is also supersaturated with respect to HREE-phosphate minerals
of the same form. In addition, all the Pettaquamscutt Estuary groundwaters, except for sample B and D, are supersaturated with respect to
hydroxyapatite (log (SI) values of 0.037, 4.21, and 7.36 for A, C, and E,
respectively). Although fluorapatite is the most common form of apatite
in the environment (Deer et al., 1992; Klein, 2002), because we did not
measure F− concentrations in the Pettaquamscutt waters, we cannot
evaluate the saturation indices for this mineral. Nevertheless, we interpret the supersaturation of Pettaquamscutt Estuary groundwaters with
respect to hydroxyapatite as evidence that these waters are also likely
supersaturated with respect to fluorapatite. Taken together the saturation index calculations suggest that REE-phosphate minerals like
rhabdophane and florencite, and/or REE-bearing apatite, control the
solubility limits of the REEs in groundwaters from the Pettaquamscutt
subterranean estuary.
Anthropogenic phosphorus may also influence the REE patterns of the
Pettaquamscutt groundwaters by enhancing the precipitation of phosphate minerals. Wastewater from industrial activities in the Narragansett
Bay has added excess phosphorus to the waters for 200 years (Nixon
et al., 2008). Although industry in the region has decreased since its
height during the early to mid-20th century, septic tanks, which are another source of phosphorus, are used extensively in the region for residential waste disposal (Nixon et al., 2008). The addition of phosphorus
that escapes from septic tanks into local groundwaters could potentially
enhance the LREE removal from groundwaters relative to MREEs and
HREEs because: 1) LREEs are typically more abundant than MREEs and
HREEs; and 2) the solubility products for LREE-phosphates are lower
than the corresponding MREE- and HREE-phosphates (Jonasson et al.,
1985; Liu and Byrne, 1997; Centiner et al., 2005).
Another process that likely exerts important controls on dissolved
REE concentrations in the Pettaquamscutt subterranean estuary is the
D.A. Chevis et al. / Chemical Geology 397 (2015) 128–142
reductive dissolution of Fe(III) oxides/oxyhydroxides contained within
the sediments. Previous work has demonstrated that Fe(III) oxides/
oxyhydroxides can exhibit MREE enriched, shale-normalized REE
fractionation patterns, and as a consequence, reductive dissolution
of these mineral phases could impart a MREE enriched signature to
the waters by releasing relatively more of the MREEs compared to
LREEs and HREEs upon dissolution (Johannesson and Lyons, 1995;
Johannesson and Zhou, 1999; Protano and Riccobono, 2002). Furthermore, positive Ce anomalies found in groundwater samples C and D
may be evidence for the reductive dissolution of Fe(III) oxides/
oxyhydroxides due to the fact that positive Ce anomalies are noted in
marine ferromanganese crusts and nodules (Elderfield, 1988; Byrne
and Sholkovitz, 1996; Bau, 1999). Rare earth elements in groundwaters
from the Pettaquamscutt Estuary correlate well with dissolved Fe2 +
(R2 value of 0.97 for Nd, Gd, and Yb; Tables 1 and 2) but exhibit weaker
relationships with total dissolved Fe (R2 value of 0.70 for Nd, Gd, and Yb
Tables 1 and 2). These correlations, however, are controlled solely by
one sample with much higher REE concentrations (groundwater B).
High DOC values in groundwater samples C and D may inhibit the
precipitation of Fe-sulfide minerals by the formation of Fe-organic
complexes (Luther et al., 1992), which further complicates the interpretation of these relationships. Geochemical modeling employing
Geochemist's Workbench® (release 7.0; Bethke, 2008) suggests that
groundwaters C and D are supersaturated with respect to Fe-sulfides
yet they have the highest dissolved sulfide concentrations. We interpret
the strong positive correlation of S(-II) and DOC (R2 = 0.92; Table 1)
in the Pettaquamscutt groundwaters as evidence for the inhibition of
Fe-sulfide precipitation by Fe-organic complexation.
5.2. Controls on REE in surface waters
The shale-normalized REE fractionation patterns of Pettaquamscutt
surface waters and plots of individual REE concentrations as a function
of Cl− concentrations, all suggest that mixing of SGD, Gilbert Stuart
Stream waters, and Rhode Island Sound waters occurs within the surface estuary (Figs. 2 and 4). Moreover, except for Station 1, the surface
waters of the Pettaquamscutt Estuary fall along mixing lines when individual REEs are plotted vs. the corresponding Cl− concentrations. Here
we use either Gilbert Stuart Stream water or groundwater A as the
freshwater endmembers and Rhode Island Sound as the marine
endmember (i.e., the Station 5 water; Fig. 4). The REE data are also consistent with the Pettaquamscutt Estuary not being well mixed over its
entire length. Specifically, the REE data suggest that surface waters
from Stations 2 and 3 are mixtures of equal parts groundwater A and
Rhode Island Sound water (Station 5), but surface water at Station 4 is
dominated by the influx of water from Rhode Island Sound (Fig. 4).
Kelly and Moran (2002) noted that the residence time of water north
of Station 3 was greater than the tidal cycle, whereas surface waters
south of Station 3 are well-mixed due to complete water exchange
over one tidal cycle. The observations of Kelly and Moran (2002) and
those presented in this study are in agreement with the general structure of the Pettaquamscutt Estuary, which consists of a northern,
fjord-like portion (north of Station 3) that contains two deep (~ 15–
20 m), anoxic saline basins that do not mix with the estuary except
during relatively rare overturn events, and a shallow (b 2 m) southern
portion that is well mixed (Gaines and Pilson, 1972). The surface
water at Station 1 falls in the middle of the mixing line between the
Gilbert Stuart Stream and Rhode Island Sound waters (Fig. 4), which
likely reflects the proximity of Station 1 to the mouth of the Gilbert
Stuart Stream (Fig. 1).
Based on the geographic distribution of the glacial deposits (see
Schafer, 1961a,b; Nowicki and Gold, 2008), as well as the cross plots
for Nd, Gd, and Yb, as a function of Cl− concentrations, we suggest
that groundwater discharging to the northwestern portions of the
Pettaquamscutt Estuary (groundwater A) accounts for the majority of
the SGD to this estuary. Groundwater A is the only groundwater sample
137
from the subterranean estuary that plots along the mixing line for the
Pettaquamscutt Estuary (Fig. 4). Groundwaters from both sites C and
D have REE concentrations that plot well above the mixing line indicating that these groundwaters, despite their high REE concentrations,
likely contribute little to the REE budget of the Pettaquamscutt Estuary.
The variation in the physical characteristics of the surficial aquifer
materials may explain why only groundwater A appears to influence
the REE budget of the surface estuary waters. Specifically, in the northwest portion of the Pettaquamscutt Estuary from where groundwater A
was collected, surficial sediments are composed of highly permeable
glacial outwash deposits and undifferentiated ice contact deposits
consisting of poorly sorted gravel, cobbles, and pebbles (Schafer,
1961a; Nowicki and Gold, 2008). In contrast, the eastern and southern
portions of the estuary where groundwaters C and D were collected
are underlain by a ground moraine deposit composed of compacted
till (Schafer, 1961b; Nowicki and Gold, 2008). The compacted till contains gravel, sand, and silt, which specifically makes it less permeable
than the glacial outwash and undifferentiated ice contact deposits of
the northwestern portion of the Pettaquamscutt watershed.
We performed two different simulations, one for the northern, fjordlike portion of the estuary, and the other for the well-mixed southern
part of the estuary. In each case the simulations were set up to reproduce the REE concentrations and shale-normalized REE fractionation
patterns of Pettaquamscutt Estuary surface waters from the northern
(Stations 2 and 3) and southern (Station 4) parts of the estuary by
mixing groundwater A, Gilbert Stuart Stream, and Rhode Island Sound
(i.e., Station 5) waters in various proportions (Table 4). For both
model simulations, equal portions of groundwater A and Gilbert Stuart
Stream water were used because Kelly and Moran (2002) reported
that the volume of groundwater discharged to the Pettaquamscutt is
roughly equal to the volumetric discharge from the Gilbert Stuart
Stream. Rhode Island Sound water was subsequently titrated into various mixtures of equal proportions of groundwater A and Gilbert Stuart
Stream to best reproduce the shale-normalized REE patterns of surface
Table 4
Major element and REE data employed in the mixing model in the form entered into the
React Program of the Geochemist's Workbench® (release 7.0; Bethke, 2008). Major element concentrations are all in mmol kg−1 except for P (μmol kg−1). REE concentrations
of Groundwater A are in nmol kg−1. Surface water REE concentrations (Gilbert Stuart
Stream and Rhode Island Sound) are in pmol kg−1.
pH
Ca
Mg
Na
K
Cl
HCO−
3
SO2−
4
P
La
Ce
Pr
Nd
Sm
Eu
Gd
Tb
Dy
Ho
Er
Tm
Yb
Lu
a
Groundwater Aa
Gilbert Stuart Streamb
Rhode Island Soundc
6.49
2.22
20.8
149
3.32
179
8.41
5.47
1.96
1.40
2.06
0.31
1.37
0.25
0.035
0.24
0.04
0.25
0.047
0.14
0.02
0.13
0.019
6.89
0.35
0.28
0.03
0.03
0.23
0.69
0.072
0.63
453
350
95.3
367
73.9
12.2
91.4
16.5
94.6
22.3
64.5
10.6
64.8
24.8
8.04
5.46
55.1
437
9.01
460
2.28
26.9
1.23
211
398
43.9
259
32
4.4
31.5
4.87
37.4
5.13
16.7
2.58
16.5
2.21
P concentration is from Kelly and Moran (2002).
Major element data is average Connecticut River values from Douglas et al. (2002).
P data is from Gaines and Pilson (1972).
c
Major element and REE data from Sta. 5 are used for Rhode Island Sound. P data for
Rhode Island are the values reported by Pilson (1985) for Narragansett Bay.
b
138
D.A. Chevis et al. / Chemical Geology 397 (2015) 128–142
waters of the northern and southern parts of the Pettaquamscutt
Estuary. Because of the differences in the hydrodynamics between the
northern, fjord-like and southern well-mixed parts of the estuary, the
mixing models required substantially different amounts of Rhode Island
Sound water to best reproduce the shale-normalized REE patterns of
Pettaquamscutt Estuary waters.
Fig. 5 presents the results of the mixing simulations. A satisfactory
match for the majority of the REEs (i.e., MREEs and HREEs) was obtained
for the northern, fjord-like part of the Pettaquamscutt Estuary by
employing a mixture of 25% groundwater A, 25% Gilbert Stuart Stream,
and 50% Rhode Island Sound water (Fig. 5a). Here, the average REE
concentration of surface waters from Stations 2 and 3 was used in the
model. The model does a good job of reproducing the MREE and HREE
concentrations and their associated, shale-normalized ratios, but
performs poorly for the LREEs (i.e., La–Sm). Nonetheless, the enhanced
removal of the LREE predicted by the model is not entirely unexpected
owing to the much lower solubility product values for the LREEphosphate phases compared to the MREE- and HREE-phosphate phases
(Liu and Byrne, 1997). The possible reasons for the discrepancy in the
removal of LREEs by phosphate phases between the mixing model and
the actual data are discussed below.
The mixing model for the southern portion of the Pettaquamscutt
Estuary was performed identically as for the northern part except
that the mixing proportions of the three endmembers required to
best reproduce the REE concentrations and shale-normalized REE
patterns of surface water from Station 4 were substantially different
than for surface waters from the northern part of the estuary. Specifically, the best match was obtained for a mixture of 2.5% groundwater A, 2.5% Gilbert Stuart Stream, and 95% Rhode Island Sound water
(Fig. 5b). Again, the mixing simulation was unable to match the LREE
Fig. 5. Panels (a) and (b) are the REE fraction patterns resulting from the mixing model for the Northern and Southern portions of the Pettaquamscutt Estuary, respectively compared to
their representative REE patterns. The mixing model in the Northern Pettaquamscutt is 25% groundwater A, 25% Gilbert Stuart Stream (Sta. R), 50% Rhode Island Sound. The mixing model
in the Southern Pettaquamscutt is 2.5% groundwater A, 2.5% Gilbert Stuart Stream (Sta. R), 95% Rhode Island Sound. Mean, high, and low refer to the solubility product values for REEphosphate phase used in each modeling simulation. The solubility products for the high and low simulations are the mean plus and minus the standard deviations reported in Liu and
Byrne (1997), respectively. Panels (c) and (d) are the results of the sensitivity analysis on the affect of P concentration to the mixing model for the northern and southern Pettaquamscutt
Estuary.
D.A. Chevis et al. / Chemical Geology 397 (2015) 128–142
concentrations and shale-normalized ratios of Station 4 water, but
does a reasonable job of reproducing the MREE and HREE concentrations (Fig. 5b).
To evaluate whether the mixing proportions suggested by the REEs
are reasonable, we compare the model predicted Cl− concentrations
to the measured Cl− for the surface waters. The REE mixing simulation
for the southern Pettaquamscutt Estuary produced a Cl− concentration
of 441 mmol kg−1 that is roughly equivalent to the concentration of
Station 4 (453 mmol kg− 1; Table 1), which we sought to reproduce
with this mixing simulation. For the northern portion of the estuary,
the predicted Cl− concentration of 275 mmol kg−1 is somewhat lower
than the average concentration of Stations 2 and 3 (~340 mmol kg−1;
Table 1). The difference in Cl− between the model and data for the
northern part of the estuary may be due to the use of Connecticut
River Cl− data in place of the Gilbert Stuart Stream. Despite the
discrepancy between the model output and the actual Cl− data
from the northern Pettaquamscutt Estuary, we submit that the
model results are reasonable to a first approximation when considering the constraints on available data (i.e., lack of Cl− data for Gilbert
Stuart Stream).
The apparent over-prediction of LREE removal by phosphate phases
may be due to the use of P concentrations in the model calculations that
are higher than the true values in Rhode Island Sound. The P data reported
by Pilson (1985) are from a site in the Narragansett Bay located north of
Rhode Island Sound; therefore, the value may not be representative of
the P concentrations in the sound. In order to test the sensitivity of the
mixing model to P concentrations, four additional simulations were run
using the mean values of the solubility products of REE-phosphate phases
from Liu and Byrne (1997) with P concentrations of 0.5 mmol kg−1 and
0.02 mmol kg−1 (detection limit for P analyses; Pilson, 2013) for both
portions of the estuary (Fig. 5c, d). The results of these simulations
are presented with the shale-normalized REE fractionation patterns
from the first simulation described above (i.e., P concentration of
1.23 mmol kg−1) and the measured data for the surface waters (Fig. 5c,
d). For the northern portion of the Pettaquamscutt Estuary, the mixing
model predicts enhanced LREE removal relative to the actual data at all
P concentrations (Fig. 5c). In the southern Pettaquamscutt Estuary, the
mixing model with a P concentration of 0.5 mmol kg−1 still shows enhanced LREE removal; however, at [P] = 0.02 mmol kg−1, the model
predictions for all 14 naturally occurring REEs are substantially
improved and closely match the actual measured concentrations
(Fig. 5d). The results of the sensitivity analysis presented here suggest
that the P in the Rhode Island Sound endmember must be at the
detection limit (0.02 μmol kg− 1) and that the P in the Gilbert Stuart
Stream and groundwater sample A influences the mixing model in the
Northern Pettaquamscutt.
The LREE removal in the mixing simulations may indicate that the
solubility product data presented by Liu and Byrne (1997) are not appropriate for these calculations. These researchers assumed congruent
REE-phosphate dissolution in their experiments, and consequently only
measured the PO3−
concentrations, and not the corresponding REE
4
concentrations, in their REE-phosphate dissolution experiments. Consequently, the substantially lower solubility products for the LREEphosphates compared to MREE- and HREE-phosphates determined by
Liu and Byrne (1997) could reflect the assumption of stoichiometric dissolution (e.g., Centiner et al., 2005). For example, the presence of trace
amounts of phosphate impurities in the REE phosphate minerals used
in the solubility experiments could alter the REE/P ratio in the dissolving
fluid, leading to higher PO3−
than Ln3+ concentrations in the experi4
mental solutions (Centiner et al., 2005). Furthermore, Köhler et al.
(2005) noted that during apatite dissolution experiments, secondary
phosphate minerals such as rhabdophane precipitated. Because
rhabdophane has an affinity for the LREEs, the precipitation of LREE
enriched secondary phosphates like rhabdophane during such experiments could affect the solubility constant calculations if stoichiometric
dissolution is assumed.
139
Table 5
The calculated SGD and river fluxes of REEs to the Pettaquamscutt in mmol day−1.
La
Ce
Pr
Nd
Sm
Eu
Gd
Tb
Dy
Ho
Er
Tm
Yb
Lu
a
b
SGD fluxa
River fluxb
26.2 ± 11.0
38.4 ± 16.2
5.78 ± 2.44
25.6 ± 10.8
4.73 ± 1.99
0.65 ± 0.27
4.51 ± 1.90
0.75 ± 0.32
4.72 ± 1.99
0.88 ± 0.37
2.64 ± 1.12
0.37 ± 0.16
2.33 ± 0.98
0.34 ± 0.15
45.3
35.0
9.53
36.7
7.39
1.22
9.14
1.65
9.46
2.23
6.45
1.06
6.48
2.48
Calculated using an average SGD flux of 6.8 × 10⁹ L yr−1.
Flux calculated using a discharge of 1 × 10⁵ m3 day−1 from Siffling(1997).
5.3. Submarine groundwater discharge of REE to Rhode Island Sound
The SGD flux of each of the REEs to the Narragansett Bay/Rhode
Island Sound was estimated following the same procedures described
in Kelly and Moran (2002) for the SGD nutrient fluxes. Specifically, the
volumetric flux of SGD (6.8 × 10⁹ L yr−1) used in our calculation is an
average of the annual groundwater discharge to the Pettaquamscutt Estuary determined using the tidal prism, and the estimated Ra residence
time of 8 days and 20 days by Kelly and Moran (2002). The shorter residence time of 8 days reflects a higher groundwater discharge rate necessary to account for the faster Ra removal due to tidal flushing (see
Kelly and Moran, 2002, for details). Again, we assumed that the composition of groundwater A is representative of the bulk of the SGD to the
Pettaquamscutt Estuary. The resulting estimates of the SGD flux of the
REEs are presented in Table 5. The estimated SGD flux of REEs to the
Pettaquamscutt Estuary ranges from 0.3 ± 0.1 to 38 ± 16 mmol day−1,
with the SGD flux for Nd estimated as 26 ± 11 mmol day−1 (Table 5).
The groundwater flux of Nd is roughly equivalent to the Nd flux from
the Gilbert Stuart Stream (36.7 mmol day−1). The REE fluxes presented
in Table 5 can be considered conservative estimates due to the fact that
the REE concentrations of groundwater A are much lower than the REE
concentrations of the other groundwaters sampled (Table 2). If the bulk
SGD to the Pettaquamscutt Estuary has higher REE concentrations than
those of groundwater A, then the SGD fluxes of REEs to the estuary
would be even greater than the estimates presented in Table 5.
The results of the SGD REE flux calculations for the Pettaquamscutt
Estuary compare well with the SGD REE fluxes calculated for the Indian
River Lagoon in Florida, where we computed an SGD flux of 7.69 ±
1.02 mmol day−1 (Chevis et al., in review). The SGD fluxes of Nd at
both of these sites are approximately equal to the local Nd flux of river
water Nd fluxes into the estuaries, but the Nd flux to the Pettaquamscutt
Estuary is over 3 times greater than that of the Indian River Lagoon. In
comparison, the SGD Nd flux estimated by Kim and Kim (2011) for Jeju
Island, Korea, is 5 orders of magnitude greater than the SGD Nd flux we
estimate for the Pettaquamscutt Estuary (Table 5). The discrepancy is
most likely due to the aquifer on Jeju Island being composed of young,
easily weathered basaltic rock fragments as opposed to the glacial deposits derived from Late Proterozoic and Paleozoic rocks that characterizes the Pettaquamscutt Estuary watershed. Furthermore, these
differences suggest that REE SGD fluxes are highly variable and depend
on the structure and composition of the subterranean estuary.
6. Conclusions
The rare earth element fractionation patterns for all the
Pettaquamscutt groundwater samples in this study have similar
140
D.A. Chevis et al. / Chemical Geology 397 (2015) 128–142
MREE-enrichments despite a wide range in REE concentrations. The
differences in pH among the Pettaquamscutt groundwaters influence
the REE concentrations without causing fractionation among the REE
suggesting that solution chemistry does not exert control on the REE
fractionation patterns. Removal by colloidal material and reductive dissolution of Fe oxides-oxyhydroxides do not appear to be important processes controlling REE behavior in the Pettaquamscutt. The weathering
of REE-bearing minerals such as apatite, accompanied by the precipitation of LREE-enriched secondary phosphate minerals such as
rhabdophane, probably exerts more controls on the REE patterns of
SGD within the Pettaquamscutt Estuary. The precipitation of the LREEenriched phosphate minerals may be enhanced by the addition of
anthropogenic phosphorus by septic tanks and remnants of industrial
activities around Narragansett Bay.
Groundwater from the northwestern portion of the estuary appears
to have the most influence on the REE patterns due to the higher
discharge volume from highly permeable glacial outwash and
undifferentiated ice contact deposits located in this portion of the
Pettaquamscutt watershed. Even though Pettaquamscutt groundwaters
do influence the surface water patterns, the surface water REE patterns
have flat to HREE enriched fractionation patterns. The evolution of these
surface water patterns is likely due to the continued precipitation of
LREE-enriched phosphate minerals.
The estimated SGD flux of Nd to the Pettaquamscutt Estuary using REE
concentration from the groundwater in the northwestern portion of the
estuary is roughly equivalent to that of the Gilbert Stuart Stream. The
similar fluxes from groundwater and river water to the Pettaquamscutt
are consistent with the findings in our previous investigation of REEs in
the SGD of the Indian River Lagoon in Florida, USA. The fact that the
SGD flux is of the same order of magnitude as the Gilbert Stuart Stream
points to the need for more REE and Nd isotopic studies in subterranean
estuaries in order to establish a global SGD flux of Nd to be employed in
determining the oceanic Nd budget.
Acknowledgments
This work was supported by NSF awards OCE-0825920 to
Johannesson and OCE-825895 to Burdige. We thank K.A. Welch, W.B.
Lyons, and S.A. Welch at Ohio State University for the major cation
and anion analyses. We also thank Remi Marsac and Stephen Lofts for
their helpful discussions on REE complexation modeling. This paper
was improved by the comments of O. Pourret, an anonymous reviewer,
as well as the editor C. Koretsky.
References
Arsouze, T., Dutay, J.-C., Lacan, F., Jeandel, C., 2009. Reconstructing the Nd oceanic cycle
using a coupled dynamical–biogeochemical model. Biogeosci. Discuss. 6, 5549–5588.
Åström, M., Corin, N., 2003. Distribution of rare earth elements in anionic, cationic and
particulate fractions in boreal humus-rich streams affected by acid sulphate soils.
Water Res. 37, 273–280.
Aubert, D., Stille, P., Probst, A., 2001. REE fractionation during granite weathering and
removal by waters and suspended loads: Sr and Nd isotopic evidence. Geochim.
Cosmochim. Acta 65, 387–406.
Banfield, J.E., Eggleton, R.A., 1987. Apatite replacement and rare earth mobilization,
fractionation, and fixation during weathering. Clays Clay Miner. 37, 113–127.
Bau, M., 1999. Scavenging of dissolved yttrium and rare earths by precipitation iron
oxyhydroxides: experimental evidence for Ce oxidation, Y–Ho fractionation, and
lanthanide tetrad effect. Geochim. Cosmochim. Acta 63, 67–77.
Bertram, C.J., Elderfield, H., 1993. The geochemical balance of the rare earth elements and
neodymium isotopes in the oceans. Geochim. Cosmochim. Acta 57, 1957–1986.
Bethke, C.M., 2008. Geochemical and Biogeochemical Reaction Modeling. second ed.
Cambridge University Press, Cambridge, UK (543 pp.).
Boothroyd, J.C., August, P.V., 2008. Geologic and contemporary landscapes of the
Narragansett Bay ecosystem. In: Desbonnet, A., Costa-Pierce, B.A. (Eds.), Science for
Ecosystem-based Management: Narragansett Bay in the 21st Century. Springer,
New York, pp. 1–33.
Boyle, E.A., Edmond, J.M., Sholkovitz, E.R., 1977. The mechanism of iron removal in
estuaries. Geochim. Cosmochim. Acta 41, 1313–1324.
Braun, J.J., Pagel, M., Muller, J.-P., Bilong, P., Michard, A., Guillet, B., 1990. Cerium anomalies in lateritic profiles. Geochim. Cosmochim. Acta 54, 781–795.
Braun, J.J., Viers, J., Dupre, B., Polve, M., Ndam, J., Muller, J.-P., 1998. Solid/liquid REE
fractionation in the lateritic system of Goyoum, east Cameroon: the implication for
the present dynamics of the soil covers of the humid tropical regions. Geochim.
Cosmochim. Acta 62, 273–299.
Buma, G., Frey, F.A., Wones, D.R., 1971. New England granites: trace element evidence
regarding their origin and differentiation. Contrib. Mineral. Petrol. 31, 200–320.
Byrne, R.H., Kim, K.-H., 1993. Rare earth precipitation and coprecipitation behavior: The
limiting role of PO34 on dissolved rare earth concentrations in seawater. Geochim.
Cosmochim. Acta 57, 519–526.
Byrne, R.H., Sholkovitz, E.R., 1996. Marine chemistry and geochemistry of the lanthanides.
In: Gschneider Jr., K.A., Eyring, L. (Eds.), In Handbook on the Physics and Chemistry of
Rare Earths Vol. 23. Elsevier, pp. 497–592.
Burnett, W.C., Bokuniewicz, H., Huettel, M., Moore, W.S., Taniguchi, M., 2003. Groundwater
and pore water inputs to the coastal zone. Biogeochemistry 66, 3–33.
Cable, J.E., Burnett, W.C., Chanton, J.P., Weatherly, G.L., 1996. Estimating groundwater
discharge into the northeastern Gulf of Mexico using 222Rn. Earth Planet. Sci. Lett.
144, 591–604.
Centiner, Z.S., Wood, S.A., Gammons, C.H., 2005. The aqueous geochemistry of the rare
earth elements. Part XIV. The solubility of rare earth element phosphates from 23
to 150 °C. Chem. Geol. 217, 147–169.
Chaïrat, C., Schott, J., Oelkers, E.H., Lartigue, J.E., Harouiya, N., 2007. Kinetics and mechanism of natural fluorapatite dissolution at 25 °C and pH from 3 to 12. Geochim.
Cosmochim. Acta 71, 5901–5912.
Charette, M.A., Sholkovitz, E.R., 2006. Trace element cycling in a subterranean
estuary: part 2. Geochemistry of the pore water. Geochim. Cosmochim. Acta 70,
811–826.
Chevis, D.A., Johannesson, K.H., Burdige, D.J., Cable, J.E., Martin, J.B., Roy, M., 2015w. Rare
earth element cycling in a sandy subterranean estuary in Florida, USA. Mar. Chem.
(in review).
Cline, J.D., 1969. Spectrophotometric determination of hydrogen sulfide in natural waters.
Limnol. Oceanogr. 14, 454–458.
De Meneses, J.G.A., 1990. Modeling the Fresh Water Inflow to the Pettaquamscutt River.
Ph. D. thesis. University of Rhode Island.
Deer, W.A., Howie, R.A., Zussman, J., 1992. An Introduction to Rock-forming Minerals. 2nd
edition. Pearson Education Limited, London.
Delany, J.M., Lundeen, S.R., 1989. The LLNL Thermochemical Database, Lawrence
Livermore National Laboratory Report UCRL-21658.
Dia, A., Gruau, G., Olivié-Laquet, G., Riou, C., Molénat, J., Curmi, P., 2000. The distribution of
rare earth elements in groundwaters: assessing the role of source— rock composition,
redox changes and colloidal particles. Geochim. Cosmochim. Acta 64, 4131–4151.
Dorias, M.J., 2003. The petrogenesis and emplacement of the New Hampshire Plutonic
Suite. Am. J. Sci. 303, 447–487.
Dorias, M.J., Wintsch, R.P., Kunk, M.J., Aleinikoff, J., Burton, W., Underdown, C., Kerwin,
C.M., 2012. P–T–t conditions, Nd and Pb isotopic compositions and detrital zircon
geochronology of the Massabesic Gneiss Complex, New Hampshire: isotopic and
metamorphic evidence for the identification of Gander basement, central New
England. Am. J. Sci. 312, 1049–1097.
Douglas, T.A., Chamberlain, C.P., Blum, J.D., 2002. Land use and geologic controls on the
major elemental and isotopic (δ15N and 87Sr/86Sr) geochemistry of the Connecticut
River watershed, USA. Chem. Geol. 189, 19–34.
Drever, J.I., 1997. The Geochemistry of Natural Waters: Surface and Groundwater
Environments. 3rd edition. Prentice Hall, Upper Saddle River, NJ.
Duncan, T., Shaw, T.J., 2003. The mobility of rare earth elements and redox sensitive
elements in the groundwater/seawater mixing zone of a shallow coastal aquifer.
Aquat. Geochem. 9, 233–255.
Eaton, A.D., Clerceri, L.S., Greenberg, A.E. (Eds.), 1995a. Standard methods for the
examination of water and wastewater. Am. Public Health Assoc. 3, pp. 67–68.
Eaton, A.D., Clerceri, L.S., Greenberg, A.E. (Eds.), 1995b. Standard methods for the
examination of water and wastewater. Am. Public Health Assoc. 4, pp. 122–123.
Elderfield, H., 1988. The oceanic chemistery of the rare earth elements. Philos. Trans. R.
Soc. Lond., A 325, 105–126.
Elderfield, H., Sholkovitz, E.R., 1987. Rare earth elements in the pore waters of reducing
nearshore sediments. Earth Planet. Sci. Lett. 82, 280–288.
Elderfield, H., Upstill-Goddard, R., Sholkovitz, E.R., 1990. The rare earth elements in rivers,
estuaries, and coastal seas and their significance to the composition of ocean waters.
Geochim. Cosmochim. Acta 54, 971–991.
Frank, M., 2002. Radiogenic isotopes: tracers of past circulation and erosional input. Rev.
Geophys. 40. />Gaines, A.G., Pilson, M.E.Q., 1972. Anoxic water in the Pettaquamscutt River. Limnol.
Oceanogr. 17, 42–49.
Garrels, R.M., Thompson, M.E., 1962. A chemical model for seawater at 25 °C and one
atmosphere total pressure. Am. J. Sci. 260, 57–66.
German, C.R., Masuzama, T., Greaves, M.J., Elderfield, H., Edmond, J.M., 1995. Dissolved
rare earth elements in the Southern Ocean: Cerium oxidation and the influence of hydrography. Geochim. Cosmochim. Acta 59, 1551–1558.
Goldstein, S.L., Hemming, S.R., 2003. Long-lived isotope tracers in oceanography,
paleoceanography, and ice-sheet dynamics. Treatise Geochem. 6, 453–489.
Goldstein, S.J., Jacobsen, S.B., 1987. The Nd and Sr isotopic systematics of river-water
dissolved material: implications for the sources of Nd and Sr in seawater. Chem.
Geol. 66, 245–272.
Goldstein, S.J., Jacobsen, S.B., 1988a. Rare earth elements in river waters. Earth Planet. Sci.
Lett. 89, 35–47.
Goldstein, S.J., Jacobsen, S.B., 1988b. REE in the Great Whale River estuary, northwest
Quebec. Earth Planet. Sci. Lett. 88, 241–252.
Grandjean, P., Albarède, F., 1989. Ion probe measurements of rare earth elements in
biogenic phosphates. Geochim. Cosmochim. Acta 53, 3179–3183.
D.A. Chevis et al. / Chemical Geology 397 (2015) 128–142
Grandjean-Lécuyer, P., Feist, R., Albarède, F., 1993. Rare earth elements in old biogenic
apatites. Geochim. Cosmochim. Acta 57, 2507–2514.
Greaves, M.J., Elderfield, H., Klinkhammer, G.P., 1989. Determination of rare earth
elements in natural waters by isotope-dilution mass spectrometry. Anal. Chim.
Acta. 218, 265–280.
Gromet, L.P., Silver, L.T., 1983. Rare earth element distributions among minerals in a
granodiorite and their petrogenetic implications. Geochim. Cosmochim. Acta 48,
2469–2482.
Hannigan, R.E., Sholkovitz, E.R., 2001. The development of middle rare earth element
enrichments in freshwaters: weathering of phosphate minerals. Chem. Geol. 175,
495–508.
Hanson, G.N., 1980. Rare earth elements in petrogenetic studies of igneous systems. Annu.
Rev. Earth Planet. Sci. 8, 371–406.
Haque, S., Ji, J., Johannesson, K.H., 2008. Evaluating mobilization and transport of arsenic
in sediments and groundwaters of Aquia aquifer, Maryland, USA. J. Contam. Hydrol.
99, 68–84.
Hermes, O.D., Zartman, R.E., 1985. Late Proterozoic and Devonian plutonic terrains within
the Avalon zone of Rhode Island. Geol. Soc. Am. Bull. 96, 272–282.
Hermes, O.D., Gromet, C., Murray, D., 1994. Geologic bedrock map of Rhode Island. Rhode
Island Map Series 1. Office of the State Geologist, University of Rhode Island.
Jeandel, C., Bishop, J.K., Zindler, A., 1995. Exchange of neodymium and its isotopes
between seawater and small and large particles in the Sargasso Sea. Geochim.
Cosmochim. Acta 59, 535–547.
Johannesson, K.H., Burdige, D.J., 2007. Balancing the global oceanic neodymium budget:
evaluating the role of groundwater. Earth Planet. Sci. Lett. 253, 129–142.
Johannesson, K.H., Farnman, I.M., Guo, C., Stetzenbach, K.J., 1999. Rare earth element fractionation and concentration variations along a groundwater flow path within a shallow, basin-fill aquifer, southern Nevada, USA. Geochim. Cosmochim. Acta 63,
2697–2708.
Johannesson, K.H., Lyons, W.B., 1994. The rare earth element geochemistry of Mono Lake
water and the importance of carbonate complexing. Limnol. Oceanogr. 39, 1141–1154.
Johannesson, K.H., Lyons, W.B., 1995. Rare-earth elements geochemistry of Colour Lake,
an acidic freshwater lake on Axel Heiberg Island, Northwest Territories, Canada.
Chem. Geol. 119, 209–223.
Johannesson, K.H., Lyons, W.B., Stetzenbach, K.J., Byrne, R.H., 1995. The solubility control
of rare earth elements in natural terrestrial waters and the significance of PO34 and
CO23 in limiting dissolved rare earth concentrations: a review of recent information.
Aquat. Geochem. 1, 157–173.
Johannesson, K.H., Zhou, X., 1999. Origin of middle rare earth elements in acid waters of a
Canadian High Arctic lake. Geochim. Cosmochim. Acta 63, 153–165.
Johannesson, K.H., Lyons, W.B., Yelken, M.A., Gaudette, H.E., Stetzenbach, K.J., 1996a.
Geochemistry of the rare earth elements in hypersaline and dilute acidic natural
terrestrial waters: complexation, behavior, and middle rare earth element enrichments. Chem. Geol. 133, 125–144.
Johannesson, K.H., Stetzenbach, K.J., Hodge, V.F., Lyons, W.B., 1996b. Rare earth element
complexation behavior in circumneutral pH groundwaters: assessing the role of
carbonate and phosphate ions. Earth Planet. Sci. Lett. 139, 305–319.
Johannesson, K.H., Tang, J., Daniels, J.M., Bounds, W.J., Burdige, D.J., 2004. Rare earth element concentrations and speciation in organic-rich blackwaters of the Great Dismal
Swamp, Virginia, USA. Chem. Geol. 209, 271–294.
Johannesson, K.J., Cortés, A., Leal, J.A.R., Ramírez, A.G, Durazo, J., 2005. Geochemistry of
rare earth elements in groundwaters from a rhyolite aquifer, Central México. In:
Johannesson, K.H. (Ed.), In Rare Earth Elements in Groundwater Flow Systems.
Elsevier, pp. 187–222.
Johannesson, K.H., Chevis, D.A., Burdige, D.J., Cable, J.E., Martin, J.B., Roy, M., 2011.
Submarine groundwater discharge is an important net source of light and middle
REEs to coastal waters of the Indian River Lagoon, Florida, USA. Geochim. Cosmochim.
Acta 75, 825–843.
Jonasson, R.G., Bancoft, G.M., Nesbit, H.W., 1985. Solubilities of some hydrous REE
phosphates with implications for diagenesis and seawater concentrations. Geochim.
Cosmochim. Acta 49, 2133–2139.
Kelly, R.P., Moran, S.B., 2002. Seasonal changes in the groundwater input to a well-mixed
estuary estimated using radium isotopes and implications for coastal nutrient
budgets. Limnol. Oceanogr. 47, 1796–1807.
Kemp, R.A., Truemann, C.N., 2003. Rare earth elements in Solnhofen biogenic apatite:
geochemical clues to palaeoenvironment. Sediment. Geol. 155, 109–127.
Kim, I., Kim, G., 2011. Large fluxes of rare earth elements through submarine groundwater
discharge (SGD) from a volcanic island, Jeju, Korea. Mar. Chem. 127, 12–19.
Kim, I., Kim, G., 2014. Submarine groundwater discharge as a main source of rare earth
elements in coastal waters. Mar. Chem. 160, 11–17.
Klein, C., 2002. The Manual of Mineral Science. 22nd edition. John Wiley and Sons, New York.
Klungness, G.D., Byrne, R.H., 2000. Comparative hydrolysis behavior of the rare earth
elements and yttrium: the influence of temperature and ionic strength. Polyhedron
19, 99–107.
Kưhler, S.J., Harouiya, N., Chạrat, C., Oelkers, E.H., 2005. Experimental studies of REE
fractionation during water–mineral interactions: REE release rates during apatite
dissolution from pH 2.8 to 9.2. Chem. Geol. 222, 168–182.
Lawrence, M.G., Kamber, B.S., 2006. The behaviour of rare earth elements during estuarine mixing-revisited. Mar. Chem. 100, 147–161.
Lee, J.H., Byrne, R.H., 1992. Examination of comparative rare earth element complexation
behavior using linear free-energy relationships. Geochim. Cosmochim. Acta 56,
1127–1137.
Leybourne, M.I., Johannesson, K.H., 2008. Rare earth elements (REE) and yttrium in
stream waters, stream sediments, and Fe–Mn oxyhydroxides: fractionation, speciation, and controls over REE + Y patterns in the surface environment. Geochim.
Cosmochim. Acta 72, 5962–5983.
141
Leybourne, M.I., Peter, J.M., Layton-Matthews, D., Volesky, J., Boyle, D.R., 2006. Mobility and
fractionation of rare-earth elements during supergene weathering gossan formation
and chemical modification of massive sulfide gossan. Geochim. Cosmochim. Acta 70,
1097–1112.
Li, L., Barry, D.A., Stagnitti, F., Parlange, J.Y., 1999. Submarine groundwater discharge and
associated chemical inputs to a coastal sea. Water Resour. Res. 35, 3253–3259.
Liu, X., Byrne, R.H., 1997. Rare earth and yttrium phosphate solubilities in aqueous
solution. Geochim. Cosmochim. Acta 61, 1625–1633.
Luo, Y.-R., Byrne, R.H., 2001. Yttrium and rare earth element complexation by chloride
ions at 25 °C. J. Solut. Chem. 30, 837–845.
Luo, Y.-R., Byrne, R.H., 2004. Carbonate complexation of yttrium and the rare earth
elements in natural waters. Geochim. Cosmochim. Acta 68, 691–699.
Luther III, G.W., Kostka, J.E., Church, T.M., Sulzberger, B., Stumm, W., 1992. Seasonal iron
cycling in the salt marsh sedimentary environment: the importance of ligand
complexes with Fe (II) and Fe (III) in the dissolution of Fe (III) minerals and pyrite,
respectively. Mar. Chem. 40, 81–103.
Maria, A., Hermes, O.D., 2001. Volcanic rocks in the Narragansett Basin, southeastern New
England: petrology and significance to early basin formation. Am. J. Sci. 301, 286–312.
Marsac, R., Davranche, M., Gruau, G., Dia, A., 2010. Metal loading effect on rare earth on
rare earth element binding to humic acid: experimental and modeling evidence.
Geochim. Cosmochim. Acta 74, 1749–1761.
Martin, J.B., Cable, J.E., Smith, C., Roy, M., Cherrier, J., 2007. Magnitudes of submarine
groundwater discharge from marine and terrestrial sources: Indian River Lagoon,
Florida. Water Resour. Res. 43, W05440. />Michael, H.A., Mulligan, A.E., Harvey, C.F., 2005. Seasonal oscillations in water exchange
between aquifers and the coastal ocean. Nature 436, 1145–1148.
Middelburg, J.L., Van Der Weijden, C.H., Woittiez, J.R.W., 1988. Chemical processes
affecting the mobility of major, minor, and trace elements during weathering of
granitic rocks. Chem. Geol. 68, 253–273.
Millero, F.J., 1992. Stability constants for the formation of rare earth inorganic complexes
as a function of ionic strength. Geochim. Cosmochim. Acta 56, 3123–3132.
Millero, F.J., Schreiber, D.R., 1982. Use of ion pairing model to estimate the activity
coefficients of the ionic components of natural waters. Am. J. Sci. 282, 1508–1540.
Moore, W.S., 1996. Large groundwater inputs to coastal waters revealed by 226Ra
enrichments. Nature 380, 612–614.
Moore, W.S., 2010. A reevaluation of submarine groundwater discharge along the southeastern coast of North America. Glob. Biogeochem. Cycles 24, GB4005. .
org/10.1029/2009GB003747.
Moore, W.S., Wilson, A.M., 2005. Advective flow through the upper continental shelf
driven by storms, buoyancy, and submarine groundwater discharge. Earth Planet.
Sci. Lett. 235, 564–576.
Moore, W.S., Sarmiento, J.L., Key, R.M., 2008. Submarine groundwater discharge revealed
by 228Ra distribution in the upper Atlantic Ocean. Nat. Geosci. 1, 309–311.
Muinos, S.B., Frank, M., Maden, C., Hein, J.R., van de Flierdt, T., Lebreiro, S.M., Gaspar, L.,
Monteiro, J.H., Halliday, A.N., 2008. New constraints on the Pb and Nd isotopic
evolution of NE Atlantic water masses. Geochem. Geophys. Geosyst. 9 (2), Q02007.
/>Nance, W.B., Taylor, S.R., 1976. Rare earth element patterns and crust evolution — I.
Australian post-Archean sedimentary rocks. Geochim. Cosmochim. Acta 40, 1539–1551.
Nixon, S.W., Buckley, B.A., Granger, S.L., Harris, L.A., Oczkowski, A.J., Fulweiler, R.W., Cole,
L.W., 2008. Nitrogen and phosphorus inputs to Narragansett Bay: past, present, and
future. In: Desbonnet, A., Costa-Pierce, B.A. (Eds.), Science for Ecosystem-based Management: Narragansett Bay in the 21st Century. Springer, New York, pp. 101–176.
Nowicki, B.L., Gold, A.J., 2008. Groundwater nitrogen transport and input along the Narragansett Bay coastal margin. In: Desbonnet, A., Costa-Pierce, B.A. (Eds.), Science for
Ecosystem-based Management: Narragansett Bay in the 21st Century. Springer,
New York, pp. 67–100.
Nozaki, Y., Alibo, D.S., 2003. Importance of vertical geochemical processes in controlling
the oceanic profiles of dissolved rare earth elements in the northeastern Indian
Ocean. Earth Planet. Sci. Lett. 205, 155–172.
Nozaki, Y., Zhang, J., 1995. The rare earth elements and yttrium in the coastal/offshore
mixing zone of Tokyo Bay waters and the Kuroshio. In: Sakai, H., Nozaki, Y. (Eds.),
Biogeochemical Processes and Ocean Flux in the Western Pacific. Terra Scientific Publishing, pp. 171–184.
Piepgras, D.J., Jacobsen, S.B., 1992. The behavior of rare earth elements in seawater: Precise determination of variations in the North Pacific water column. Geochim.
Cosmochim. Acta 56, 1851–1862.
Pilson, M.E.Q., 1985. Annual cycles of nutrients and chlorophyll in Narragansett Bay,
Rhode Island. J. Mar. Res. 43, 849–873.
Pilson, M.E.Q., 2013. An Introduction to the Chemistry of the Sea. 2nd edition. Cambridge
University Press, New York.
Pitzer, K.S., 1979. Theory: ion interaction approach. In: Pythowicz, R.M. (Ed.), Activity
Coefficients in Electrolyte Solutions vol. 1. CRC Press, pp. 157–208.
Plummer, L.N., Parkhurst, D.L., Fleming, G.W., Dunkle, S.A., 1989. PHRQPITZ, a computer
program for geochemical calculations in brines. U.S. Geol. Surv. Water-Resour. Invest.
Reppp. 88–4153.
Pourret, O., Davranche, M., Gruau, G., Dia, A., 2007. Rare earth element complexation with
humic acid. Chem. Geol. 243, 128–141.
Protano, G., Riccobono, F., 2002. High contents of rare earth elements (REEs) in stream
waters of a Cu–Pb–Zn mining area. Environ. Pollut. 117, 499–514.
Rosenhein, J.S., Gonthier, J.B., Allen, W.B., 1968. Hydrologic characteristics and sustained
yields of principal groundwater units Potowomut–Wickford area, Rhode Island.
U. S. Water-Supply Paper 1775. Geological Survey, Washington, DC.
Roy, M., Martin, J.B., Cherrier, J., Cable, J.E., Smith, C.G., 2010. Influence of sea level rise on
iron diagenesis in an east Florida subterranean estuary. Geochim. Cosmochim. Acta
74, 5560–5573.
142
D.A. Chevis et al. / Chemical Geology 397 (2015) 128–142
Roy, M., Martin, J.B., Smith, C.G., Cable, J.E., 2011. Reactive-transport modeling of iron diagenesis and associated organic carbon remineralization in a Florida (USA) subterranean estuary. Earth Planet. Sci. Lett. 304, 191–201.
Schafer, J.P., 1961a. Surficial geology of the Wickford quadrangle, Rhode Island. Quadrangle
Map GQ-136. U.S. Geological Survey, Washington, DC.
Schafer, J.P., 1961b. Surficial geology of the Narragansett Pier quadrangle, Rhode Island.
Quadrangle Map GQ-140. U.S. Geological Survey, Washington, DC.
Schijf, J., Byrne, R.H., 1999. Determination of stability constants for the mono- and
diflouro-complexes of Y and the REE, using cation-exchange resin and ICP-MS.
Polyhedron 18, 2839–2844.
Schijf, J., Byrne, R.H., 2004. Determination of SO4β1 for yttrium and the rare earth
elements at I = 0.66 m and t = 25 °C— implications for YREE solution speciation
in sulfate-rich waters. Geochim. Cosmochim. Acta 68, 2825–2837.
Schulz, K.J., Stewart, D.B., Tucker, R.D., Pollock, J.C., Ayuso, R.A., 2008. The Ellsworth terrane,
coastal Maine: geochronology, geochemistry, and Nd–Pb isotopic composition —
implications for the rifting of Ganderia. Geol. Soc. Am. Bull. 120, 1134–1158.
Sholkovitz, E.R., 1976. Flocculation of dissolved organic and inorganic matter during the
mixing of river water and sea water. Geochim. Cosmochim. Acta 40, 831–845.
Sholkovitz, E.R., 1978. The flocculation of dissolved Fe, Mn, Al, Cu, Ni, Co and Cd during
estuarine mixing. Geochim. Cosmochim. Acta 41, 77–86.
Sholkovitz, E.R., 1992. Chemical evolution of rare earth elements: fractionation between
colloidal and solution phases of filtered river waters. Earth Planet. Sci. Lett. 114,
77–84.
Sholkovitz, E.R., 1993. The geochemistry of rare earth elements in the Amazon River
estuary. Geochim. Cosmochim. Acta 57, 2181–2190.
Sholkovitz, E.R., 1995. The aquatic chemistry of rare earth elements in rivers and estuaries.
Aquat. Geochem. 1, 1–34.
Sholkovitz, E.R., Piepgras, D.J., Jacobsen, S.B., 1989. The pore water chemistry of rare earth
elements in Buzzards Bay sediments. Geochim. Cosmochim. Acta 53, 2847–2856.
Siffling, J.P., 1997. Narrow River Hydrodynamics Using an ADCP. M.S. thesis. University of
Rhode Island.
Sholkovitz, E.R., Landing, W.M., Lewis, B.L., 1994. Ocean particle chemistry: The fractionation of rare earth elements between suspended particles and seawater. Geochim.
Cosmochim. Acta 58, 1567–1579.
Smith, C.G., Cable, J.E., Martin, J.B., Roy, M., 2008a. Evaluating the source and seasonality of
submarine groundwater discharge using a radon-222 pore water transport model.
Earth Planet. Sci. Lett. 273, 312–322.
Smith, C.G., Cable, J.E., Martin, J.B., 2008b. Episodic high intensity mixing events in a
subterranean estuary: effects of tropical cyclones. Limnol. Oceanogr. 53, 666–674.
Sonke, J.E., Salters, V.J.M., 2006. Lanthanide-humic substances complexation I. Experimental
evidence for a lanthanide contraction effect. Geochim. Cosmochim. Acta 70, 1495–1506.
Stolpe, B., Guo, L., Shiller, A.M., 2013. Binding and transport of rare earth elements by
organic and iron-rich nanocolloids in Alaska rivers, as revealed by field-flow fractionation and ICP-MS. Geochim. Cosmochim. Acta 106, 446–462.
Sverjensky, D.A., 1984. Europium redox equilibria in aqueous solutions. Earth Planet. Sci.
Lett. 67, 70–78.
Tachikawa, K., Athias, V., Jeandel, C., 2003. Neodymium budget in the modern ocean and
paleoceanographic implications. J. Geophys. Res. 108, 3254. />1029/1999JC000285.
Tang, J., Johannesson, K.H., 2010. Ligand extraction of rare earth elements from aquifer
sediments: implication for rare earth element complexation with organic matter in
natural waters. Geochim. Cosmochim. Acta 74, 6690–6705.
Tang, J., Johannesson, K.H., 2006. Controls on the geochemistry of rare earth elements
along a groundwater flow path in the Carrizo Sand aquifer, Texas, USA. Chem. Geol.
225, 156–171.
Taniguchi, M., Burnett, W.C., Cable, J.E., Turner, J.V., 2002. Investigation of submarine
groundwater discharge. Hydrol. Process. 16, 2115–2129.
Taunton, A.E., Welch, S.A., Banfield, J.F., 2000a. Geomicrobiological controls on light rare
earth element, Y and Ba distributions during granite weathering and soil formation.
J. Alloys Compd. 303–304, 30–36.
Taunton, A.E., Welch, S.A., Banfield, J.F., 2000b. Microbial controls on phosphate and
lanthanide distributions during granite weathering and soil formation. Chem. Geol.
169, 371–382.
Taylor, S.R., McLennan, S.M., 1985. The Continental Crust: Its Composition and Evolution.
Blackwell Scientific Publications, Oxford (UK) (312 pp.).
Tricca, A., Stille, P., Steinmann, M., Kiefel, B., Samuel, J., Eikenberg, J., 1999. Rare earth
elements and Sr and Nd isotopic compositions of dissolved and suspended loads
from small river systems in the Vosges mountains (France), the river Rhine and
groundwater. Chem. Geol. 160, 139–158.
Tweed, S.O., Weaver, T.R., Cartwright, I., Schaefer, B., 2006. Behavior of rare earth
elements in groundwaters during flow and mixing in fractured rock aquifers: an
example from the Dandenong Ranges, southeast Australia. Chem. Geol. 234,
291–307.
Via, R.K., Thomas, D.J., 2006. Evolution of Atlantic thermohaline circulation: early
Oligocene onset of deep-water production in the North Atlantic. Geology 34, 441–444.
Welch, S., Lyons, W.B., Kling, C.A., 1990. A coprecipitation technique for determining trace
metal concentrations in iron-rich saline solutions. Environ. Sci. Technol. 11, 141–144.
Welch, K.A., Lyons, W.B., Graham, E., Neumann, K., Thomas, J.M., Mikesell, D., 1996.
Determination of major element chemistry in terrestrial waters from Antarctica by
ion chromatography. J. Chromatogr. A739, 257–263.
Welch, S.A., Taunton, A.E., Banfield, J.F., 2002. Effect of microorganisms and microbial
metabolites on apatite dissolution. Geomicrobiol J. 19, 343–367.
Wiesel, C.P., Duce, R.A., Fasching, J.L., 1984. Determination of aluminum, lead, and vanadium
in North Atlantic seawater after coprecipitation with ferric hydroxide. Anal. Chem. 56,
1050–1052.
Westerlund, S., Öhman, P., 1992. Rare earth elements in the Arctic Ocean. Deep-Sea Res.
39, 1613–1626.
Willis, S.S., Johannesson, K.H., 2011. Controls on the geochemistry of rare earth elements
in sediments and groundwaters of the Aquia aquifer, Maryland, USA. Chem. Geol.
285, 32–49.
Wright, J., Seymour, R.S., Shaw, H.F., 1984. REE and Nd isotopes in conodont apatite:
variations with geological age and depositional environment. In: Clark, D.L. (Ed.),
Conodont Biofacies and Provincialism. Geol. Soc. Amer. Spec. Pap. 196, pp. 325–340.
Wright, J., Schrader, H., Holser, W., 1987. Paleoredox variations in ancient oceans recorded
by rare earth elements in fossil apatite. Geochim. Cosmochim. Acta 51, 631–644.
Zartman, R.E., Hermes, O.D., 1987. Archean inheritance in zircon from late Paleozoic
Granites from the Avalon zone of southeastern New England: an African Connection.
Earth Planet. Sci. Lett. 82, 305–315.
Zhang, J., Nozaki, Y., 1996. Rare earth elements and yttrium in seawater: ICP-MS determinations in the East Caroline, Coral Sea, and South Fiji basins of the western South Pacific Ocean. Geochim. Cosmochim. Acta 60, 4631–4644.