Serviceability-Based Dynamic Loan Rating of a LT20 Bridge_2
Bạn đang xem bản rút gọn của tài liệu. Xem và tải ngay bản đầy đủ của tài liệu tại đây (788.27 KB, 6 trang )
Cleveland State University
EngagedScholarship@CSU
Civil and Environmental Engineering Faculty
Publications
Civil and Environmental Engineering
11-2004
Serviceability-Based Dynamic Loan Rating of a LT20 Bridge
P. Siswobusono
University of Alabama - Birmingham
S.-E. Chen
University of Alabama - Birmingham
S. Jones
University of Alabama - Birmingham
D. Callahan
University of Alabama - Birmingham
T. Grimes
Alabama Department of Transportation
See next page for additional authors
Follow this and additional works at: />Part of the Civil Engineering Commons
How does access to this work benefit you? Let us know!
Publisher's Statement
© 2004 Society for Experimental Mechanics
Original Citation
Siswobusono, P., Chen, S. -., Jones, S., Callahan, D., Grimes, T., and Delatte, N. (2004). "SERVICEABILITYBASED DYNAMIC LOAD RATING OF A LT20 BRIDGE." Exp Tech, 28(6), 33-36.
This Article is brought to you for free and open access by the Civil and Environmental Engineering at
EngagedScholarship@CSU. It has been accepted for inclusion in Civil and Environmental Engineering Faculty
Publications by an authorized administrator of EngagedScholarship@CSU. For more information, please contact
Authors
P. Siswobusono, S.-E. Chen, S. Jones, D. Callahan, T. Grimes, and Norbert Delatte
This article is available at EngagedScholarship@CSU: />
by P. Siswobusono, S.-E. Chen, S. Jones, D. Callahan,
T. Grimes and N. Delatte
SERVICEABILITY-BASED DYNAMIC LOAD RATING OF A
LT20 BRIDGE
.
. the deflection is maintained as a constant such as by using
. the AASHTO (American Association of State Highway and
. Transportation Officials) deflection limits 0allowable:
.
P' = 0allowable • k'
(3)
.
.
. This new limiting load P' can also be used to determine the
. amount of load reduction MP from the maximum load, P:
.
MP = P - P'
(4)
.
.
. Several assumptions are made in this simple model includ
. ing: 1) the vehicle load is directly applied to top of the bridge
. (as contrasted to a moving load along the bridge span); 2)
. the bridge only vibrates in a single mode; 3) the bridge sup
. port conditions do not change significantly; and 4) all girders
. deform by the same amount. These assumptions may limit
.
. the application of the method to single span, short bridges
. with limited vehicle type crossings, considering the effects of
DYNAMIC LOAD RATING
. vehicle mass, speed and multi-vehicle loads. More critically,
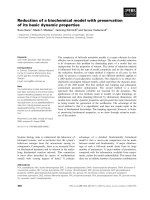
The proposed dynamic load rating technique assumes the . by limiting the bridge behavior to a single mode of vibration,
bridge as a loaded spring (Fig. 1), where the global stiffness . modal testing is required to identify the most significant vi
of the bridge is analogous to a spring constant, k. When a . bration mode. Ideally, the significant mode is also the fun
damental mode.
vehicle passes over the
bridge, it exerts a load P,
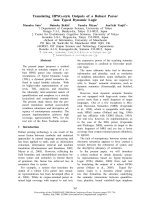
Figure 2 shows the sche
causing the bridge to deflect
matic of the proposed algo
0. When linear elastic condi
rithm. The baseline fre
tions are assumed, the load P
quency
values
(initial
on the bridge is then equal
frequency) for the existing
to 0*k. Using serviceability
structure should be deter
limit deflection, a decrease in
mined first; this determina
global stiffness obviously
tion can be accomplished by
denotes a decrease in the
conducting a full-scale modal
bridge’s overall load capacity. Fig. 1: Single-degree-of-freedom model
test on the bridge. The cap
Measuring the vibrations under ambient conditions, the . tured signal is first transformed into the frequency domain
bridge’s fundamental vibration frequency, f, can be deter- . and used to determine the dominant mode. It should be cau
. tioned that significant signal processing might be required
mined as a function of its mass and stiffness:
. to ensure the capture of the dominant mode. By comparing
. the existing dominant frequency with the undamaged fre
1
k
f =
(1) . quency of interest, the frequency shift caused by likely
m
2
.
.
By measuring the fundamental vibration frequency period .
ically, the change in frequency, can determine the change in .
global stiffness. Assuming no significant mass change, the .
remaining global stiffness of the bridge k', can be deter- .
.
mined directly from measured vibration frequency, f ':
.
(2) .
k' = 4 2mf '2
.
The remaining load capacity, P', can be then determined if .
.
P. Siswobusono is a Graduate Research Assistant, and S.-E. Chen (SEM Member) .
and S. Jones are Assistant Professors, in the Department of Civil and Environ- .
mental Engineering, and D. Callahan is an Assistant Professor in the Department .
of Electrical and Computer Engineering, at the University of Alabama at Bir .
mingham, AL. T. Grimes is a Bridge Engineer at the Alabama Department of
.
Transportation in Shelby, AL. N. Delatte is an Associate Professor in the Depart
ment of Civil and Environmental Engineering, Cleveland State University, Cleve .
. Fig. 2: Flowchart of the bridge dynamic load-rating method
land, OH.
ounty LT20 (Less Than 20 ft) bridges are bridges
with span lengths less than 20 feet. Considered mi
nor structures, these bridges are not included in
the National Bridge Inventory System (NBIS);
hence, they do not usually receive the benefits of federallymandated bridge evaluations. As a result, these bridges are
rated using analytical procedures based on observations
made during visual inspections, and are almost never load
tested.3 Ambient excitation has been suggested to nonde
structively estimate the remaining load capacity of these
bridges for rating purposes.1,2 To determine the accuracy of
the load capacity prediction, a two-lane concrete deck steel
girder bridge is studied using measured modal characteristics and static load test results. In particular, the aim of this
paper is to confirm the dynamic load test results through
static load testing. The ultimate goal of this research effort
is to extend the technique to ambient traffic vibration.
C
(
DYNAMIC LOAD RATING
OF A LT20 BRIDGE
bridge damage can be obtained. Assuming the bridge did not
lose significant weight ( 10%), the drop in stiffness can then
be determined. The original weight of the bridge can be estimated from the material supplier’s data and the original
design drawings. The change in stiffness would then be used
to determine the remaining capacity of the bridge with a pre
established maximum deflection requirement. This remain
ing capacity can then be used to re-evaluate the existing load
posting.
It should be noted that there are several factors that may
impact on the vibration behaviors of a bridge, i.e. temperature effect and change of support conditions, etc. These conditions pose serious limitations to the current proposed
method and need further investigations. Support conditions
such as excessive settlements of bridge piers may cause fre
quency shifts either by allowing rotation, imposing moment
or resulting in nonlinear behaviors. Temperature effects are
known to influence on the transducer and cable behaviors,
hence, may limit the potential of permanent sensor instal
lation. However, innovative approaches, such as limiting the
time and seasons for bridge monitoring may be imposed to
ensure the validity of the test results.
COUNTY BRIDGE NO. 020-59-202Z
The proposed technique was first tested on an existing
bridge. The test bridge (Bridge No. 020-59-202Z) is located
in southern Shelby County on Shelby County Road 20 (Fig.
3). The bridge has a clear span of 18 ft 3 in. The deck is
composed of 5-in. reinforced concrete. Over the existing asphalt pavement is a 16-in.-thick soil aggregate (chert) base
and a 1.5-in.-thick bituminous concrete wearing surface. The
bridge has standard flex beam guardrails and the girders are
steel S12 X 31.8 sections. The bridge was constructed in
1959 with 5 girders spaced at 58 in. on center. The bridge is
skewed at a 20° angle perpendicular to the roadway center
line. Figure 4 shows a detailed schematic drawing of the test
bridge. Load ratings calculated by the ALDOT Bridge Rating
Section using Allowable Stress Design (ASD) method resulted in the posting of maximum allowable traffic loads for
different vehicle types on the bridge (Fig. 5). Current load
posting for AASHTO H15 truck is about 6 tons. Load capac
ity based on AASHTO load rating technique shows a 7.231
ton rating for this bridge.
Fig. 3: Shelby county bridge no. 020-59-202Z
.
.
.
.
.
.
.
.
.
.
.
.
.
.
.
.
.
.
.
.
.
.
.
.
.
.
.
.
.
.
.
.
.
.
.
.
.
.
.
.
.
.
.
.
.
.
.
.
.
.
.
.
.
.
.
.
.
.
.
.
.
.
.
.
.
.
.
.
.
.
Fig. 4: Schematic details of test bridge
Fig. 5: Current posted load limits for bridge no. 020-59-202Z
DYNAMIC LOAD TEST
Full-scale modal testing was conducted on the bridge using
impact excitation and single accelerometer measurements.
Impact excitation was done using an instrumented 20-lb
sledgehammer. The vibration responses were detected using
a single seismic piezoelectric accelerometer (PCB Piezotron
ics) with a magnetic base placed at the center of the outer
most girder. The signals were collected using a 12-channel
DYNAMIC LOAD RATING
OF A LT20 BRIDGE
Fig. 6: Impact grid for modal testing
data acquisition system (DAQ) (Wavebook / 513 IOtech, 12bit MHz Data Acquisition System). A 4-channel ICP Sensor
Signal Conditioner (PCB) was used to enhance the signals.
A grid of 42 nodes was laid out on the bridge (Fig. 6), which
was struck individually with the sledgehammer. Each node,
depicted as node Nxy at point (x,y), was excited five times
using a sampling frequency between 500 to 1000 Hz. The
frequency of the first bending mode of the bridge was deter
mined to be 18 Hz.
Ambient traffic excitation testing was then conducted1 to
study the effects of different vehicles traveling on the bridge,
which include varied vehicle axle spacing, weights and
speeds. By monitoring the excitation of the bridge during
regular traffic, the mean measured fundamental mode fre
quency was found to be 18.1 Hz. The measured vibration
frequency was then used to back-calculate the load capacity
using the process outlined in the flowchart of Fig. 2. Using
the AASHTO serviceability deflection limit, 0limit, of span /
800 (0.0256 in), would result in a load capacity of 27,586 lb
(12.498 ton). This load capacity is significantly greater than
the current posted load limit of 6 ton.
STATIC LOAD TESTS
Static load testing was conducted in order to validate the
dynamic load test results. For the selected bridge, 9 dial
gages were set up below the outermost and middle girders
to measure deflection. Each dial gage was clamped to an alu
minum rod of a specific height, which was secured to a con
crete base. A 2-axle truck with an axle spacing of 12 feet and
an empty gross weight of 15000 lb (6700 lb on front axle and
8400 lb on back axle) was used to load the bridge. The truck
.
.
.
.
.
.
.
.
.
.
.
.
.
.
.
.
.
.
.
.
.
.
.
.
.
.
.
.
.
.
.
.
.
.
.
.
.
.
.
.
.
.
.
.
.
.
.
.
.
.
.
.
.
.
Fig. 7: Static load test setup with position of truck load
was loaded with aggregate up to the target gross weight on
the back axle specified in Table 1. The truck was placed with
the back wheels at the center of the bridge for each incre
mented weight. Figure 7 shows the position of the truck and
dial gauge locations.
Deflection measurements of the bridge were calculated
based on the dial gage readings taken for each loading. Since
the proposed method assumed vehicles to be passing at the
center of the bridge, average girder deflection recorded was
used for comparison. Deflections are calculated based on
stiffness computed from equations (2) and (3) using mea
sured bending frequencies from the impact test and traffic
excitation test, are tabulated in Table 1. Also shown in Table
1 are actual measured deflections from static load tests.
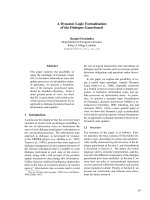
Analyses show the deflection measured from the load test to
be 30% different from the deflection determined from the
traffic excitation test. From Fig. 8 it also shows that a linear
relationship was depicted between the deflection and load up
to 7 tons.
DISCUSSION
The target of this research is to provide highway engineers
with a more rapid and accurate assessment tool for deter-
Table 1—Deflection measured from impact test, traffic excitation, and static load test
DEFLECTION (in.)
GROSS TRUCK WEIGHT
ON BACK AXLE (lb)
CALCULATED FROM IMPACT
EXCITATION TESTS
CALCULATED FROM TRAFFIC
EXCITATION TESTS
MEASURED FROM STATIC
LOAD TESTS
10,050
0.007
0.008
0.006
12,050
0.008
0.010
0.007
14,100
0.010
0.012
0.010
DYNAMIC LOAD RATING
OF A LT20 BRIDGE
Fig. 8: Comparison of deflection measurements
mining load capacity of highway bridges. With a more ac
curate load rating, the management of the state’s highway
bridges can be improved. The proposed use of ambient vi
bration is hoped to minimize interruption to ongoing traffic
and improves the safety of the bridge inspectors and the pub
lic.
The results of the current research show the potential of the
proposed testing methodology, which is validated by the dynamic and static load tests on an actual bridge. For all prac
tical purposes, the estimated deflections from the three tests
(static load test, impact test and ambient traffic test) all fall
in the same orders of magnitude with a statistical variation
within 30%.
Although all bridges vibrate in multiple modes during ambient excitation, it is evident that this technique works best
when the dominant mode is the first bending mode. To ensure only measurement of bending vibrations, the strategic
placement of sensors is critical. The best result occurs when
the vehicle is driving across the center of the bridge because
no torsion modes are excited, which may not always happen.
Limitations of this proposed approach may include having a
priori knowledge of the bridge’s original condition and the
change of condition in the course of bridge repair, such as
the addition of future wearing surfaces, and the unreported
changes of bridge condition done by contractors. If possible,
traffic information (vehicle type, speed, direction of travel,
.
.
.
.
.
.
.
.
.
.
.
.
.
.
.
.
.
.
.
.
.
.
.
.
.
.
.
.
.
.
.
.
.
.
.
.
.
.
.
.
.
.
.
.
.
.
.
.
.
.
.
.
and lane position) should be recorded. An automated mea
surement system such as a remote-sensing system is cur
rently under investigation and development.
CONCLUSION
Dynamic testing was conducted on a selected short-span
bridge to study the bridge’s behavior and to determine the
natural vibration frequencies of the bridge. Included in the
dynamic testing were ambient traffic excitation and fullscale modal testing. By using a deflection limit, it is possible
to establish the remaining load capacity of the bridge, which
is valuable information for bridge engineers.
Based on the deflection measured from the static load test,
the stiffness calculated from the proposed method seems to
be a reasonable estimate of the actual bridge stiffness of
1,199,422 lb / in (Figure 7). The findings indicated that the
method is a viable technique as a supplement for existing
evaluation of those LT20 bridges by suggesting a service load
capacity based on the measurement of global stiffness and
allowable service deflection limits.
ACKNOWLEDGMENTS
This paper is based on research funded by the University
Transportation Center for Alabama (project No. 01221) and
the Alabama Department of Transportation (ALDOT
No.525784). The writer would like to acknowledge Dr. Sri
neevas Alampalli, Dr. Mostafiz Chowdhury, C.K. Ong, Lei
Zheng, Prithwish Biswas and Trey Gauntt, for their inval
uable contribution to the project. The authors also appreci
ate the support from Mr. Fred Conway and Mr. George Connor from Alabama Department of Transportation for their
support of the project.
References
1. Chen, S.E., Siswobusono, P., Delatte, N., and Stephens, B.J.,
‘‘Feasibility Study on Dynamic Bridge Load Rating,’’ Rep. No. 01221,
University Transportation Center for Alabama, Birmingham, AL
(2002).
2. Chen, S.E., Siswobusono, P., Chowdhury, M., Alampalli, S.,
and Grimes T., ‘‘Modal Validation of a Short Span Bridge,’’ An NDT
Conference: Structural Materials Technology V, US Dept. of Trans.,
Cincinnati, Ohio, 275-282 (2002).
3. Grimes, T.C., ‘‘Local Roads Bridge Replacement Prioritization
Database (BRPD) Program,’’ MS thesis, University of Alabama at
Birmingham, AL (2001). •
Post-print standardized by MSL Academic Endeavors, the imprint of the Michael Schwartz Library at Cleveland State University, 2014