Báo cáo " Objective and Subjective Factors Influence on Demand of Drainage by Pumping in Red River Delta " potx
Bạn đang xem bản rút gọn của tài liệu. Xem và tải ngay bản đầy đủ của tài liệu tại đây (127.81 KB, 7 trang )
VNU Journal of Science, Earth Sciences 26 (2010) 121-127
121
Objective and Subjective Factors Influence on
Demand of Drainage by Pumping in Red River Delta
Dang Ngoc Hanh*
Vietnam Academy for Water Resources
Received 22 October 2010; received in revised form 19 November 2010
Abstract. The demand for newly constructing of drainage pumping station in Red river delta has
increased recently. Total drainage volume for the whole region in 2006 was 2406.8m
3
/s, and it was
predicted to increase to 5181.3m
3
/s in 2020 [1]. The average drainage coefficient for the year from
2010 to 2020 will be 7.0 l/s per hectar, three and a haft time higher than the average drainage
coefficient for the period from 1954 to 1973; 1.8 times higher than 1973 to 1976 and 1.3 times
higher than 1976 to 2000. This article aims to provide the primary analysis of objective (drainage
requirement) and subjective factors (socio-economic condition, psychology, information, etc)
influencing on the demand of drainage. The out come shows that the draingae demand seems to be
impacted by subjective factors rather than objective ones.
1. Introduction
∗
Since 1954 Government had paid a lot of
attention on drainage in Red river delta. This
attention has increased recently. The scale of
drainage struture very much depends on
drainage coefficient which is calculated based
on drainage unit on area unit (l/s-ha). Through
water resources planning, the drainage
coefficient has been increased, from 1954 to
1973, the drainage ratio in region was 2.03l/s-
ha; from 1973 to 1976 it was 3.89 l/s-ha; and
from 1976 to 2000 it was 5.32 l/s-ha; During
the period from 2010 to 2020, the drainage
coefficient was predicted from 6.88 l/s-ha to
6.90 l/s-ha. There are a number of drainage
pumping stations which were designed at the
drainage coefficient of 12.50 l/s-ha.
In regards to drainage service area, the
master plan developed by Institute for Water
_______
∗
Tel.: 84-4-38522293.
E-mail:
Resources Planning shows that the drainage
requirement area for 2010 based on sustainable
senerior is 1,116,559 hectar [1]. Of which
drainage by pump serves for 731,432 hectars
(taking approximatly 63%) and gravity drainage
takes 435,127 hectars (taking 37%).
Based on the drainage requirement,
Ministry of Agriculture and Rural Development
(MARD) issued the list of investment for the
duration from 2011 to 2015, document
3505/BNN-KH on 28 October 2009, which
included thirty six projects with the total
proposed investment of 14,043 billion VND.
Among this list, there were 29 projects on
drainage. Regarding new construction of
pumping stations, within sixteen projects there
were only two irrigation pumping station
projects, fourteen projects were constructing of
drainage pumping station. Total investment for
newly constructing of sixteen pumping station
was 5,425 billion VND, of which 5,105 billion
VND was the cost for fourteen drainage
pumping station projects (taking 94%). This
D.N. Hanh / VNU Journal of Science, Earth Sciences 26 (2010) 121-127
122
number shows the necessity of new
construction of drainage pumping station in
near future, as well as indicates the important
role of drainage in developing the irrigation and
drainage system in Red river delta.
In order to investigate the main reason for
increasing in the requirement for more drainage
pumping station, this article will examine the
objective and subjective factors which
impacting on drainage requirement as well as
find out the appropriate attitude for drainage.
2. Objective factors
Objective factor impacting on drainage
requirement is intensive rainfall. Through
analyzing the changes in rainfall statistics, the
objective factors on drainage and drainage
solution will be examined. The analysis of
pumping drainage has been studied in 7
meteorology stations including Hai Duong,
Hung Yen, Ha Dong, Ha Nam, Nam Dinh,
Ninh Binh and Thai Binh. The statistical daily
rainfall data from 1976 to 2008 [2] for Phu Ly
station has been used for illustrating the 1, 3, 5,
and 7 days of the maximum intensive rainfall
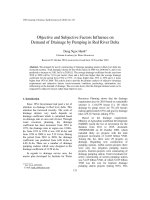
and the total rainfall at those stations (figure 1).
The rainfall data for other stations in Red river
delta is also demonstrated, and the evaluation as
below
Figure 1. Example of the 1, 3, 5, and 7 days maximum intensive rainfall
and total rainfall at Phu ly meteorolofy station.
D.N. Hanh / VNU Journal of Science, Earth Sciences 26 (2010) 121-127
123
- One day maximum intensive rainfall
seems to reduce, especially in Nam Dinh
meteorology station the rainfall has been
avaragely decrease 3.5 mm/year during 33
years of recording. Others seven meteorology
stations also have the same trend as Nam Dinh
station. The statistical data for Ha Dong
metrorology station shows a particular point of
intensive rainfall in November 2008 due to over
intensive rainfall on that year.
- In regards to three days maximum
intensive rainfall, five among seven
meteorology stations including Nam Dinh, Thai
Binh, Ninh Binh, Phu Ly and Hung Yen seem
to have a reduction in rainfall from 0.6 mm to
3.7 mm/year. There is only Hai Duong station
showing the increase in three day maximum
intensive rainfall, but it is negligible, only 0.6
mm/year. Regarding Ha Dong station, althought
it has been showed the increasing trend, it was
just an impact of historical rainfall in November
2008. If the figure is only presented for Ha
Dong station by 2007, it also shows the
reduction trend as same as other meteorology
stations.
- Regarding five day maximum intensive
rainfall, five within seven meteorology stations
show the reduction trend. The remarkable
reduction can be seen in Nam Dinh and Hung
Yen meteorology station, decreasing from 3.6
to 3.7 mm/year. There was no change in Hai
Duong meteorology station. The figure of Ha
Dong station seems to have the increasing trend
but it was because of historical rainfall in
November 2010
- Concerning seven day maximum intensive
rainfall, five among seven meteorology stations
show the reduction trend of about 3 mm/year.
The figure of Ha Duong station shows no
changes. The figure of Ha Dong station seems
to have the increasing trend but it was because
of historical rainfall in November 2010
- The total rainfall which was measured at
five among sevem meteorology stations seems
to decrease. The most reduction can be seen in
Hung Yen station in about 12mm/year. Nam
Dinh, Thai Binh, Phu Ly and Ninh Binh
stations have the reduction from 9 mm/ year to
10 mm/year. The figure of Ha Duong seems to
be stable. Ha Dong station has a trend of
increasing but this trend influenced by
historical rainfall in November 2008.
- In regards to characteristic of intensive
rainfall, it seems almost 1, 3, 5, or 7 days of
intensive rainfall often happened in the long
period of rain. This issue brings the nagative
impact on rainfall model simulation.
Analyzing the rainfall changes and trend
shows that the comparison of increasing in
drainage coefficient and drainage rainfall seems
to contradict. This contradiction can be
explaned as following
- Previously, the TCVN 285-2002 and
TCVN 5090 and other regulations regulated
that the drainage capacity in responding for
rainfall frequency of about 10 to 20%. Due to
difficulties in economy, the drainage capacity
could be selected at the rainfall frequency of
12%, 15% and event 20%. Nowadays, almost
of all planning and design often based on the
rainfall frequency of 10%.
- Design drainage coefficient also depends
on drainage model. In the past, because of
economic condition, the planner could be based
on rainfall model with fewer disadvantages in
order to reduce the design drainage coefficient.
Analyzing the changes in drainage of
intensive rainfall and factors impact on drainage
requirement and shows that rainfall seems not
to be an objective factor. Socio-economic,
changing in cropping pattern or other factors
might be the subjective factors impacting on
drainage requirement.
D.N. Hanh / VNU Journal of Science, Earth Sciences 26 (2010) 121-127
124
In addition, due to topography
characteristics of Red river basin slopes from
Northwest to Southeast, particularly the delta is
in the pan shape topography with the higher
elevation land located along the river bank and
deep valley is located on cultivated farm, these
conditons have nagative impacted on drainage
actitities, especially the central delta where
drainage by tide has been not in practice.
Therefore, the drainage pumping stations are
often located in the Red river delta such as
North Nam Ha, and Southwest of Nhue river
system.
3. Prediction factors on climate change
impact on drainage solutions
There are two main drainage solutions in
Red river delta which including pumping and
gravity. Gravity drainage takes small
percentage (below 30%) concentrating on
coastal zone areas. This drainage solution
makes used of ebbing tide for drainage. In
which, among 297,600 hectares of full gravity
drainage in the region [3], there are 279,300
hectares (taking 94%), located along coastal
zone in South and North of Thai Binh province,
central and South of Nam Dinh province, as
well as Hai Phong.
Climate change scenario, and sea water rise
for Vietnam has been developed by Ministry of
Natural Resources and Environment which was
declared in June 2009 indicating:
- According to low emission scenario,
rainfall in Red river delta and Thai Binh river
basin will increase 5%, while rainfall from
March to May will reduce from 3% to 6%. In
medium greenhouse gas emission, rainfall in
Red river delta will increase up to 10%, and
rainfall from March to May will decrease from
6% to 9%. Therefore, rainfall in rainy season
will remarkably increase which pressing on the
drainage demand. Particularly, it was predicted
that during the period from 2010 to 2020 and
2030, rainfall in Red river delta region will
increase by 1.6% to 2.3% in comparison to the
time from 1980 to 1999.
- In regards to low emission, medium
emission (B2) and high emission scenario
(A1F1) , sea level rise will increase by 0.65 m,
0.75 m and 1.0 m respectively at the end of this
century. From 2020 to 2030, it was predicted ,
sea level is projected increasing from 12 to 17
cm.
- The combination of rainfall and sea level
rise will narrow down the gravity drainage area
in coastal zone in the North. A large area will
be inundated and semi-inundated. According to
Prof Dr Dao Xuan Hoc [4] pointed out that the
inundated area in Red river delta will increase
to 550,000 hectares, 650,000 hecrares if sea
level rises up to 0.69 m and 1.00 m
respectively. In addition, the river level will rise
at the average level from 0.5 m to 1.0 m, exceed
alert 3. That means the water level in river
nearly approaches high crest of current dike. If
sea level rises up to 0.69 m, the area in Red
river delta with the elevation is below 0.8 m
(133,221 hectares) will be inundated, the area
with the elevation is higher than 2.2 m (300,319
hectares) will be semi-inundated; If sea level
rises up to 1m, the complete inundated area
below 1.5 m will be 181,917 hectares, and
semi-inundated area with the elevation below
2.5 m will be 365,431 hectares.
Climate change and sea level rise in any
scenerios always bring the strong impact on
drainage solutions, therefore drainage by pump
seems to be the only one solution for Red river
delta in the future
D.N. Hanh / VNU Journal of Science, Earth Sciences 26 (2010) 121-127
125
4. Impact of socio-economic development on
drainage requirement
Economic development is related to the
process of development, construction, upgrade,
and comprehension of infrastructure and the
changing of land use. Base on the research of
rainfall-runoff, drainage is affected by surface
area.
The research of rainfall- runoff is showed
the lost volume on the surface of hydraulic
structure by waterproof material which is tiny.
The rate of rigid surface increase which is
opposite with the loss of water therefore it is
danger of the amount of drained water and
describing by run-off coefficient.
The conception of run-off coefficient is
calculated by the ratio between suface water
(mm) by rainfall and the amount of water (mm)
σRoff = Y/P, where: Y: run-off by rainfall; P:
precipitation
In the developed countries, run-off
coefficient is researched by the sceintiest of
irrigation and drainage. After that, it will be
determined the other surface factors in different
areas, different regions, different crops.
Meanwhile, the research in run-off coefficient
in Vietnam which is too limited, even in
textbook, guide book the run-off coefficient is
copied from abroad research results.
Run-off coefficients of surface
Surface classification
Run-off coefficients σ
Roff
Surface classification
Run-off coefficients σ
Roff
Grass
- Sand, steep 2%
- Sandy loam, steep 2%
0.05-0.10
0.13-0.17
Industrial zone
- density rarely
- density dense
0.50-0.80
0.60-0.90
Urban land
Rural land
0.70-0.95
0.50-0.70
Amusement park 0.10-0.25
0.20-0.35
Stone 0.70-0.85 Railway 0.20-0.40
Streetside 0.75-0.85 Concrete 0.70-0.95
Roof 0.75-0.95 Mặt bê tông 0.80-0.95
Source: AFTER CHOW, 1962
Obviously, run-off coefficient is on surface
by infrastructure is compared with the other
land use objects, especially over 90% rainfall
will be a run-off on surface of cement, roof in
case no water storage or other multi use which
will have to drain.
In this case, the statistic of transportation in
Red river delta show the density of national,
provincial, districial highways is high, in range
0.5 km/km
2
[1], if the wide of road is 20m, the
area will has 1% of total zone. Similarity, the
density of village road is 1.81 km/km
2
[1], if the
wide of road is 3m, the area will has 0.54% of
total zone. The sup up of road will grow up to
1.54% (equal to 15,718 hectares). The area for
transportation is huge, the plan for land use in 6
provinces in the central delta includes Bac
Ninh, Ha Tay, Hai Duong, Hung Yen, Ha Nam
and Nam Dinh [5] in 2005, the transportation
area has 48,619 hectares, plan to 56,218
hectares in 2010, increase 7,599 hectares.
In the other, economic development will be
incresingly land for industry used. Statistical
data for Industry land used at 2005 in six
provinces in central of the delta and Thai Binh
province is 8,282 hectares, planning for 2010
will be predicted to 25,098 hectares, more than
three time higher. The change of land used
D.N. Hanh / VNU Journal of Science, Earth Sciences 26 (2010) 121-127
126
mostly form cultivation land and pond or lake
land, that is one of big reasons to incresingly of
darinage requirement because ron-off
coefficient for the industry land used from 0.5
to 0.9, in other for the cultivation land run-off
coefficient is only from 0.3 to 0.6 [6].
Urban land increased dramatically in 2005,
7 provinces in central delta has 8109 hectares
urban land which would be increased to 14,290
hectares area in 2010, 1.76 times increasing.
The cultivated land has been transferred into
urban land, which is the main reason causing
the demanding on drainage.
Rural land also increase many times which
is also transferred from cultivated land. In 2005,
7 provinces had 69,996ha, planned to 74,748
hectares in 2010, increasing of 4752 hectares.
Therefore the drainage demand will increase by
run-off coefficient from 0.5 to 0.7 in rural land
which reference from aboard document (note
that the population density in Red river delta is
122,000 people in a square kilometre, may be
higher than foreign countryside). It is much
higher than the run-off coefficient in cultivated
land [6].
The increasing in non cultivated land has
been contradicted is opposited with the
reduction area of lake, pond, stream and river.
In 2005, 7 provinces in central delta had 61,482
hectares; however its plan has gone down to
58,064 hectares in 2010. Almost of 3418
hectares reduction is pond and lake which are
water storage area and can be use to regulate
rainfall, because the using purpose might be not
changed from natural river and stream. There is
information show that, In Hanoi capital city,
80% of water surface area has regulated
capacity which has been leveling for
construction for 50 years by a source.
In addition, the area for rice (which can
regulate drain water) in some areas in central
delta has dramatical fall to 386,641ha, 71,170ha
mitigration which is significant number. If the
rice area in Red river delta drecrese 40,700ha
from 2000 to 2005 (report of MARD) and in 10
years, 2000 to 2010, there is at least 111,870ha
rice area (10%) total natural area in this delta
change to non agricultural purpose. The change
of land use to non agricultural purpose is
leading to the increase of drainage demand
many times which is compared with rice land
and cultivated land.
5. Discussion and recommenation
Obviously, all socio-economic indicators
have been indicating land use planning in all
provinces in Red river delta showing the
objective fators for increasing the drainage
demand. In the above analysis shows the rise of
amount of drain, and the drainage capacity also
increases by the drainage demand for
incultivated land which is drained by day. There
are 2 factors to increase the domain of area and
which are the main causes in order to the
increase of drainage coefficient demand.
Throught out the analysis, again we are able to
realize that the cause of increase drainage
coefficient is by the subject factors than
objective factors.
Beside the above analysis, there may be an
impact which is media commucation. This
impact influences in decision making process of
decision makers. For example, the information
is transferred quickly via media people and
often does not purely reflect the actual
situations. This strongly impacts on making the
decision which consequently effects on
planning of drainage system. The design
parameters of the drainage system are affected
by a series of factors therefore the consultants
seem to choose the negative factors for
D.N. Hanh / VNU Journal of Science, Earth Sciences 26 (2010) 121-127
127
designing which enable for easy approval. In
order to mitigate these potential impacts, the
government will need to have regular
researches on monitoring and evaluation of
drainage system. Findings from these
researches will be the foundation for developing
appropriate drainage system in order to
minimize the investment cost and wasting rain
water.
The analysis also show that the pumping
drainage structures seem having bigger capacity
which might increase by 2 times, reaching the
capacity of 5181.3 m
3
/s in coming 10 years.
Hence, it is necessary to conduct the researches
on appropriate solutions in order to upgrade and
modernize the drainage pumping system in Red
river delta. Especially, there is a particular need
to find the proper solutions for on farm
drainage, effective use of rainwater, against
groundwater depletion and analyse effective
investment to prove to the society the effect and
necessity of investing on drainage structures.
References
[1] Institute of Water Resources Planning: The
report of drainage planning, the project of
planning for using water with multi objectives in
Red – Thai Binh river delta, code 5390
QD/bNN-KH, Hanoi, 2006.
[2] Hydrometeorological data Centre: The table of
statistical rainfall data at all stations in Hai
Duong, Hung Yen, Ha Dong, Ha Nam, Nam
Dinh, Ninh Binh, Thai Binh provinces from 1976
to 2008.
[3] Bui Nam Sach, Fundamental research in science
and practice of determine the drainage zone in
north delta. The thesis of master of science.
Water Resources University. Hanoi 2000.
[4] Dao Xuan Hoc, The plan of climate change
adaptation in agriculture and rural development
– Workshop Vietnam adapt with climate change,
31 July 2009 in Hoi An – Quang Nam
[5] Governmental resolutions in 2007 to adjust Land
use planning to 2010 and the land use planning
for 5 years in Hai Duong, Hung Yen, Ha Dong,
Ha Nam, Nam Dinh, Ninh Binh, Thai Binh
provinces
[6] Pham Ngoc Hai and NNK, the Textbook of
Planning and Design the hydraulic construction
system, Construction Publishing house, 2006.