Health Inequalities: Report, together with formal minutes doc
Bạn đang xem bản rút gọn của tài liệu. Xem và tải ngay bản đầy đủ của tài liệu tại đây (2.2 MB, 143 trang )
House of Commons
Health Committee
Health Inequalities
Third Report of Session 2008–09
Volume I
Report, together with formal minutes
Ordered by the House of Commons
to be printed 26 February 2009
HC 286–I
[Incorporating HC 422-i to vii, Session 2007-08]
Published on 15 March 2009
by authority of the House of Commons
London: The Stationery Office Limited
£0.00
The Health Committee
The Health Committee is appointed by the House of Commons to examine the
expenditure, administration, and policy of the Department of Health and its
associated bodies.
Current membership
Rt Hon Kevin Barron MP (Labour, Rother Valley) (Chairman)
Charlotte Atkins MP (Labour, Staffordshire Moorlands)
Mr Peter Bone MP (Conservative, Wellingborough)
Jim Dowd MP (Labour, Lewisham West)
Sandra Gidley MP (Liberal Democrat, Romsey)
Stephen Hesford MP (Labour, Wirral West)
Dr Doug Naysmith MP (Labour, Bristol North West)
Mr Lee Scott MP (Conservative, Ilford North)
Dr Howard Stoate MP (Labour, Dartford)
Mr Robert Syms MP (Conservative, Poole)
Dr Richard Taylor MP (Independent, Wyre Forest)
Powers
The Committee is one of the departmental select committees, the powers of
which are set out in House of Commons Standing Orders, principally in SO No
152. These are available on the Internet via www.parliament.uk.
Publications
The Reports and evidence of the Committee are published by The Stationery
Office by Order of the House. All publications of the Committee (including press
notices) are on the Internet at www.parliament.uk/healthcom
Committee staff
The current staff of the Committee are Dr David Harrison (Clerk), Adrian Jenner
(Second Clerk), Laura Daniels (Committee Specialist), David Turner (Committee
Specialist), Frances Allingham (Senior Committee Assistant), Julie Storey
(Committee Assistant) and Jim Hudson (Committee Support Assistant).
Contacts
All correspondence should be addressed to the Clerk of the Health Committee,
House of Commons, 7 Millbank, London SW1P 3JA. The telephone number for
general enquiries is 020 7219 6182. The Committee’s email address is
Footnotes
In the footnotes of this Report, references to oral evidence are indicated by ‘Q’
followed by the question number, and these can be found in HC 286–II. Written
evidence is cited by reference in the form ‘Ev’ followed by the page number; Ev x
for evidence published in HC 422–II, Session 2007–08, on 3 April 2008, and HI x
for evidence to be published in HC 286–II, Session 2008–9.
Health Inequalities
1
Contents
Report
Page
Summary
5
1
Introduction
9
2
Health inequalities – extent, causes, and policies to tackle them
The extent of health inequalities
Measuring health inequalities
Causes of health inequalities
Access to healthcare
Lifestyle factors
Socio-economic factors
3
Designing and evaluating policy effectively
Lack of evidence
Inadequacy of evaluation
Difficulties in evaluating complex interventions
Poor design and introduction of interventions
Better evaluation
The ethical case for evaluation
Solutions
Conclusion
4
Funding for health inequalities
To what extent should health spending be redistributed to tackle health
inequalities?
Tensions between the redistributive model and the NICE approach
NICE and health inequalities
How PCTs are funded to tackle health inequalities
The Resource Allocation formula
PCT spending on tackling health inequalities
Allocation of funds by PCTs
Choosing Health money
Cost effectiveness
Solutions
Conclusion
5
Specific health inequalities initiatives
Health Action Zones
Conclusion
Sure Start
Has Sure Start worked?
Reasons for success and failure
The future: targeted or universal children’s services?
Conclusion
13
13
19
20
21
21
23
28
28
29
30
30
34
34
35
38
40
40
40
41
42
42
46
46
46
47
47
48
50
50
52
52
53
55
56
56
2
Health Inequalities
Targets and the Cross-Cutting review
Progress towards meeting the target
Criticisms of the target
The Cross-Cutting Review
Conclusion
Support for ‘Spearhead’ areas
The national support team
The Health Inequalities Intervention Tool
Conclusion
6
57
57
58
61
63
63
64
65
65
The role of the NHS in tackling health inequalities
67
Clinical interventions to tackle health inequalities
Clinical effectiveness and cost effectiveness
Targeted vs universal
Treatment
Screening
Health promotion
Conclusion
Strategic Health Authorities and Primary Care Trusts
Leadership and commissioning
Public health
Access to services
Conclusion
Primary care services
The Quality and Outcomes Framework (QOF)
Beyond the QOF – other ways of tackling inequalities through GP services
Conclusion
Secondary care and specialist services
Mental health services
Referral to smoking cessation and other health promotion services
Conclusion
Early years NHS services—maternity and health visiting
Maternity services
Health visiting
Conclusion
7
Tackling health inequalities across other sectors and departments
Joined up working in Whitehall and Government
Conclusion
Joined up working at a local level
Conclusion
Nutrition
School meals
Teaching people to cook healthily at home
Food labelling
Conclusion
Health education and promotion in schools
Personal, social and health education
67
67
68
69
69
71
74
74
75
75
76
79
79
80
83
83
83
84
84
86
87
88
89
90
91
91
93
93
94
94
96
97
98
99
100
100
Health Inequalities
The wider role of schools in reducing health inequalities
Physical activity in schools
Conclusion
The built environment
A sense of identity and community
Green space
Access to health and other essential services
Physical activity and the built environment
Prevalence of fast food outlets
Conclusion
Tobacco control
Tobacco legislation
Tobacco smuggling
Conclusion
8
A new approach to tackling health inequalities
Designing and evaluating policy effectively
Resource allocation and health inequalities
Specific health inequalities initiatives
Targets
Sure Start, Children’s Centres and the early years
The role of the NHS in tackling health inequalities
Effective interventions
Primary care services
Secondary and specialist services
NHS Early years services—health visiting and midwifery
PCTs and SHAs
Tackling health inequalities across other sectors and departments
Cookery and nutrition in schools
Food labelling
Health promotion in schools
The built environment
Tobacco control
Conclusions and recommendations
3
101
103
104
105
105
106
106
107
110
110
111
111
112
114
115
115
116
117
117
117
118
118
118
118
119
119
119
119
119
120
120
120
122
Formal Minutes
131
Witnesses
132
List of written evidence
135
List of further written evidence
138
List of unprinted evidence
140
List of Reports from the Health Committee
141
Health Inequalities
5
Summary
During the course of this inquiry, we heard widespread praise and support, both in this
country and abroad, for the explicit commitment this Government has made to tackling
health inequalities. This has involved a framework of specific policies, underpinned by a
challenging and ambitious target. The Government has also continued to switch resources
to the neediest areas; the neediest PCTs will receive 70% more funding than the least needy
in 2009-10.
However, whilst the health of all groups in England is improving, over the last ten years
health inequalities between the social classes have widened—the gap has increased by 4%
amongst men, and by 11% amongst women—because the health of the rich is improving
more quickly than that of the poor.
Health inequalities are not only apparent between people of different socio-economic
groups—they exist between different genders, different ethnic groups, and the elderly and
people suffering from mental health problems or learning disabilities also have worse
health than the rest of the population. The causes of health inequalities are complex, and
include lifestyle factors—smoking, nutrition, exercise to name only a few—and also wider
determinants such as poverty, housing and education. Access to healthcare may play a role,
and there are particular concerns about ‘institutional ageism’, but this appears to be less
significant than other determinants.
Lack of evidence and poor evaluation
One of the major difficulties which has beset this inquiry, and indeed is holding back all
those involved in trying to tackle health inequalities, is that it is nearly impossible to know
what to do given the scarcity of good evidence and good evaluation of current policy.
Policy cannot be evidence-based if there is no evidence and evidence cannot be obtained
without proper evaluation. The most damning criticisms of Government policies we have
heard in this inquiry have not been of the policies themselves, but rather of the
Government’s approach to designing and introducing new policies which make
meaningful evaluation impossible. Even where evaluation is carried out, it is usually “soft”,
amounting to little more than examining processes and asking those involved what they
thought about them. All too often Governments rush in with insufficient thought, do not
collect adequate data at the beginning about the health of the population which will be
affected by the policies, do not have clear objectives, make numerous changes to the
policies and its objectives and do not maintain the policy long enough to know whether it
has worked. As a result, in the words of one witness, ‘we have wasted huge opportunities to
learn’. Simple changes to the design of policies and how they are introduced could make all
the difference, and Chapter 3 of this report sets these out. Professor Sir Michael Marmot’s
forthcoming review of health inequalities offers the ideal opportunity for the Government
to demonstrate its commitment to rigorous methods for introducing and evaluating new
initiatives in this area which are ethically sound and safeguard public funds.
Resource allocation and health inequalities
The Department of Health is responsible for allocating resources to the NHS. The funding
6
Health Inequalities
formula ensures that there is a major redistribution of funds to the neediest PCTs
However, too many PCTs have not yet received their full needs-based allocations. The
Government must move more quickly to ensure PCTs receive their real target allocations.
Trade offs exist between redistribution of health resources to tackle health inequalities, and
the NICE model of distribution, based on investing in the most cost-effective treatment for
the whole populations. These trade offs have never been explicitly articulated and
examined and we recommend that they should be. In addition, more needs to be known
about the treatments and services which are displaced to fund the new treatments
recommended by NICE. The Government must also track the money which is spent to
tackle health inequalities and what it is spent on, both funds specifically allocated for health
inequalities initiatives, and mainstream funding that is directed towards this.
Specific health inequalities initiatives
The Government has introduced specific policies to tackle health inequalities; two of
particular importance were establishing health inequalities targets; and establishing Sure
Start.
In aiming to reduce health inequalities by 10% in ten years, the Government has
introduced a target which is arguably the toughest anywhere in the world, and which has
received international plaudits. Despite the likelihood that the target will be missed, we
believe that aspirational targets such as this can prove a useful catalyst to improvement,
and we therefore recommend that the commitment be reiterated for the next ten years.
However, a review of the measures used is needed to ensure that important areas of health
inequalities—including age and gender related inequalities, and those relating to mental
health—are not neglected.
We commend the Government for taking positive steps to place early years at the heart of
policy to address health inequalities through Sure Start. Many witnesses were very positive
about the benefits of Sure Start. National evaluation shows that it has enjoyed some
success. However, Sure Start has still not demonstrated significant improvements in health
outcomes or health inequalities for either children or parents. This policy, originally
introduced to specifically target those in deprived areas, is now being extended, without
any prior piloting, to all areas of the country regardless of level of deprivation. Early years
interventions must remain focused on those children living in the most deprived
circumstances and the impact of Children’s Centres must be rigorously monitored.
The role of the NHS in tackling health inequalities
The NHS has the capacity to tackle health inequalities by providing excellent services
targeted at, and accessible to those who need them. The NHS has introduced a number
interventions on a massive scale to reduce Coronary Heart Disease and identify cancers at
an early stage. Whilst evidence exists to support the clinical effectiveness of some
interventions, such as prescribing antihypertensive and cholesterol-reducing drugs, less is
known about their cost effectiveness, and in particular about how to ensure they are
targeted towards those in the lowest socio-economic groups so that they actually have an
impact on health inequalities. The Government is to introduce vascular checks; we urge it
to do so with great care, and according to the steps outlined in chapter three, so that it does
Health Inequalities
7
not waste another crucial opportunity to rigorously evaluate the effectiveness and cost
effectiveness of this screening programme.
Getting people to adopt a healthy lifestyle is widely acknowledged to be difficult, and
evidence suggests that traditional public information campaigns are not successful with
lower socio-economic or other hard-to-reach groups—in fact we were told that these
interventions can actually widen health inequalities because richer groups respond better
to health promotion messages. Social marketing is heralded as an approach that allows
messages to be communicated in more tailored and evidence based ways, but more
evidence is needed in this area. We make recommendations below about measures to
change lifestyles.
Primary care services are at the frontline of tackling health inequalities; we received many
suggestions for additions to the QOF points system. It is clear that the QOF needs radical
revision to fully take account of health inequalities. In particular, the QOF should be
redesigned so that more points are awarded for success with smoking cessation, rather than
merely identifying a smoker. However, additions to the QOF may be costly and this can
only be done if other things are removed.
In solely focusing on primary care, there is a real risk that inequalities in other NHS
services will persist, and that the opportunities which exist in secondary care and
specialised services to tackle inequalities will be missed. We recommend that the role of
secondary care in tackling health inequalities should be specifically considered by Professor
Sir Michael Marmot’s forthcoming review; this should include an examination of how the
Payment by Results framework and the Standards for Better Health might address health
inequalities.
We have been told repeatedly that the early years offer a crucial opportunity to ‘nip in the
bud’ health inequalities that will otherwise become entrenched and last a lifetime. While
there is little evidence about the cost-effectiveness of current early years services, it seems
odd that numbers of health visitors and midwives are falling, and members of both those
professions report finding themselves increasingly unable to provide the health promotion
services needed by the poorest families, at the same time as the Government reiterates its
commitments to early-years’ services.
Lack of access to good health services does not appear to be a major cause of health
inequalities. Nevertheless, some groups do receive poorer treatment than others. In
particular, charges of institutional ageism need to be investigated.
Tackling health inequalities across other sectors and Departments
Measures to enable people to adopt healthier lifestyles involve a range of Government
Departments. These other Departments could do far more than they do at present and the
Department of Health should take a stronger lead in getting them to do so. We list below a
number of areas where improvement is required as a matter of priority.
Nutrition
We are appalled that, four years after we first recommended it, the Government and FSA
are continuing to procrastinate about the introduction of traffic-light labelling to make the
8
Health Inequalities
nutritional content of food clearly comprehensible to all. In the light of resistance by
industry, and given the urgency of this problem, we recommend that the Government
legislate to introduce a statutory traffic light labelling system. A traffic light labelling system
should also be introduced for all food sold in takeaway food outlets and restaurants as well;
currently food purchased from such outlets, despite often having a very high calorie
content, does not have any nutritional labelling at all.
Health promotion in schools
We welcome the introduction of compulsory PSHE. However to date the effect of DCSF
initiatives, including the Healthy Schools programme, on health or health inequalities has
not been assessed. We recommend that the Department of Health and DCSF collaborate to
produce quantitative indicators and to set targets for the Healthy Schools programme.
The built environment
The built environment affects every aspect of our lives. During the inquiry we heard many
concerns: high streets awash with fast food outlets, flagship health centres located ‘at
random’ and planning policies which have created towns and cities dominated by the car,
with out-of-town supermarkets and hospitals, which have discouraged walking and
cycling. In our view, health must be a primary consideration in planning decisions. To
ensure that this happens, we recommend
•
The publication of a Planning Policy Statement on health, which should require the
creation of a built environment that encourages walking and cycling and should enable
local planning authorities to restrict the number of fast food outlets
•
that PCTs should be made statutory consultees for local planning procedures.
The Government should also increase the proportion of the transport budget currently
spent on walking and cycling.
Tobacco control
Smoking remains one of the biggest causes of health inequalities; we welcome both the
Government’s ban on smoking in public places, and its intention to ban point of sale
tobacco advertising, as evidence indicates that both of these measures may have a positive
impact on health inequalities. Unfortunately, tobacco smuggling, by offering smokers half
price cigarettes, negates the positive impact of pricing and taxation policies. Tobacco
smuggling has a disproportionate impact on the poor, particularly young smokers. Some
progress has been made in this area but not enough; there has been no progress at all in
reducing the market-share of smuggled hand-rolled tobacco, which is smoked almost
exclusively by those in lower socio-economic groups. We recommend the reinstatement of
tough targets and careful monitoring of them following the transfer of this crucial job to
UKBA, to ensure that it remains a sufficiently high priority. We also recommend that the
UK signs up to the agreements to control supply with the tobacco companies Philip Morris
International and Japan Tobacco International as a matter of urgency.
Health Inequalities
9
1 Introduction
1. The health of people in England has improved markedly over the last 150 years. In 1841
life expectancy at birth for men was 40.2 years and for women 42.2. By 1948 it was 66.4 and
71.2 years respectively. In 2000 the figures were 75.6 and 80.3.1 However, despite these
huge improvements, there are marked differences in the health of different groups. Such
health inequalities show themselves in many ways. The most notable English statistics
relate to the life expectancy of different social groups; the higher an individual’s social
group, the longer he or she is likely to live. There are striking differences between rich and
poor areas. In 2006 a girl born in Kensington and Chelsea has a life expectancy of 87.8
years, more than ten years higher than Glasgow City, the area in the UK with the lowest
figure (77.1 years).2
2. Health inequalities can be found in many aspects of health; for example, poor people not
only live less long than rich, but also have more years of poor health. Access to health is
also uneven. The old and disabled receive worse treatment than the young and ablebodied. A recent report has described the NHS as institutionally ageist.3
3. Inequalities are pervasive throughout the world. They are apparent in all developed
countries, including ones with highly developed welfare systems such as Norway and the
Netherlands which we visited.
4. Health inequalities have been studied for decades. Key works include the Black Report
(1980), the Acheson Report (1998) and more recently the final report of the WHO
Commission on the Social Determinants of Health (2008). Governments have made
serious efforts to address the problem. Since the 1970s poorer areas have received more
funds per head than richer ones. The present Government has made tackling health
inequalities a priority, introducing “the most comprehensive programme ever seen in this
country to address health inequalities”4. In 2003 it established the first ever national Public
Service Agreement (PSA) target for health inequalities:
By 2010 to reduce inequalities in health outcomes by 10 per cent as measured by
infant mortality and life expectancy at birth.
This is perhaps the toughest target adopted by any country in the world. In addition, to this
target, the Government has introduced a series of policies which are expected to reduce
inequalities, including Health Action Zones and Sure Start. The Department of Health has
continued the policy of allocating funds to PCTs according to need with major differences
in allocations per head: in 2009-10, Mid-Essex PCT is to receive £1,269 per head, City and
Hackney Teaching PCT £2,136, (£867 per head more than Mid-Essex) and Liverpool PCT
£2031.
1
Office of Health Economics, The Economics of Health Care, />
2
Office of National Statistics, Life Expectancy by Local Authority 1992–2006
3
See />
4
See />
10
Health Inequalities
5. Unfortunately, despite these efforts, health inequalities have continued to increase. This
is not because the poor are getting less healthy; life expectancy of the poorest quintile of the
population is now as high as that of the richest quintile 30 years ago. However, richer
people are getting healthier more quickly. Many think it unlikely that the Government’s
targets for 2010 will be met.
6. In view of the failure to reduce inequalities, we decided to hold an inquiry, mainly to see
what more the Government could do to improve outcomes. Given our remit our focus was
the contribution the NHS and the Department of Health could make. Our terms of
reference were:
•
The extent to which the NHS can contribute to reducing health inequalities, given
that many of the causes of inequalities relate to other policy areas e.g. taxation,
employment, housing, education and local government;
•
The distribution and quality of GP services and their influence on health
inequalities, including how the Quality and Outcomes Framework and Practicebased Commissioning might be used to improve the quality and distribution of GP
services to reduce health inequalities;
•
The effectiveness of public health services at reducing inequalities by targeting key
causes such as smoking and obesity, including whether some public health
interventions may lead to increases in health inequalities; and which interventions
are most cost-effective;
•
Whether specific interventions designed to tackle health inequalities, such as Sure
Start and Health Action Zones, have proved effective and cost-effective;
•
The success of NHS organisations at co-ordinating activities with other
organisations, for example local authorities, education and housing providers, to
tackle inequalities; and what incentives can be provided to ensure these
organisations improve care
•
The effectiveness of the Department of Health in co-ordinating policy with other
government departments, in order to meets its Public Service Agreement targets
for reducing inequalities; and
•
Whether the Government is likely to meet its Public Service Agreement targets in
respect of health inequalities.
7. During this inquiry, in November 2008, the Department of Health commissioned
Professor Sir Michael Marmot, Chairman of the WHO Commission on the Social
Determinants of Health, to advise the Secretary of State on the future development of a
health inequalities strategy post 2010, both for the short to medium term, and the long
term. The review is expected to report in late 2009. We very much welcome this review.
We make recommendations to be taken into account by the review team and will carefully
monitor its findings.
8. We received 143 memoranda and held eleven oral evidence sessions. Witnesses included
academics, representatives of PCTs, local authorities and charities, clinicians, planners,
chefs, members of the HM Revenue and Customs, the Border Control Agency and the
Health Inequalities
11
Food Standards Agency, Baroness Morgan of Dreflin, Parliamentary Under Secretary of
State at the Department of Children, Schools and Families and the Rt Hon Alan Johnson
MP, the Secretary of State for Health. We undertook a visit to Glasgow which was arranged
by the MRC Social and Public Health Sciences Unit. We would like to thank the Director
Professor Sally Macintyre and her team for organising it. We also went to the Netherlands.
In the Hague we met civil servants and the Foundation for Responsible Alcohol Use and
affiliated organisations, in Rotterdam, Professor Mackenbach, the leading expert in
international comparisons of health inequalities. Our visit to Norway enabled us to meet a
series of important figures, including the State Secretary, officials from the Ministry of
Health and Care Services, the Ministry of Finance, the Norwegian Institute of Public
Health, the Directorate of Health, and academics. We also visited a child health centre. We
would like to thank all those in the FCO who organised these visits and also Tysse Anders
Lamark and Tone Poulsson Torgersen who put together such an impressive programme.
We are especially grateful to our specialist advisers, Sheila Adam, retired director of public
health, Alan Maynard Professor of Health Economics, University of York and Chair, York
Hospitals NHS Foundation Trust, and Dr Alex Scott-Samuel, Director, EQUAL (Equity in
Health Research and Development Unit), Division of Public Health, University of
Liverpool. for their expertise and assistance.5
9. In the following report, chapter two examines the extent and causes of health
inequalities. The causes of inequalities are broad and some of them reach beyond the
capabilities and responsibilities of both the Department of Health and the NHS. Many of
our witnesses emphasised the importance of policies to address these wider, social
determinants of health and health inequalities. We do not doubt the impact of these wider
determinants, but we do not directly address them in this report for two reasons. First, we
do not have the expertise to consider what changes in tax and benefits and general public
policies might be most desirable and, secondly, we received no compelling evidence to
suggest that anybody knows at present what changes would be most effective at lowering
health inequalities. Our report therefore focuses on the effectiveness of the policies of the
Department of Health and the NHS.
10. Chapter three examines the Department of Health’s role in ensuring the robust design
and evaluation of policies through its Research and Development function. It is essential
that the Department ensures that lessons are learnt and that there is an appropriate
evidence base to inform future policy making.
11. The Department also allocates resources to the NHS to ensure that areas of high
deprivation which have consequently high health needs receive the funding they need to
deliver services properly. This is the subject of Chapter four.
12. In addition, the Government has introduced specific policies to tackle health
inequalities; including the ten-year health inequalities targets, community-based initiatives
(Health Action Zones, Sure Start, Healthy Towns), and the Health inequalities intervention
5
Professor Alan Maynard and Dr Alex Scott-Samuel declared no interests. Dr Sheila Adam retired from the NHS in
April 2007; currently working part time with Newham University Hospital NHS Trust; husband (John Mitchell) a
partner in Mitchell Damon, a consultancy which works with the NHS, other parts of the public sector, and the
voluntary sector; and worked with Professor Ian Jacob on “engagement” with the Comprehensive Biomedical
Centre (unremunerated) from May 2007
12
Health Inequalities
toolkit, which provides guidance to PCTs on specific clinical measures which will help
them make progress towards the target. Chapter five considers these issues.
13. The NHS has the capacity to tackle health inequalities by providing excellent services
which are accessible to those who need them by ensuring NHS organisations provide
treatment, screening, and health promotion services; Chapter six looks at the role of:
•
SHAs and PCTs, particularly in providing local leadership, undertaking public health
initiatives and improving access to services;
•
General Practice, including the place of the Quality and Outcomes Framework;
•
Secondary care and specialist services; and
•
Early years NHS services.
14. In chapter seven we consider the role played by the NHS and the Department of Health
in respect of policies outside their direct area of responsibility, in particular by providing
leadership across all sectors and government departments to promote joined up working to
tackle health inequalities; we examined a number of specific policy areas which are likely to
have an impact on health inequalities, including nutrition, health promotion in schools, the
built environment, and tobacco control.
15. Finally, chapter eight brings together the recommendations in this report which aim to
set out a new policy to tackle health inequalities.
Health Inequalities
13
2 Health inequalities – extent, causes, and
policies to tackle them
The extent of health inequalities
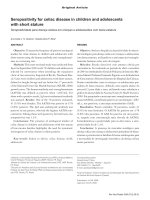
16. The last ten years have witnessed large improvements in health for everyone.
Life expectancy at birth for men & women in social class I (professional), social class V
(unskilled manual) and all, 1972–2005, England & Wales
Men
Women
90.0
life expectancy at birth
life expectancy at birth
85.0
80.0
75.0
70.0
65.0
85.0
80.0
75.0
70.0
65.0
60.0
60.0
1972-6
1982-86
1992-96
1972-6
2002-05
I
all
1982-86
1992-96
2002-05
V
Source: Professor Hilary Graham6
The figure above shows that although life expectancy increased for all social groups
between the periods 1972–6 and 2002–05, health inequalities—gaps in life expectancies
between social groups—have persisted.
6
Ev 172, Professor Hilary Graham
14
Health Inequalities
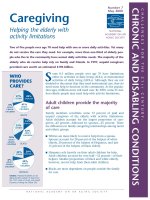
The widening mortality gap between social classes
Standardised Mortality Ratios, indexed to 1930–32
Log Scale
Social class
160
125
100
1.2
times greater
80
V - Unskilled
63
2.9
times
greater
50
40
30
25
1930-32
1949-53
1959-63
Year
1970 72
1979-83*
Average of all men
of working age
in england and Wales
I - Professional
1991-93
*1979-83 excludes 1981
England and Wales. Men of working age (varies according to year, either aged 15 or 20 to age 64 or 65)
Note: These comparisons are based on social classes I & V only.
Source: Office for National Statistics (see References Section)
Years
Professional
Managerial & technical
Skilled non-manual
Skilled manual
Male
Semi-skilled manual
Female
Unskilled manual
0
20
40
60
80
100
7
Life expectancy at birth by social class and sex, 1997–99, England and Wales
17. In fact, since the baseline period when the Government began to measure progress
towards its target to reduce health inequalities (1995–97), the gap between the ‘routine and
manual’ groups and the population as a whole has widened. The gap in men’s life
expectancy in the period 2005–07 was 4% wider than the baseline period, while for women,
7
Source – ONS - />
Health Inequalities
15
this gap was 11% wider. From 2005–07, infant mortality in routine and manual groups was
16% higher than in the population as a whole, compared to 13% in the baseline period.8
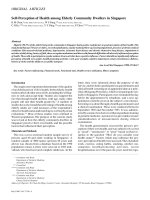
18. The UK is not alone in suffering from pervasive health inequalities, which have been
defined as ‘systematic differences in health status between different socio-economic
groups’.9 The following graphs show the relative inequalities10 in mortality, by level of
education, across European countries:
Relative inequalities in total mortality by level of education in Men
5
Relative index of inequality
4
3
2
EU
EST
LIT
POL
CZR
HUN
SLO
BSQ
MAD
BAR
TUR
FRA
SWZ
BEL
ENG
DEN
NOR
SWE
FIN
1
Source: Eurothine report 2007
8
Tackling Health Inequalities: 2005-07 Policy and Data Update for the 2010 National Target, DH, 2008;
/>
9
Levelling Up: 'Social inequalities in health concern systematic differences' in health status between different
socioeconomic groups', Dahlgren and Whitehead, WHO, 2007
10
The relative index of inequality is a summary measure comparing the risk of death between different socioeconomic
groups
16
Health Inequalities
Relative inequalities in total mortality by level of education in Women
5
Relative index of inequality
4
3
2
EUR
EST
LIT
POL
CZR
HUN
SLO
BSQ
MAD
BAR
TUR
FRA
SWZ
BEL
ENG
DEN
NOR
SWE
FIN
1
Source: Eurothine report 2007
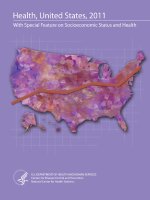
19. Unsurprisingly, the major causes of mortality, including coronary heart disease, also
follow a socio-economic gradient:
Age-standardised death rates for CHD and stroke, adults aged 15 to 64, 1993 to 2003,
England and Wales
140
CHD MEN
Deaths per 100,000 population
120
100
80
60
40
CHD WOMEN
STROKE MEN
20
STROKE WOMEN
0
1
2
3
4
5
6
7
8
9 10 11 12 13 14 15 16 17 18 19 20
Deprivation twentieth
Source: British Heart Foundation11
20. The following data from ONS demonstrates that there are differences in England not
only in life expectancy, but in health—with women in the most deprived wards on average
succumbing to poor health on average 13.6 years earlier than their counterparts in the least
11
/>
Health Inequalities
17
deprived wards. Years of healthy life expectancy are dark shaded and years of poor health
are light shaded:
Women
Years of healthy life expectancy (LE) and poor health by deprivation level
Most deprived
wards
51.7
Least deprived
wards
26.3
68.5
12.7
Healthy LE
Poor health
Most deprived
wards
49.4
Men
22
Least deprived
wards
66.2
0
10
20
30
11.2
40
50
60
70
80
90
Source – HI 101, Professor Kay-Tee Khaw
For infant mortality, the picture is similar. The infant mortality rate has fallen significantly
throughout the twentieth century in response to improved living conditions, availability of
healthcare and other factors—even the last 30 years have seen dramatic improvements (in
1978 the infant mortality rate was 13.2/1000, compared with 4.8/1000 in 2007).12 Despite
this, differentials still exist by father's socio-economic status, birthweight, marital status of
parents and mother’s country of birth. For babies registered by both parents, the infant
mortality rate is highest for babies with fathers in semi-routine and routine occupations—
5.4/1000 compared to the national average of 4.9/1000. Moreover, the decrease of 5% in the
infant mortality rate for this group between 1994 and 2002 was far smaller than the 16%
fall in the overall infant mortality rate.
21. Health inequalities can be defined as either absolute or relative. Absolute inequalities
are calculated by subtracting one figure or rate (e.g. deaths or death rate in social class 1)
from another (e.g. deaths or death rate in social class 5). Relative inequalities are calculated
by dividing one number or rate by another. Thus, absolute inequalities are simple
arithmetic differences, while relative inequalities are ratios.
22. In England, health inequalities are generally measured in terms of socio-economic
class, and action is targeted towards tackling this specific aspect of health inequalities. But
there are many other dimensions of health inequalities, which are arguably just as valid
candidates for measurement and targeting.
23. There are differences in health between ethnic groups. In April 2001 Pakistani and
Bangladeshi men and women in England and Wales reported the highest rates of both
12
Source – ONS - />
18
Health Inequalities
poor health and limiting long-term illness, while Chinese men and women reported the
lowest rates. The figure below shows the percentages of people in different ethnic groups
suffering from poor health and limiting illness in 2001.
Percentages
White British
White Irish
Male
Female
Other White
Mixed
Indian
Pakistani
Bangladeshi
Other Asian
Black Caribbean
Black African
Other Black
Chinese
Any other ethnic group
0
5
10
15
20
25
30
Age-standardised limiting long-term illness: by ethnic group and sex, April 2001, England and Wales
Source - ONS
13
•
South Asian people are reported to have high rates of heart disease and of hypertension;
•
Black Caribbean people are reported to have high rates of hypertension, but not of
heart disease;
•
All ethnic minority groups are reported to have high rates of diabetes, but low rates of
respiratory illness;
•
Black Caribbean people, particularly young men, have high rates of admission to
hospital with severe mental disorders (psychosis).14
24. It is claimed that inequalities in health exist between young and old, and that the old
receive poorer treatment and are denied access to certain procedures.15
25. Gender inequalities also exist. The Men’s Health Forum argue that men’s life
expectancy is more severely affected by deprivation than that of women, and point out that
gender inequalities exist in many different health outcomes:
•
Three quarters of all suicides are by men.
•
67% of men are overweight or obese compared to 58% of women.
13
Source – ONS - />
14
HI 120 – Professor James Nazroo
15
Ev 194–196
Health Inequalities
•
19
Men are almost twice as likely to develop and to die from the ten most common
cancers that affect both sexes.16
26. Those suffering from a range of physical and intellectual impairments and disabilities
also experience poorer health outcomes than other parts of society. Those with
schizophrenia are 90% more likely to get bowel cancer, 42% more breast cancer, have
higher rates of diabetes, coronary heart disease, stroke and respiratory disease, and on
average die 10 years younger than counterparts without mental health problems.17
27. Health outcomes also vary by geographical area—there is a substantial but not
complete overlap with social class, with some evidence of the impact of place independent
of other factors. There is some evidence that poorer people living in a deprived area suffer
worse health than those in a mixed community.18
Measuring health inequalities
28. While the statistics presented above provide a broadly accurate view, it should be noted
that measuring health inequalities is a complex and inexact science. This section discusses
some of the difficulties associated with it. These difficulties do not negate the importance of
collecting these data, but serve to illustrate why such measurements need to be treated with
caution.
29. Data on socio-economic status and health are available from a number of sources,
including the decennial census, government-sponsored household surveys, and birth and
death records. Some of the most important information comes from an ONS longitudinal
cohort which represents 1% of the population of England and Wales. The class to which
individuals are allocated is determined by their job. In longitudinal data the individual's
earliest known point of employment is used for this purpose, supplemented if necessary by
the socio-economic status of other household members.
30. Most statistics on inequalities are disaggregated by age and gender. National figures on
inequalities by disability and ethnicity are not easily available. ONS publishes limited
figures on inequalities at regional and local authority levels, while PCTs and other
organisations sometimes monitor these aspects of health inequalities at a local level.
31. Life expectancy is one of the target areas chosen by government; for geographical
breakdowns it is measured by place of residence at death. We did hear concerns about the
impact of population mobility on life expectancy calculations, but as the great majority of
moves are within a local authority area, this is unlikely to have a large impact. The
exception to this may be with recording and targeting health inequalities related to
ethnicity, where large-scale migration, and the loss to studies of individuals who have left
the country, might be a factor.
16
Ev 72
17
Ev 302–304; Q 477
18
Neighbourhood deprivation and health: does it affect us all equally?, Stafford M, Marmot M, International Journal
of Epidemiology, 32 (3), 357–366
20
Health Inequalities
32. Infant mortality is the other aspect of the Government’s health inequalities target. The
first problem with this is that the measure of infant mortality only takes account of
children born to parents where the father’s occupation can be registered. Where a mother
registers as a sole parent, that baby falls into another category which lies outside the target,
and as sole-registered births have higher infant mortality rates even than those babies born
to fathers who are in the manual and routine occupations, this means that current
measures of infant mortality are likely to underestimate the true scale of inequalities in this
area.19
33. As numbers of infant deaths are now so low, it is very difficult to discriminate between
areas in a statistically sound way, as only a couple of random occurrences of infant deaths
are needed to alter the picture.20
34. Comparing health inequalities internationally is also fraught with difficulty. This is
because different countries may use different data sources that are not comparable: there
may be differences in recording health statistics and differences in recording socioeconomic status, with some countries using different measures altogether; education, for
example, is commonly used in Europe. The best source of data for international
comparisons remains the Eurothine project21 but the caveats listed above apply to this as
well.
Causes of health inequalities
35. While health inequalities are generally described in terms of socio-economic class, it is
also possible to consider health inequalities using the ‘Human Capital’ model: each
individual is born with a certain amount of “physiological stock”, which is affected by
genes, and by antenatal factors. This stock depreciates over the course of an individual’s
life, and can be augmented or not over life by lifestyle behaviours (including diet, stress,
smoking, exercise).22 The inter-generational causes of health inequalities are also crucial.
Inequalities in health are passed from one generation to the next. This is not only to do
with genetic factors, but the mothers’ health behaviours during pregnancy and
circumstances and behaviour as they raise their children.23 Equally, health behaviours may
be learnt by children from their parents at a young age.
36. This section considers lifestyle factors, and then their underlying causes socioeconomic causes. But first we consider what role is played by access to health care in
causing health inequalities.
19
Q 117
20
HI 143
21
Tacking health inequalities in Europe: an integrated approach, Eurothine, Rotterdam 2007
22
"The human capital model", Michael Grossman, Handbook of Health Economics, volume 1 A, chapter 7, pages 367–
408 edited by AJ Culyer and JP Newhouse North Holland-Elsevier, 2000, Amsterdam, Oxford and New York
23
Fetal origins of adult disease, DJP Barker(ed), BMJ Books , London 1992
Health Inequalities
21
Access to healthcare
37. Some specific aspects of inequalities in health are attributed to differential access to,
and standards of, health care. These matters are considered more fully in Chapter 6. The
most compelling concern is about access related to age-related inequalities.24 However
most of our witnesses agreed with Margaret Whitehead, Professor of Public Health at the
University of Liverpool, that “inadequate access to health services is only one of many
determinants of the observed inequalities in health, and a relatively minor one at that”.25
Lifestyle factors
38. The lifestyle factors which influence health inequalities are sometimes referred to as the
“proximate” causes of health inequalities, because they are the immediate precursors of
disease, as opposed to the ‘distal’, ‘upstream’ or ‘wider determinants’, such as poverty,
housing or education. They include:
•
smoking
•
alcohol consumption
•
nutrition
•
exercise
•
weight
•
drug use
•
sexual behaviour
•
stress
39. As the figures below show, lifestyle factors such as smoking, nutrition and obesity
follow the same socio-economic gradient that is evident in the distribution of mortality and
of the major causes of mortality.
24
Age Concern argued that too often the organisation of health services directly discriminates against people on the
grounds of age, resulting in health inequalities. These include: Mental health services, which are often focused on
‘adults of working age’ and may exclude older people; breast and bowel cancer screening programmes are still not
extended upwards to the maximum ages at which people can achieve health gains. HI 59.
25
HI 106 – Margaret Whitehead
22
Health Inequalities
Smoking prevalence and socio-economic disadvantage
CIGARETTE SMOKING BY DEPRIVATION IN GREAT BRITAIN: GHS 1973 & 2004
80
70
60
% prevalence
50
1973
40
2004
30
20
10
0
0
Most affluent
1
2
3
4
Poorest
DEPRIVATION SCORE
Fruit and vegetable consumption by sex and socio-economic group, 2001, England
Socio-economic group of household reference person
Fruit and
vegetable
consumption
Managerial &
professional
occupations
Intermediate
occupations
Small
employers &
own account
workers
Lower
supervisory &
technical
occupations
Semi-routine
& routine
occupations
(portions per
day)
%
%
%
%
%
None
5
8
8
9
12
All with 5
portions or
more
28
24
25
22
18
4
6
6
8
25
27
26
21
Men
Women
None
All with 5
portions or
more
35
Source: British Heart Foundation
Health Inequalities
23
Trends in Obesity Prevalence 1993–2004 by Social Class I and V
35
Men social class I
Men social class V
Women social class I
Women social class V
30
% obese
25
20
15
10
5
0
1993
1994
1995
1996
1997
1998 1999
2000
2001
2002
2003
2004
Source: Foresight Tackling Obesities: Future Choices—Modelling Future Trends in Obesity and Their Impact on
Health
40. The potential for behavioural changes to affect health inequalities is borne out by
research described to us by Kay-Tee Khaw, Professor of Clinical Gerontology at the
University of Cambridge, which indicates that certain health behaviours, irrespective of
socio-economic grouping, have an impact on health outcomes:
In EPIC-Norfolk, we observed that men and women who had four health
behaviours—not smoking; not being physically inactive, moderate alcohol intake
(more than 1 and less than 14 units a week: a unit is half a pint of beer or a glass of
wine); and eating five servings of fruit and vegetables a day as estimated using blood
vitamin C level—had a quarter the subsequent death rate and survival equivalent to
men and women 14 years younger who did not have any of these behaviours. This
relationship was consistent irrespective of age, social class or obesity. These
behaviours are entirely achievable: 30% of this free living population were already
practising all four behaviours.26
Socio-economic factors
41. However, these lifestyle-related causes of health inequalities reflect what are frequently
referred to as the underlying causes—income, socio-economic group, employment status
and educational attainment. There are many reasons why the poorest in society are less
likely to adopt beneficial health behaviours. Firstly, information about how to behave
healthily may not reach some groups of society; secondly, they may lack the material
resources to live healthily, and the environments in which they live may make this doubly
hard; behaviours such as smoking tend to be more heavily entrenched in those from lower
socio-economic groups which makes positive change harder; and finally, for people living
26
HI 101 - The EPIC-Norfolk (European Prospective Investigation into Cancer in Norfolk) is a prospective population study of 25,000 men and women aged 40–79 years resident in East Anglia
first surveyed in 1993–97 and followed up to the present for changes in health