A REVIEW OF SELECTED PERSISTENT ORGANIC POLLUTANTS potx
Bạn đang xem bản rút gọn của tài liệu. Xem và tải ngay bản đầy đủ của tài liệu tại đây (1.01 MB, 149 trang )
PCS/95.39
December 1995
A REVIEW
OF SELECTED
PERSISTENT ORGANIC POLLUTANTS
DDT-Aldrin-Dieldrin-Endrin-Chlordane
Heptachlor-Hexachlorobenzene-Mïrex-Toxaphene
Polychlorinated biphenyls
Dioxins and Furans
Please note that the pagination and layout of this pdf file are not identical to the printed
document
Prepared by:
L. Ritter, K.R. Solomon, J. Forget
Canadian Network of Toxicology Centres
620 Gordon Street
Guelph ON, Canada NIG 2W1
and
M. Stemeroff and C. O’Leary
Deloitte and Touche Consulting Group
98 Macdonell St., Guelph ON, Canada NlH 2Z7
For:
The International Programme on Chemical Safety (IPCS)
within the framework of the
Inter-Organization Programme for
the Sound Management of Chemicals (IOMC)
This Review is produced for the International Programme on Chemical Safety (IPCS). The work is
carried out within the framework of the Inter-Organization: Programme for the Sound Management of
Chemicals (IOMC).
The Review does not necessarily represent the decisions or the stated policy of the United Nations
Environment Programme, the International Labour Organisation, or the World Health Organization.
The International Programme on Chemical Safety (IPCS) is a joint venture of the
United Nations Environment Programme, the International Labour Organisation,
and the World Health Organization. The main objective of the IPCS is to carry
out and disseminate evaluations of the effects of chemicals on human health and
the quality of the environment. Supporting activities include the development of
epidemiological, experimental laboratory, and risk-assessment methods that
could produce internationally comparable results, and the development of human
resources in the field of chemical safety. Other activities carried out by the IPCS
include the development of know-how for coping with chemical accidents,
strengthening capabilities for prevention of an response to chemical accidents
and their follow-up, coordination of laboratory testing and epidemiological
studies, and promotion of research on the mechanisms of the biological action of
chemicals.
The Inter-Organization Programme for the Sound
Management of Chemicals (IOMC ), was
established in 1995 by UNEP, ILO, FAO, WHO,
UNIDO, and OECD (Participating Institutions),
following recommendations made by the 1992 UN
Conference on Environment and Development to
strengthen cooperation and increase international
coordination in the field of chemical safety. The
purpose of the IOMC is to promote coordination of the
policies and activities pursued by the Participating
Organizations, jointly or separately, to achieve the
sound management of chemicals in relation to
human health and the environment.
This document is rot a formal publication of the World Health Organization (WHO), and all rights are
reserved by the Organization.
The views expressed in documents by named authors are solely the responsibility of those authors.
December 1995 i
PREFACE
At its Ninth meeting in May 1995, the UNEP Governing Council adopted Decision 18/32 concerning
Persistent Organic Pollutants. The decision invites the Inter-Organization Programme for the Sound
Management of Chemicals (IOMC), working with the International Programme on Chemical Safety
(IPCS) and the Intergovernmental Forum on Chemical Safety (IFCS) to undertake an expeditious
assessment process addressing persistent organic pollutants (POPs). This process is to initially begin
with 12 specific compounds'
1
and should consolidate existing information on the relevant chemistry
and toxicology, transport and disposition, as well as the availability and costs of substitutes to these
substances. The effort will also assess realistic response strategies, policies, and mechanisms for
reducing and/or eliminating emissions, discharges, and other losses of these substances. This
information will serve as the basis for recommendations to be developed by the IFCS on potential
international actions to be considered at the session of the UNEP Governing Council and the World
Health Assembly in 1997.
IPCS, in consultation with the organizations participating in the IOMC, has proceeded with the initial
phase of the work. The initial effort aims to compile the existing information on the chemistry,
toxicology, relevant transport pathways and the origin, transport and disposition of the substances
concerned and additionally, reference briefly what information is available on the costs and benefits
associated with substitutes, and the socio-economic aspects of the issue. The effort builds on ongoing
activities including the substantial work in progress under the Long-range Transboundary Air
Pollution Convention and the 1995 International Expert Meeting on POPs sponsored by Canada and
the Philippines.
This Review document is the full text of a companion document "Persistent Organic Pollutants: An
Assessment Report on DDT, Aldrin, Dieldrin, Endrin, Chlordane, Heptachlor, Hexachlorobenzene,
Mirex, Toxaphene, Polychlorinated Biphenyls, Dioxins and Furans (PCS 95.38)". The reader who
desires a shortened version should consult the Assessment Report cited above. These documents will
serve as a basis for development of a workplan to complete the assessment process called for in the
UNEP Governing Council Decision.
Readers of this Review are reminded that definitions used herein are not the result of any international
discussion or agreement, but rather are solely for the use of this paper.
1
Substances identified in the UNEP Governing Council Decision on Persistent Organic Pollutants include PCBs, dioxins
and furans, aldrin, dieldrin, DDT, endrin, chlordane, hexachlorobenzene, mirex, toxaphene, and heptachlor.
December 1995 1
1. SUMMARY
Persistent organic pollutants (POPs) are organic compounds that, to a varying degree, resist
photolytic, biological and chemical degradation. They are characterized by low water solubility and
high water solubility, leading to their bioaccumulation in fatty tissues. They are also semi-volatile,
enabling them to move long distances in the atmosphere before deposition occurs. Although many
different forms of persistent organic pollutants may exist, both natural and anthropogenic, persistent
organic pollutants which are noted for their persistence and bioaccumulative characteristics include
many of the first generation organochlorine insecticides such as dieldrin, DDT, toxaphene and
chlordane and several industrial chemical products or byproducts including polychlorinated biphenyls
(PCBs), dibenzo-p-dioxans (dioxins) and dibenzo-p-furans (furans). Many of these compounds have
been or continue to be used in large quantities and, due to their environmental persistence, have the
ability to bioaccumulate and biomagnify. Some of these compounds such as PCBs, may persist in the
environment for periods of years and may bioconcentrate by factors of up to 70,000 fold.
Persistent organic pollutants are also noted for their semi-volatility; that property of their physico-
chemical characteristics that permit these compounds to occur either in the vapour phase or adsorbed
on atmospheric particles, thereby facilitating their long range transport through the atmosphere. The
properties of unusual persistence, when coupled with other characteristics such as semi-volatility,
have resulted in the presence of compounds such as PCBs all over the world, even in regions where
they have never been used. POPs are ubiquitous. They have been detected in both industrialized and
non-industrialized, in urban and rural localities, in densely populated areas and in those that are
sparsely inhabited. POPs have been measured in every continent at sites representing every major
climatic zone and geographic sector throughout the world. These include remote regions such as the
open oceans, the deserts, the Arctic and the Antarctic, where no significant local sources exist and the
only reasonable explanation for their presence is long-range transport from other parts of the globe.
PCBs have been reported in air, in all areas of the world, at concentrations up to 15ng/m
3
; in
industrialized areas, concentrations may be several orders of magnitude greater. PCBs have also been
reported in rain and snow.
The group of persistent organic pollutants includes two types of important compounds: polycyclic
aromatic hydrocarbons and halogenated hydrocarbons. This latter group includes the organochlorines
which, historically, have proven to be most resistant to degradation and which have had the widest
production, use and release characteristics. Organochlorines are also generally the most persistent of
all the halogenated hydrocarbons. In general, it is known that the more highly chlorinated biphenyls
tend to accumulate to a greater extent than the less chlorinated PCBs; similarly, metabolism and
excretion are also more rapid for the less chlorinated PCBs than for the highly chlorinated biphenyls.
Humans can be exposed to POPs through the direct exposure, occupational accidents and the
environment (including indoor). Short-term exposures to high concentrations of POPs may result in
illness and death. Chronic exposure to POPs may also be associated with a wide range of adverse
health and environmental effects.
Laboratory investigations and environmental impact studies in wildlife have provided evidence that
persistent organic pollutants may be involved with endocrine disruption, reproductive and immune
dysfunction, neurobehavioral and developmental disorders and cancer. More recently some authors
have implicated persistent organic pollutants in reduced immunity in infants and children, and the
concomitant increase in infection, also with developmental abnormalities, neurobehavioural
impairment and cancer and tumour induction or promotion. Some POPs are being considered as a
potentially important risk factor in. the etiology of human breast cancer.
2 December 1995
2. INTRODUCTION
The behaviour and fate of chemicals in the environment is determined by their chemical and physical
properties and by the nature of their environment. The chemical and physical properties are
determined by the structure of the molecule and the nature of the atoms present in the molecule.
Depending on the structure of the molecule, these physical and chemical properties span a large range
of values. Compounds may be of very low persistence, of low toxicity and be immobile. At low levels
of exposure, these compounds are unlikely to present a risk to the environment or to human health. At
the other end of the scale are those compounds that are persistent, mobile and toxic and it is this range
of the distribution where the persistent toxic and lipophilic organic pollutants are found. It must be
recognized that relatively few substances possess the necessary properties to make them persistent
organic pollutants. In fact, if the range of these properties were presented as a distribution, only those
compounds at the extreme ends of the distribution would express the degree of persistence, mobility
and toxicity to rank them as persistent organic pollutants (Figure 1).
2.1 PERSISTENCE, MOBILITY AND
BIOAVAILABILITY
Some substances may be very persistent in the
environment (i. e. with half-lives (t
1/2
)
greater
than 6 months). The nature of this persistence
needs to be clarified - it is the length of time the
compound will remain in the environment before
being broken down or degraded into other and
less hazardous substances. Dissipation is the
disappearance of a substance and is a
combination of at least two processes,
degradation and mobility. It is not an appropriate
measure of persistence as mobility may merely
result in the substance being transported to other
locations where, if critical concentrations are
achieved, harmful effects may occur.
One important property of persistent organic
pollutants is that of semi-volatility. This property
confers a degree of mobility through the
atmosphere that is sufficient to allow relatively
great amounts to enter the atmosphere and be
transported over long distances. This moderate
volatility does not result in the substance
remaining permanently in the atmosphere where
it would present little direct risk to humans and organisms in the environment. Thus, these substances
may volatilize from hot regions but will condense and tend to remain in colder regions. Substances
with this property are usually highly halogenated, have a molecular weight of 200 to 500 and a vapor
pressure lower than 1000 Pa.
In order to concentrate in organisms in the environment, persistent organic pollutants must also
possess a property that results in their movement into organisms. This property is lipophilicity or a
tendency to preferentially dissolve in fats and lipids, rather than water. High lipophilicity results in the
substance bioconcentrating from the surrounding medium into the organism. Combined with
persistence and a resistance to biological degradation, lipophilicity also results in biomagnification
Figure 1 Illustration showing the
combination of properties needed for a
substance to be a persistent organic
pollutant.
Toxicity
Low
High
Frequency
Frequency Frequency
December 1995 3
through the food chain. Biomagnification results in much greater exposures in organisms at the top of
the food chain.
2.2 LONG-RANGE TRANSPORT
Persistent organic pollutants must therefore, by definition, be more persistent, more mobile A and
more bioavailable than other substances. These properites are conferred by the structural makeup of
the moleculas and are often associated with greater degrees of halogenation. Included in this group of
substances are some older chlorinated pesticides like DDT and the chlordanes, polychlorinated
biphenyls, polychlorinated benzenes, and polychlorinated dioxins (PCDDs) and furans (PCDFs). The
physico-chemical properties of these compounds are such that they favour sufficiently high
atmospheric concentrations that result in global redistribution by evaporation and atmospheric
transport.
3. ENVIRONMENTAL FATE AND TRANSPORT
3.1 INTRODUCTION
Aknowledge of the factors that affect the fate and transportation of persistent organic pollutants is
critical to understanding how and why these substances have become a worldwide problem. It is not
our intention to describe in detail the wide range of environmental processes that result in exposure of
humans and the environment to persistent organic pollutants. The number of substances and processes
is large, and, even for well-known substances, the information available is often incomplete. This
chapter gives an overview of the most important processes that determine transport and fate of
persistent organic pollutants.
The past decades have brought substantial new knowledge about the environmental fate of different
types of substances (SETAC, 1996). This has shown that simple physical and chemical characteristics
of the substances can be useful to predict its distribution among environmental compartments and
between water, soil, sediments, air, and organisms (Mackay et al., 1992; Meylan et al., 1993). Even
for those substances where physical and chemical data are not yet available, models have been
developed and used to predict these characteristics (Meylan and Howard, 1991; 1993, Meylan et al.,
1992; Boethling et al., 1994). In addition, the availability of information on the sources and ambient
concentrations of persistent organic pollutants is rapidly increasing. Taken together, these data and
models have allowed an understanding of the environmental fate and transport of a large group of
persistent organic pollutants.
3.2 PHYSICAL AND CHEMICAL PROPERTIES THAT DETERMINE
ENVIRONMENTAL FATE
Substances possess physical and chemical properties which determine their transport pathways and
distribution in the environment. The physical properties of greatest importance are water solubility,
vapour pressure (P), Henry's law constant (H), octanol-water partition coefficient (K
ow
), and the
organic carbon-water partition coefficient (K
oc
). Some of these properties are interrelated. For
example, Henry's law constant can be calculated from [vapour pressure/water solubility] and K
oc
is
correlated to K
ow
.
Environmental distributions can be estimated. Using relatively simple models
such as those of Mackay et al., (1992; 1993), the environmental distribution of persistent organic
pollutants can be estimated from P, H, K
oc
and K
ow
,
which determine partitioning among air, water,
soil, sediment and biota. Biota include soil organic carbon, plant waxes, and lipids in organisms.
Persistence in the environment is the other important property of a substance since transport can
extend the range of exposure to such substances far beyond the immediate area of use and/or
release.
4 December 1995
3.2.1 Environmental influences on persistence and transport
Environmental transformations of persistent organic pollutants can be subdivided into three
processes: biotransformation; abiotic oxidation and hydrolysis; and photolysis. The relative
importance of these processes depends on the rates at which they occur under natural environmental
conditions. These rates are, in turn, depend on the chemical structure and properties of the substance
and its distribution in the various compartments of the environment. Factors that affect these rates
have been extensively reviewed (SETAC, 1996).
Factors controlling rates of biodegradation have been reviewed by Battersby (1990) and Banerjee et
al. (1984). In the environment, where growth of microorganisms is dependent on the availability of
substrates and concentrations of persistent organic pollutants are low compared to other potential
growth substrates, the biodegradation rate is dependent on both substrate concentration and biomass
of microorganisms (Baughman et al., 1980; Paris et al., 1981). Factors influencing microbiological
biomass are correlated with effects on biodegradation rates.
A number of environmental factors can alter hydrolysis rates. These include; temperature, pH, ionic
strength, the presence of metal ion catalyses and, the presence of sediments. If the processes that
control rate are catalysed by acid or base, pH will have a strong effect on halflife. Many persistent
organic pollutants are halogenated (mainly chlorinated) and the C-Cl bond in chlorinated aromatics
is not readily hydrolysed. As a result, hydrolysis is a relatively unimportant process for these
substances.
Photodegradation of persistent organic pollutants is a potentially important pathway for
degradation. Photodegradation in the atmosphere is relatively unimportant process because of the
nature of the persistent organic pollutants. Photodegradation on particulate surfaces is highly
variable and is dependent on the surface type and the wavelength and intensity of light (SETAC,
1996). For example, Koester and Hites (1992b) found large differences between the rates of
photolysis of PCDDs and PCDFs adsorbed on silica gel and fly ash. Half-lives of these substances
adsorbed on silica gel and irradiated under laboratory conditions ranged from 3-14 h for PCDFs to
88000 h for PCDDs. Loss of PCDDs and PCDFs was found to be negligible on fly ash after 200 h.
By comparison, the half-life of 2,3,7,8-TCDD adsorbed to the surface of vegetation was 44 h in
natural sunlight (McCrady and Maggard, 1993).
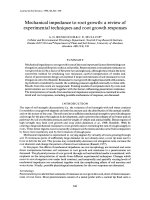
As would be expected, environmental factors have little effect on the breakdown and transformation
of persistent organic pollutants. In addition, those that might have some effect are less effective in
polar regions. Given the continued use and release of persistent organic pollutants in other parts of
the globe, the result of this is a net accumulation of persistent organic pollutants in the polar regions
(Figure 2).
3.2.2 Influence of environment on movement
Some of the above properties of persistent organic pollutants are strongly dependent on
environmental conditions (SETAC, 1996). For example, temperature strongly affects vapour
pressure, water solubility, and, therefore, Henrys law constant. The effect of temperature on the
partitioning of substances is well known. For example, the direction and magnitude of air-water gas
exchange for polychlorinated biphenyls (PCBs) and hexachlorobenzene (HCB) in the Great Lakes
changes seasonally with temperature (Hornbuckle et al., 1994; McConnell et al., 1993). Greater
volatilization occurs in summer as a result of warming of the surface water. The net exchange
direction for substances in the open ocean also reflects differences in surface water temperature and
atmospheric concentration. For example, net movement of persistent organic pollutants in the warm
waters Bay of Bengal in the Indian Ocean is from the ocean to the atmosphere (Iwata et al., 1993;
December 1995 5
Jantunen and Bidleman, 1995) while that in cooler polar regions is the reverse (Bidleman et al.,
1995).
3.2.3 Environmental effects on deposition
Temperature may also affect deposition in locations away from the source. The distribution of
PCBs, organochlorine pesticides, PCDDs and PCDFs is inversely related to vapour pressure, and
thus to temperature. Lower temperatures favour greater partitioning of these compounds from the
vapour phase to particles suspended in the atmosphere. This increases the likelihood of their
removal and transport to the surface of the earth by rain and snow (Falconer and Bidleman, 1994;
Koester and Hites, 1992a).
6 December 1995
3.3 TRANSPORT
Countries in the tropics experience higher year-round temperatures than countries in the temperate
and polar regions of the globe. Use of some pesticides in tropical agricultural production during the
warmer, welter growing season
may facilitate the rapid dissipation
of persistent organic pollutants
through air and water. For
example, in the Vellar River and
its watershed in South India, the
flux of hexachloro-cyclohexane
(HCH or BHC) residues into the
atmosphere was estimated at about
99.6% of the applied HCH in the
rite-growing paddy areas of this
watershed. Only about 0.4% was
transported by welter to the estuary
over the year and about 75 % of
the water-borne flux to the estuary
was estimated to be lost by
volatilization to the air. Thus only
about 0.1 % of the applied HCH
was estimated to ultimately be
drained to the sea via the water in
the Vellar river (Takeoka et al.,
1991). Similar observations have been made by other workers (Tanabe et al., 1991).
These and other observations suggest that inputs of persistent organic pollutants to tropical oceans
through discharge of river water are less significant than in temperate zones. In addition, the
residence time in the tropical aquatic environment is quite short and transfer to the atmosphere is
greater in these areas. The relatively short residence time of persistent organic pollutants in the
tropical water bodies might be viewed as favourable for local organisms and environments,
however, it does have more far-reaching implications for the global environment because these
volatilized residues then disperse through the global atmosphere to deposit elsewhere.
Several monitoring studies have confirmed this. In a global monitoring survey of air and surface
seawater from 1989-1990, Iwata et al. (1993) found HCH to be in the greatest concentration among
the persistent organic pollutants. Concentrations were greatest in the Northern hemisphere.
Concentrations were greater in the tropical source regions and in the cold welter deposition areas
near the Arctic. On the other hand, DDT concentrations were higher only in the seas around tropical
Asia. Other persistent organic pollutants such as PCBs and chlordanes showed a more uniform
global distribution.
The present-day distribution of persistent organic pollutants in the oceans is indicative of a major
change in distribution pattern during the last decades (SETAC, 1996). Until the early 1980s, there
were higher concentrations of persistent organic pollutants (HCHs, DDT, and PCBs) in the mid-
latitude oceans of the northern hemisphere, probably reflecting the large usage in developed
countries such as Japan, Europe, and North America (Tanabe et al., 1982, 1983; Tatsukawa and
Tanabe, 1990). This distribution has not been seen in die most recent samples, an observation that is
consistent with the changing use patterns of these substances (Goldberg, 1975). Other persistent
organic pollutants have also been observed in higher concentrations in polar environments. PCBs
Figure 2 Net global deposition of persistent organic
pollutants. It is recognized that POPs may originate
throughout the latitudes where they are used.
December 1995 7
and chlordanes have also been detected in samples from the arctic (Kawano et al., 1988; Muir et
al., 1992; Thomas et al., 1992). The smaller geographical variations of PCB and chlordane
concentrations in open ocean samples may be the result of their global distribution and use
(SETAC, 1996). These findings support the assumption that a large proportion of persistent organic
pollutants used in the tropics are released into the atmosphere and disperse through long-range
global transport, most often to the polar regions.
3.4 DEPOSITION
Atmospheric transport and accumulation of persistent organic pollutants (PCBs, DDT, HCHs, and
chlordanes) in the Arctic has been extensively documented (Cotham and Bidleman, 1991; Barrie et
al., 1992; Muir et al., 1992; Lockhart et al., 1992; Thomas et al., 1992; Iwata et al., 1993).
Analyses of recent air samples from Antarctica also show continued transport of DDT, chlordanes,
and HCHs to the southern polar regions (Larsson et al., 1993; Bidleman, 1992). Accumulation in
polar regions is partly the result of global distillation followed by cold condensation of compounds
within the volatility range of PCBs and pesticides (Wania and Mackay, 1993; Mackay and Wania,
1995). It appears that, as these contaminants travel from tropical regions to the poles, they are
continually deposited and re-evaporated and fractionate according to their volatilities (Figure 3).
The final result is relatively rapid transport and deposition of persistent organic pollutants having
intermediate volatility, such as HCB, and slower migration of less volatile substances such as DDT.
The characteristics of polar ecosystems intensify the problems of contamination with persistent
organic pollutants. The colder climate, reduced biological activity, and relatively small incidence of
sunlight would be expected to increase the persistence of these substances. Poor vertical mixing of
the surface layer of the Arctic Ocean may increase the availability of
8 December 1995
organochlorines to the food chain
and, during snowmelt, the sudden
release of trapped persistent
organic pollutants may occur,
coinciding with the more active
summer phase of the life cycle of
polar organisms. The significant
concentrations of persistent
organic pollutants in arctic fish
(Lockhart et al., 1992),
terrestrial (Thomas et al., 1988)
and aquatic mammals (Muir et
al., 1992) underlines the
significance of long-range
atmospheric transport from
equatorial regions in the exposure
of organisms from polar regions
to persistent organic pollutants.
3.5 CONCENTRATIONS
IN RELATION TO
DEPOSITION
Considerable data on concentrations of persistent organic pollutants in samples from the Arctic are
available and are summarized below. Most of these data are published in summary form as means
or means with ranges. It was not possible to access the raw data from which these means were
calculated, however, typical mean concentrations are presented in Tables 3.5-1 to 3.5-8 for
information. Noteworthy is that inspection of this data showed indications of declines in
concentrations since some of these persistent organic pollutants were banned or restricted.
The data in the literature are presented in several ways without standardization. The maintenance of
a central database of all analytical data on the persistent organic pollutants would greatly aid in
determining spatial and temporal trends in the data and linking these to changes in use pattern of
these substances.
Figure 3 The effect of volatility on transportation distance
of POPs. It is recognized that POPs may originate
throughout the latitudes where they are used.
December 1995 9
Table 3.5-1 Organochlorines in turbot liver from remote lakes and rivers in Canada. Concentrations are expressed as
geometric means (ng/g of lipid) ± 95% confidence intervals, from Muir et al. (1990).*
Locations HCB ΣChlordane ΣDDT Mirex Toxaphene Dieldrin ΣPCB
Lake Winnepeg
Man.
29 ± 4.5 142 ± 51 621 ± 218 10 ± 3 807 ± 285 41 ± 13 1941 ± 682
ELA Lake 625 Ont 22 ± 5 372 ± 125 1490 ± 601 14 ± 4 1723 ± 541 60 ± 9 1290 ± 386
Trout Lake Ont. 34 ± 8 377 ± 101 1029 ± 523 16 ± 7 2338 ± 769 70 ± 21 873 ± 467
S. Indian Lake Man.
66 ± 12 284 ± 67 461 ± 131 17 ± 4 1467 ± 323 34 ± 8 944 ± 281
Mackenzie R., Fort
Simpson N.W.T.
34 ± 18 207 ± 105 162 ± 117 8 ± 2 1132 ± 683 14 ± 11 556 ± 389
Mackenzie R., Fort
Good Hope N.W.T.
43 ± 22 172 ± 88 95 ± 57 7 ± 3 1570 ± 999 13 ± 6 343 ± 172
Mackenzie R., Arctic
Red River N.W.T.
42 ± 37 229 ± 160 100 ± 67 5 ± 4 1700 ±1346 16 ± 11 301 ± 220
Peel River, Fort
McPherson N.W.T.
23 ± 22 86 ± 79 50 ± 46 3 ± 3 930 ± 904 7 ± 6 344 ± 284
*Adapted from Lockhart et al., (1992).
10 December 1995
Table 3.5-2 Organochlorine compounds detected in extracts of 200-litre samples of filtered river water (ng/L)
and extracts of ground whole fish (µg/g wet weight) from five rivers in northern Ontario, June,
1981, from McCrea et al. (1984).*
Location Species HCB Heptachlor Heptachlor
epoxide
α-Chlordane p,p'-DDE-
0.005
Dieldrin ΣPCBs
Pike ND-0.001 ND ND ND ND-0.005 ND 0.02-0.05
Sucker ND ND ND-0.001 ND ND-0.004 ND-0.002 0.02-0.21
Moose
Water 0.0072 ND ND ND ND 0.025 0.25
Pike ND-0.002 ND ND-0.001 ND ND ND 0.02-0.09
Sucker ND-0.002 ND ND-0.001 ND ND ND 0.02-0.09
Albany
Water 0.014 ND ND ND ND 0.029 0.21
Pike ND ND ND ND ND ND ND-0.02
Sucker ND-0.001 ND ND-0.001 ND ND-0.002 ND ND-0.03
Attawapiskat
Water 0.0037 ND ND ND ND ND 0.24
Pike ND-0.001 ND ND ND 0.003-0.007 ND ND-0.03
Sucker ND-0.001 ND-0.001 ND ND ND-0.001 ND ND-0.01
Winisk
Water 0.0088 ND 0.0012 ND 0.0050 ND 0.43
Pike ND-0.002 ND ND ND-0.002 0.001-0.010 ND ND-0.02
Sucker ND-0.001 ND ND ND ND-0.001 ND ND
Severn
Water 0.003 ND ND 0.0059 ND ND 0.24
* Adapted from Lockhart et al., (1992).
December 1995 11
Table 3.5-3 Organochlorine compounds (ng/g, wet weight) identified in muscle of lake whitefish from several
communities in the Northwest Territories, 1986, from Lockhart et al. (1988, 1989).*
Location ΣChlorobenzenes ΣChlordanes ΣDDT Toxaphenes Dieldrin
Arctic Red River (N=4) 0.1-0.3 0.2-2.1 0.2-1.7 1.9-26.6 0.1-0.3
Fort Franklin (N=2) 0.8-1.8 5.7-9.8 2.8-3.5 50.5-59.9 0.5-13.3
Fort Good Hope (N=6
a
) 0.1-1.4 0.2-4.8 0.2-3.6 6.7-85.8 0.1-0.6
Fort Simpson (N=2) ND-0.9 1.0 0.4-0.8 3.0-10.0 0.2
Fisherman Lake (N=4) 0.1-0.4 0.4-2.7 0.4-1.3 6.9-11.6 0.1-0.3
*Adapted from Lockhart et al., (1992).
a
Four lake whitefish, two broad whitefish
12 December 1995
Table 3.5-4 Summary of DDT, PCBs and Dieldrin reported in freshwater fish from northern North America (ng/g, wet weight)*
Source of fish Date Species No. Tissue ΣDDT ΣPCB Dieldrin Reference
Hjalmar L., N.W.T 1970 Lake trout >3 HD
a
3 - Trace 1
Rutledge L., N.W.T. 1970 Lake trout >3 HD 20 - Trace 1
Gordon L., N.W.T. 1970 Trout >3 HD 110 - 10 1
Kaminak L., N.W.T. 1970 Lake trout >3 HD ND - ND 1
Kenai R., Alaska 1969 Lake trout 5 Whole 90 2640 - 2
Minto L., Que. 1970 Lake trout 4 Whole 45-150 41-91 - 3
Minto L., Que. 1970 Lake trout 1 H&F 597 640 - 3
Churchill Falls, Labrador 1977 Lake trout Fat - 370-690 - 4
Kenai R., Alaska 1969 Rainbow trout 5 Whole 140 5480 - 2
Chena R., Alaska 1970 Artic grayling 5 Whole 620 1420 10 2
Kenai R., Alaska 1969 Longnose sucker 5 Whole 30 1530 - 2
Chena R., Alaska 1969 Longnose sucker 5 Whole 1160 3870 10 2
Chena R., Alaska 1969 Roune whitefish 5 Whole 920 2620 10 2
Great Slave L., N.W.T. 1970 Lake whitefish >3 HD 10 - 10 1
Hjalmar L., N.W.T. 1970 Lake whitefish >3 HD 30 - 10 1
Nonacho L., N.W.T. 1970 Lake whitefish >3 HD Trace - Trace 1
Rutledge L., N.W.T. 1970 Lake whitefish >3 HD 20 - 10 1
Merkley L., N.W.T. 1970 Lake whitefish >3 HD Trace - 10 1
Gymer L., N.W.T. 1970 Lake whitefish >3 HD 20 - 10 1
Gordon L., N.W.T. 1970 Lake whitefish >3 HD 190 - 30 1
Mackay L., N.W.T. 1970 Lake whitefish >3 HD 160 - 20 1
Baker L., N.W.T. 1970 Lake whitefish >3 HD ND - ND 1
Jackson L., N.W.T. 1970 Lake whitefish >3 HD 10 - Trace 1
Hay R., N.W.T. 1984 Lake whitefish 15 Muscle 3-30 1-3 1 5
Tuktoyaktuk, N.W.T. 1984 Broad whitefish 2 Muscle 0.4 1.9 - 6
Tuktoyaktuk, N.W.T. 1984 Unidentified 1 Muscle 2.5 3.5 - 6
Minto L., Que. 1970 Arctic char
b
1 Gonads 108 130 - 3
Minto L., Que. 1970 Arctic char 1 Liver 47 31 - 3
S. Baffin Island 1986 Arctic char Pooled Liver 14 205 8 7
S. Baffin Island 1986 Arctic char Pooled Muscle 2 55 1 7
* Adapted from Lockhart et al., (1992)
a
HD, headless dressed; H & F, head and foreparts.
b
Landlocked.
References: 1 Reinke et al. (1972); 2, Henderson et al. (1971); 3, Risebrough and Berger (1971); 4, Musial et al. (1979); 5, Wong (1985); Muir et al. (1986b);
7, Thomas and Hamilton, unpublished.
December 1995 13
Table 3.5-5 Concentrations of selected organochlorine residues in terrestrial animals of the Canadian North.*
Species Sex Capture
Location
Tissue ΣDDT
a
ΣChlordane
b
ΣPCB
c
Toxaphene Mirex Dieldrin HCB
Data from Thomas and Hamilton (1988) (ng/g wet tissue)
F Pond Inlet Fat 2 5 11 NM 0.2 0.8 30
M Lake Harbour Fat 3 5 25 NM 0.1 1.5 47
M Iqualit Fat 2 2 52 NM 0.3 0.9 84
M Iqualit Liver 1 8 8 NM 0.7 2.0 1
M Iqualit Muscle 2 0.2 2 NM 0.1 0.05 2
F Arctic Bay Fat 2 5 12 NM 0.08 0.8 57
Caribou
(Rangifer
tarandus)
F Clyde River Fat 1 3 23 NM 0.4 0.7 57
F Arctic Bay Fat 0.9 2 3 NM 0.1 0.9 11
F Arctic Bay Liver <0.4 0.6 1 NM 0.03 0.4 0.4
Arctic Hare
(Lepus arcticus)
F Arctic Bay Muscle <0.2 4 0.4 NM 0.01 0.003 0.2
M Broughton Island Muscle 0.3 0.8 4 NM <0.02 0.13 0.3
F Arctic Bay Liver 1.6 0.4 0.2 NM 0.7 0.15 0.4
F Arctic Bay Muscle 0.3 0.2 0.6 NM 0.01 0.07 0.3
Ptarmigan
(Lagopus
mutus)
F Lake Harbour Fat 11 7.4 12 NM 0.02 2.2 5.8
Data from Muir et al. (1988) (ng/g wet tissue)
- Broughton Island Fat 4 5 33 13 <0.1 1.7 25 Caribou
(Rangifer
tarandus)
- Broughton Island Muscle 1 2 10 3 0.1 0.4 1.2
Ptarmigan
(Lagopus nutus)
- Broughton Island Muscle 0.5 1.0 18 3 NM 0.1 0.3
Data adapted from Peakall et al. (1990) ng/g wet weight)
d
- NWT & Yukon
1966-72
Eggs 12600 160
e
NM NM NM 690 16
- 1973-79 11900 230
e
8800
f
NM 320 670 48
Peregrine falcon
(Falco
peregrinus
[anatum])
- 1980-87 12500 500
e
5600
f
NM 280 340 47
- NWT & Ungava
1966-72
Eggs 6400 120
e
NM NM NM 40 120
- 1973-79 12400 350
e
12800
f
NM 40 690 330
Peregrine falcon
(Falco
peregrinus
[tundrius]
- 1980-87 7000 560
e
9800
f
NM 200 570 390
14 December 1995
Table 3.5-5 Concentrations of selected organochlorine residues in terrestrial animals of the Canadian North.*
Species Sex Capture
Location
Tissue ΣDDT
a
ΣChlordane
b
ΣPCB
c
Toxaphene Mirex Dieldrin HCB
Data adapted from Noble and Elliot (1990) (ng/g wet tissue)
d
- NWT & Yukon
1965-72
Eggs 9100 60
g
NM NM NM 170 20
- 1973-79 330 20
g
600
f
NM ND 16 14
Gyrfalcon
(Falco
rusticolus)
- 1980-87 120 30
g
470
f
NM ND 20 70
Data from the National Registry of Toxic Chemical Residue Database, Canadian Wildlife Service, Hull, Quebec (ng/g wet weight)
Caribou
(Rangifer
tarandas)
M Prince of Wales
Island 1978
Liver <0.05 1.6 <0.15
j
NM <0.05 <0.05 0.93
M Sachs Harbour
1985
Liver <0.05 2.5 0 26
j
NM <0.05 <0.05 3.88 Musk-ox
(Ovibos
moschatus)
F Sachs Harbour
1985
Liver <0.05 2.15 0.21
j
NM <0.05 <0.05 1.83
*Adapted from Thomas et al., (1992)
NM, not measured.
a
ΣDDT= Sum of p,p'-DDT and p,p'-DDE and p,p'-DDD
b
ΣChlordane = Sum of cis, trans-chlordane, oxychlordane, heptachlor, heptachlor epoxide and cis, trans-nonachlor.
c
ΣPCB = Sum of individual congeners.
e
Concentrations shown are geometric means. Not detected was counted as part of the data set at half the detection limit and included in the mean.
e
Sum of heptachlor epoxide and oxychlordane.
f
As Aroclor 1254:1260 (1:1).
g
Heptachlor epoxide only.
h
Sum of congeners 138 and 180; other congeners not detected at <0.07 ng/g.
December 1995 15
Table 3.5-6 Organochlorine compounds (ng/g wet weight; mean ± SD) in Arctic vertebrates, fish, marine mammals and seabirds.*
Species Location Year Tissue N Sex
a
ΣDDT PCB
b
ΣChlor PCC
b
Reference
Invertebrates
Zooplankton Ice Island 1986 Lipid Pool - 6 13 10 24
81°97°W 1987 Lipid Pool - 620 110 51 160
Amphipods Ice Island 1986 Lipid Pool - 640 1600 900 1500
81°97°W 1987 Lipid Pool - 3460 14000 2520 8300
Bidelman et al.,
1989
Fish
Arctic Bay 1984 Muscle Pool - 2.6 1.9
c
2 23
Resolute Bay 1984 Muscle Pool - 4.7 2.4
c
3.1 14
Arctic cod
(Boreogadus saida)
Pnagnirtung 1984 Muscle Pool - 4.5 6.3
c
3.4 46
Frobisher Bay 1984 Whole 2 - 3.2 2.8
c
1.0 6
Muir et al., 1987
Victoria Is. 1984 Muscle Pool - 3.7 1.8c 1.1 <2
Greenland cod
(Gadus ogac)
Queen Maud Gulf 1984 Muscle 2 - - 3 - - EPS, 1985
Atlantic cod
(Gadus morhua)
N. Finland
Vester-Tana
1985-
89
Lipid ? - 147 570 128 540 Paasivirta &
Rantio, 1991
Pacific herring
(Clupea harengus P.)
Tuktoyaktuk harbor 1984 Muscle Pool - 4.1 5
c
5.6 74
Inconnu
(Stenodus leucichtys)
Tuktoyaktuk harbor 1984 Muscle 1 - 3.5 2.5
c
3.3 24
Muir et al., 1987
Baffin Is. 1972 Liver 3 - 15±16 10±10 - -
Liver 4 M&F 4.3±3 5±4 - - Prince Patric Is. 1972
Muscle 3 M&F 8±5 8±10 - -
Bowes & Jonkel,
1975
W. Davis strait 1985 Whole 6 - 9±3 45±14
c
26±7 157±67 Muir et al., 1986
Cumberland Sound 1986 Whole 10 - 4±1 10±1
c
15±3 95±18
West Hudson Bay 1985 Whole 10 - 9±3 14±3
c
19±6 79±23
Queen Maud Gulf 1985 Whole 10 - 21±6 16±4
c
44±9 153±44
S. Beaufort Sea 1985 Whole 9 - 4±1 4±1
c
12±4 44±14
Hendzel & Reiger
(unpublished)
1986 Fat 1 - 4.5 64
c
32 - N. Baffin Is.
Muscle 1 - 9 9
c8
-
1986 Fat 1 - 2.6 2
c
2 - W. Baffin Bay
Muscle 1 - 0.6 1
c
0.6 -
Thomas &
Hamilton, 1988
Arctic char
(Salvelinus alpinus)
Queen Maud Gulf 1984 Muscle 4 F - 35±24 - - EPS, 1985
W. Greenland 1979 Whole 2 - 36 75.3 15 300
Labrador Sea 1979 Whole 2 - 10 35
c
4 84
Anderson et al.,
1988
Atlantic salmon
(Salmo salar)
N Finland, Tana R. 1985-
89
Fish
Lipid
? - 516 572 139 2870 Paasivirta &
Rantinoe, 1991
16 December 1995
Table 3.5-6 Organochlorine compounds (ng/g wet weight; mean ± SD) in Arctic vertebrates, fish, marine mammals and seabirds.* (Continued)
Species Location Year Tissue N Sex
a
ΣDDT PCB
b
ΣChlor PCC
b
Reference
Cetaceans
1972 Liver 7 Adult 780±230 <500 - - S Beaufort Sea
(MacKenzie delta)
Blubber 7 Adult 3900±890 <500 - -
S. Beaufort Sea 1972 Blubber 7 Adult 2560±1460 <500 - -
Addison & Brodie,
1973
Blubber 10 M 2200±830 3330±850
c
1750±410 3830±1160 S. Beaufort Sea 1983-
87
Blubber 2 F 670 1230
c
670 1380
Blubber 8 M 1960±320 2530±570
c
1870±440 4250±1020 Jones Sound 1984
Blubber 7 F 2190±1690 2460±1980
c
1840±1130 3740±2120
Blubber 4 M 3130±200 3120±340
c
2330±260 5100±420 W. Hudson Bay 1986
Blubber 4 F 850±960 960±1000
c
850±800 1770±1410
Blubber 8 M 2270±680 2770±510
c
1860±350 4130±820 E. Hudson Bay 1986
Blubber 8 F 980±730 1230±840
c
870±580 1990±1100
Blubber 6 M 6830±1890 4910±250
c
2380±400 5780±5390
Beluga
(Delphinapterus
leucas)
Cumberland Sound 1983
Blubber 6 F 930±550 1150±410
c
620±150 1770±1760
Muir et al., 1990a
Blubber 9 F 1980±2010 6730±2220
d-
- - W. Baffin Bay 1979
Blubber 11 M 4840±2130 12850±6880
d
- -
Wagemann &
Muir, 1984
Blubber 15 M 5920±1710 5180±1920
c
1920±410 9160±2350
Narwhal
(Monodon monoceros)
W. Baffin Bay 1982-
1983
Blubber 6 F 2540±2020 2700±1790
c
1400±1020 2440±2840
Muir et al., 1992a
Minke whale (Balaeno-
ptera acutorostrata)
W Greenland 1972 Blubber 6 - 1400±940 610±380 - - Johansen et al.,
1980
Fin whale (Balaeno-
ptera physalus)
S.E. Greenland 1975 Blubber 3 - 2830 3600 Holden, 1975
Porpoise
(Phocaena phocaena)
W: Greenland 1972 Blubber 2 - 320±390 6700±6700 30 Clausen et al.,
1974
Pinnipeds
Arctic Canada 1970 Blubber 3 Adult 2700±1500 3000±1200 - - Holden, 1975 Ringed seal
(Phoca hispida)
Blubber 15 M 1310±310 4100±1400 - -
Amundsen Gulf
(Holman Is.)
1972
Blubber 13 F 610±270 2000±900 - -
Addison & Smith,
1974
Blubber 12 M 1100±510 3690±1340 - -
1972
Blubber 9 F 550±210 1830±820 - -
Blubber 16 M 780±560 1280±750 - -
Amundsen Gulf
(Holman Is.)
1981
Blubber 15 F 330±140 580±250 - -
Addison et al.,
1986
W. Greenland 1972 Blubber 5 - 150±100 900±270 - - Clausen et al.,1974
Liver 3 - 22±13 40±60 - - E. Beaufort Sea (Sachs
Harbour)
1972
Blubber 5 - 1538±876 920±770 - -
Bowes &Jonkel,
1975
December 1995 17
Table 3.5-6 Organochlorine compounds (ng/g wet weight; mean ± SD) in Arctic vertebrates, fish, marine mammals and seabirds.* (Continued)
Species Location Year Tissue N Sex
a
ΣDDT PCB
b
ΣChlor PCC
b
Reference
Pinnipeds, continued
Liver 3 F 78±89 40±40 - - Jones Sound 1972
Blubber 2 - 367±266 500±490 - -
Spitzbergen 1980 Blubber 1 - 4500 9000 - 4000 Anderson et al,
1988
Blubber 19 M 710±400 570±290
c
460±210 -
Blubber 14 F 480±280 380±1700
c
350±180 -
Liver 19 M 9±7 6±4
x
6±5 -
Barrowstrait 1984
Liver 14 F 6±5 4±3
x
5±3 -
Blubber 10 M 1330±1500 790±880
c
460±310 -
Blubber 16 F 480±320 310±140
c
280±140 -
Liver 8 M 6±7 5±5
c
4±3 -
Admiralty Inlet 1983
Liver 7 F 2±3 1±2
c
2±3 -
Muir et al., 1988
Blubber 5 M 720±340 680±340
c
160±70 -
Blubber 5 F 370±320 490±170
c
130±100
Liver 2 M 9 23
c
7 -
Various Baffin Is.
Locations
1986
Liver 4 F 10±8 24±15
c
7±4
Thomas &
Hamilton, 1988
Spitzbergen 1986 Blubber 7 M&F 1620±1020 840±480
c
26±9 - Oehme et al., 1988
Blubber 11 M 380±160 580±230
c
420±150 190±80 E. Beaufort Sea 1988
Blubber 10 F 360±360 520±240
c
340±130 130±50
S. Beaufort Sea 1986 Blubber 7 M&F 290±140 630±300
c
410±260 340±480
Blubber 10 M 470±380 880±600
c
560±330 390±140 Queen Maude Gulf 1986
Blubber 6 F 300±230 670±550
c
490±410 310±210
Blubber 9 M 240±230 560±500
c
670±1220 290±170 Spence Bay 1986
Blubber 5 F 230±140 510±390
c
400±310 310±240
Blubber 10 M 690±530 880±650
c
520±270 470±350 W. Hudson Bay
(Rankin Inlet)
1986
Blubber 10 F 450±290 570±310
c
390±200 290±140
Blubber 10 M 86±76 1160±800
c
710±490 480±270 N. Hudson Bay (Coral
Harbour)
1987
Blubber 6 F 31±8 530±220
c
320±60 310±200
Blubber 8 M 410±190 540±210
c
330±90 250±160 W. Davis Straight
(Broughton Is.)
1985
Blubber 9 F 410±200 510±200
c
290±140 440±330
Blubber 10 M 330±190 510±230
c
300±110 380±160 Cumberland Sound 1986
Blubber 8 F 240±70 350±70
c
250±100 180±100
Muir et al., 1992b
Ringed seal
(Phoca hispida),
continued
Chukchi Sea 1988 Blubber 2 M 210 720
c
70
f
- Becker et al., 1989
18 December 1995
Table 3.5-6 Organochlorine compounds (ng/g wet weight; mean ± SD) in Arctic vertebrates, fish, marine mammals and seabirds.* (Continued)
Species Location Year Tissue N Sex
a
ΣDDT PCB
b
ΣChlor PCC
b
Reference
Pinnipeds, continued
W. Greenland 1972 Blubber 5 - 470±260 1800±1000 48
g
- Clausen et al., 1974
Blubber 2 F 980 630
c
150 -
Bearded seal
(Erignathus barbatus)
Baffin Is. 1986
Muscle 1 F 20 10
c
5 -
Thomas &
Hamilton, 1988
Hooded Seal
(Cystophora cristata)
W. Greenland 1974 Blubber 4 - 3500±1500 3900±2000 - - Johansen et al.,
1980
W. Greenland 1972 Blubber 5 - 290±100 2740±1830 - - Clausen et al.,1974
1972 Blubber 8 - 4900±5600 1900±1100 - -
1974 Blubber 3 - 1500±600 1700±500 - -
W. Greenland
1976 Blubber 3 - 2800±1400 1600±700 - -
Johansen et al.,
1980
Blubber 4 F/pups 810±1030 1090±830 70±30 -
Blubber 10 F/juv. 980±480 1440±780 270±70 -
Blubber 6 F/adult 1120±990 1360±790 170±120
Blubber 2 M/pup 1270±700 1160±490 210±30 -
Blubber 11 M/juv. 1640±960 1700±1290 320±130 -
N. Baffin Bay &
Cumberland Sound
1976-
78
Blubber 9 M/adult 090±2130 3760±3650 230±100
Liver 1 M&F 30 - - -
Harp seal
(Phoca groenlandica)
N.W. Greenland 1976-
78
Muscle 2 M&F 130 - - -
Ronald et al., 1984
Liver 5 -/pups 2210 - - - Bering Sea (Pribilof Is.) 1969
Blubber 5 -/pups 15910 - - -
Anas & Wilson,
1970a
Liver 13 M 800 - - - Bering Sea (Pribilof Is.) 1968
Liver 10 F 980 - - -
Anas & Wilson,
1970b
Blubber 5 -/pups 39900±
48200
12900±33500 - - Bering Sea (St. Paul Is.) 1972
Blubber 2 F/adult 5200±2600 5800±1500 - -
Kurtz & Kim 1976
1975 Blubber 6 M 5210±1260 3680±1090 - -
1978 Blubber 6 M 5470±2210 3190±1250 - -
Bering Sea (St. Paul Is.)
1981 Blubber 6 M 4640±1880 3210±1260 - -
Kurtz 1984
Blubber 29 M 2780±830 1780±630 - - Bering Sea (St. Paul Is.) 1984
Liver 29 M 120±50 100±40 - -
Kurtz , 1987
Bering Sea (St. Paul Is.) 1978-
80
Blubber 2 M 7520
h
2490 - - Calambokidis &
Peard, 1985
Fur seal
(Callorhinus ursinus)
Bering Sea (St. Paul Is.) 1987 Blubber 2 M 1290 440 210
f
- Becker et al., 1989
Blubber 8 M 90±130 360±310 - - Walrus (Odobenus
rosmarus rosmarus)
N.W. Greenland
(Thule)
1975-
76
Blubber 20 F 50±50 180±120 - -
Born et al., 1981
December 1995 19
Table 3.5-6 Organochlorine compounds (ng/g wet weight; mean ± SD) in Arctic vertebrates, fish, marine mammals and seabirds.* (Continued)
Species Location Year Tissue N Sex
a
ΣDDT PCB
b
ΣChlor PCC
b
Reference
Walrus (Odobenus
rosmarus rosmarus)
N. Baffin Is. 1986 Blubber 1 M 36 131 64 - Thomas &
Hamilton, 1988
N. Bering Sea 1972 Blubber 4 - 80 1800 - - Galster & Burns,
1972
Walrus (Odobenus
rosmarus divergens)
N. Bering Sea 1981-
84
Blubber 53 M&F <100 <100 40±80
i
<100 Taylor et al.,, 1989
Polar Bears
Beaufort Sea 1982 Fat 6 Pool 140 4250
c
2310 -
Amundsen Gulf 1982 Fat 8 Pool 180 3950 1810 -
Melville Is. 1982 Fat 8 Pool 280 8250 3420 -
Hadley Bay 1982 Fat 6 Pool 120 6630 3810 -
M'Clintock Chan'l 1982 Fat 16 Pool 220 4430 3680 -
Cornwallis Is. 1982 Fat 18 Pool 300 5940 3720 -
N. Baffin Is. 1984 Fat 10 Pool 210 4220 2860 -
W. Davis Strait 1984 Fat 10 Pool 390 3240 2750 -
St. Baffin Is. 1984 Fat 20 Pool 410 4250 2730 -
Southampton Is. 1983 Fat 10 Pool 940 8110 6890 -
Norstrom et al.,
1988
W.Hudson Bay 1983 Fat 9 Pool 1190 8020 7090 -
Fat 2 M&F 580 5750 - - S. Hudson Bay
Muscle 7 M&F 10±10 190±230 - -
Southampton Is. Muscle 7 M&F 10±10 80±70 - -
Baffin Bay
1968-
71
Muscle 5 M&F 10±10 250±500 - -
Cornwallis Is. 1972 Fat 3 F 150±40 2940±140 - -
Polar bear (Ursus
maritimus)
S. Beaufort Sea 1971 Muscle 4 M&F 5±4 230±120 - -
Bowes & Jonkel,
1975
Sea birds
Northern fulmar
(Fulmarus glacialis)
1975 Liver 10 Pool 250 980 150 -
1976 Liver 10 Pool 500 1790 200 -
Prince Leopold Is.
1975 Egg 10 Pool 760 1930 130 -
Nettleship &
Peakall, 1987
Liver 8 Pool 140 560 230 -
Prince Leopold Is. 1987
Egg 6 Pool 230 800 260 -
Peakall,
unpublished, 1989
Davis Strait 1972 Liver 1 - 2100 4200 - -
Bjornoya 1972 Liver 1 - 300 1600 - -
Bourne & Bogan,
1976
Liver 10 - 630 1600 - -
Spitzbergen 1980
Fat 10 - 220 59000 - -
Norhelm & Kjos-
Hansen, 1984
20 December 1995
Table 3.5-6 Organochlorine compounds (ng/g wet weight; mean ± SD) in Arctic vertebrates, fish, marine mammals and seabirds.* (Continued)
Species Location Year Tissue N Sex
a
ΣDDT PCB
b
ΣChlor PCC
b
Reference
Fat 1 - 2010 2110 250 - Northern fulmar,
cont’d
N. Baffin Is. 1986
Muscle 1 - 53 325 51 -
Thomas &
Hamilton, 1988
Ivory gull
(Phagophilia eburnea)
Seymour Is. 1976 Egg 10 Pool 500 1630 84 - Noble & Elliott,
1986
1975 Liver 10 Pool 50 1190 <100 -
1976 Liver 5 80 2420 <100
1976 Egg 10 Pool 380 5210 <100
Nettleship &
Peakall, 1987
Prince Leopole Is.
1987 Egg 3 Pool 130 1610 110 - Peakall, 1989
unpublished
Davis Strait 1972 Liver 1 130 3200 - -
Bjornoya 1972 Liver 1 80 1600 - -
Bourne & Bogan,
1976
Black legged kittiwake
(Rissa tridactyla)
N. Bering Sea 1973-
76
Egg 9 33 365 - - Ohlendorf et al.,
1982
Davis Strait 1972 Liver 2 130 80 - -
Bjornoya 1972 Liver 2 100 200 - -
Bourne & Rogan,
1976
Spitzbergen 1980 Liver 9 160 400 - - Norrheim & Kjos-
Hanssen, 1984
W. Greenland 1972 Fat 5 3500 12900 - - Braestrup et al.,
1974
N. Bering Sea 1973-
76
Egg 10 166 307 - - Ohlendorf et al.,
1982
1975 Liver 10 60 220 <100
1976 Liver 12 190 530 <100
1977 Liver 11 120 360 <100
1975 Egg 12 310 720 <100 _
1976 Egg 10 Pool 440 1010 <100
Prince Leopold Is.
1977 Egg 10 390 910 <100 -
Nettleship &
Peakall, 1987
1976 Fat 8 adult 10480±7540 1250±1340 - - Wong, 1985
1987 Egg 10 180 540 190 -
Thick-billed murre
(Uria lomvia)
Lancaster Sound
1987 Liver 10 Pool 210 680 40 -
Peakall,
unpublished, 1989
Fat 5 adult 13150±7950 900±280 - - Lancaster Sound 1976
Fat 5 juv. 400±160 <10 - -
Wong, 1985 Black guillemot
(Cephyus grylle)
Spitzbergen 1980 Muscle 4 Pool 120 260 - 90 Andersson et
al.,1988
December 1995 21
Table 3.5-6 Organochlorine compounds (ng/g wet weight; mean ± SD) in Arctic vertebrates, fish, marine mammals and seabirds.* (Continued)
Species Location Year Tissue N Sex
a
ΣDDT PCB
b
ΣChlor PCC
b
Reference
Carcass 10 M 6400±6900 25000±25000 - -
Carcass 10 F 6500±6200 18000±13000 - -
Oldsquaw
(Clangula hyemalis)
W. Hudson Bay 1971
Egg 11 - 7600±6100 48000±31000
Wong, 1985
Broughton Is. 1985 Liver 6 - 3±2 24±14 7±2 10±14 Muir et al., 1986a Eider duck
(Somaeria molissima)
Spitzbergen 1980 Muscle 5 Pool 27 72 - 18 Andersson et al.,
1988
*Adapted from Muir et al., (1992)
a
Dash indicates results not available or not determined
b
Concentrations on a wet weight basis. ΣDDT = sum of 4,4'-DDE, -DDD and -DDT; ΣPCB = aroclor equivalent unless otherwise indicated; ΣChlor = sum of chlordane related
isomers (nonachlors, chlordanes, oxychlordanes, etc.): PCC (Polychlorinated camphenes) = toxaphene
c
PCBs as sum of individual congeners
d
High PCBs (as Aroclor 1254 equivalents) probably due to interference from PCC peaks
e
Only oxychlordane reported
f
Sum of trans-nonachlor and heptachlor epoxide
g
Only heptachlor epoxide reported
h
Reported as 4,4'-DDE only
i
Only oxychlordane detected.