Assessment of land cover changes on Subi reef in Truong Sa Islands, Vietnam using multi-temporal Landsat images
Bạn đang xem bản rút gọn của tài liệu. Xem và tải ngay bản đầy đủ của tài liệu tại đây (919.98 KB, 10 trang )
Edited with the trial version of
Foxit Advanced PDF Editor
To remove this notice, visit:
www.foxitsoftware.com/shopping
Section on Special Construction Engineering
ASSESSMENT OF LAND COVER CHANGES
ON SUBI REEF IN TRUONG SA ISLANDS, VIETNAM
USING MULTI-TEMPORAL LANDSAT IMAGES
Minh Hang Le1,*
1Le
Quy Don Technical University
Abstract
In this article, the author proposes that Landsat images should be pre-processed using the
DOS method for atmospheric correction and the Gram-Schmidt method for image
enhancement. According to the results, the overall classification accuracy of multi-temporal
images achieved over 85%, and Landsat images are suitable for classifying land cover on
small islands in Truong Sa Islands, such as Subi Reef.
Keywords: Land cover changes; Subi Reef; Truong Sa Islands; multi-temporal images; Landsat images.
1. Introduction
Many atolls and islands constitute the Truong Sa Islands (Spratly Islands).
Reconstruction work has been completed on the atolls such as Chau Vien (Cuarteron
Reef), Chu Thap (Fiery Cross Reef), Gaven Reef, Tu Nghia (Hugh Reef), Gac Ma
(Johnson Reef), Xubi (Subi Reef), and Vanh Khan (Mischief Reef), which are illegal
occupation by China [1]. The land cover features in these atolls have been changed
drastically over the years.
Currently, the satellite images are the primary data of monitoring the changes of the
Earth’s surface. Over the last half-century, optical satellites have revolutionized the way
scientists monitor the atmosphere, oceans, lands, plants, and other environmental features
of the Earth's surface. The authors use Landsat images which are optical images with the
spatial resolution 15 m (pan) and 30 m (multispectral), a 16-day collection period, and 11
spectral bands. The process of detecting changes in the condition of an object or
phenomena by monitoring it at different times is known as change detection [2]. In order
to encourage effective decision making, it is critical to comprehend relationships and
interactions between human and natural phenomena on the surface of the Earth [3]. With
the growing availability of historical remote sensing (RS) data, lower data costs, and
higher resolution from satellite platforms, RS technology is prepared to get an even
greater impact on monitoring land-cover and land-use change at various geographical
scales [4]. In order to achieve the data analysis target of using RS for LULC change
detection, an appropriate understanding of the study region, the satellite imaging system,
*
Email:
74
/>
Journal of Science and Technique - ISSN 1859-0209
and the different methods for change detection is required [5]. Lu, et al. (2004) [3] and
Jwan, et al. (2013) [6] reviewed classified the change detection approaches into some
categories: Algebra (Image differencing, image rationing, Change vector analysis [7]);
Transformation (Principal component analysis-PCA, Tasseled cap-TC), Classification
(Post classification comparison [8, 9], spectral-temporal combined analysis,
unsupervised change detection [10]).
Many researches in Vietnam have proposed a variety of methods for detecting
land cover changes. Luong (2020) [11] suggested using GMO Maximum Entropy and
Classification and Regression Tree (CART) classification algorithms, as well as multitemporal Landsat image data on the GEE platform, to determine changes in land cover
in Vietnam's northwest mountainous regions. To assess the land use change in the
Mekong Delta, Nguyen (2011) [12] employed ISOdata, an unsupervised classification
method, and Landsat, SPOT image data. Thanh (2019) [13] assessed land cover changes
in the Hanoi city region from 1989 to 2019 using fractional vegetation cover (FVC) and
multi-temporal Landsat data. The effectiveness of Landsat images in monitoring land
cover changes has been demonstrated by these research findings.
Stephen, et al. (2020) [14] proved that remote sensing data is currently the most
important data in the study of land cover on islands. Landsat, SPOT, and highresolution images (such as GeoEye, Ikonos, QuickBird, WordView-2) are among the
remote sensing data used, in which Landsat images accounting for a higher percentage
of research publications than other types of material. Human activities, particularly
tourism development, infrastructure construction, and population increase, have resulted
in changes in the land cover of the islands, according to research findings. The research
focuses on Pacific and near-shore islands. There are still a few studies on landcover of
offshore islands, particularly in the Truong Sa Islands, that have not been published yet.
Atolls make up the majority of the islands in the Truong Sa Islands. However, during
2014 and now, these islands are being changed into such an artificial island with a
variety of features such as plants, barren land, built-up. Hence, in this article the author
proposes multi-temporal Landsat images which are used to estimate land cover changes
in Subi Reef.
2. Study area and materials
2.1. Study area
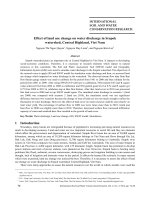
China is currently illegally exploiting the Subi Reef. Subi Reef is a part of the Thi
Tu group of atolls. Subi Reef may be located at latitudes of 10°54'47.88"N and
longitudes of 114°03'43.2"E. This is a small island approximately 26 kilometers
southwest of the Thi Tu Reef (Figure 1).
75
Section on Special Construction Engineering
Figure 1. The study area: (a) Location of the study area (a red rectange);
(b) Subi Reef in the natural colour image.
Between 2015 and July 2016, China increased its Subi Reef illegal reclamation
activities and completed a number of projects. The construction is built on the coral
reef. Subi Reef's land cover features have changed year to year. The land use and land
cover features of Subi Reef are runway, plants, built-up, barren land, and solar panels,
based on the interpretation of high-resolution satellite images and spectral
reflectance characteristics.
2.2. Material data and pre-processing
The author uses multi-temporal Landsat 8 OLI data from 2014 to 2020 to assess
land cover changes in Subi Reef. The characteristics of material data are shown in Table 1.
Using ENVI 5.3 software, multi-temporal Landsat images are pre-processed, including
atmospheric correction using the DOS method. The Landsat data are converted to
surface reflectance values after atmospheric corrections.
Table 1. The characteristic of material data
Parameters
Acquisition
Date
Path/Row
Cloud_cover
Bith depth
Projected
Level
76
Descriptions
Landsat 8 OLI
24/04/2014; 11/04/2015; 29/04/2016; 16/04/2017;
24/07/2018; 06/04/2019; 10/05/2020
120/52 and 120/53
<10%
16 bits
UTM/WGS 84
Level 1
Journal of Science and Technique - ISSN 1859-0209
3. Methodology
3.1. Image enhancement method of Landsat 8 imagery
A panchromatic band with a resolution of 15 meters and a multispectral band with a
spatial resolution of 30 meters are available on the Landsat 8 OLI satellite. Landsat
images must be enhanced in resolution by combining with the panchromatic band to
increase the spatial resolution of multi-spectral images by pan-sharpening method. The
author recommends that the Gram-Schmidt transformation should be used to improve
image quality (Figure 2). The essential steps in the Gram-Schmidt pan-sharpening method
[15] are as follows: (1) A low-resolution Panchromatic (Pan) band is calculated as a
linear combination of n multi-spectral (MS) bands; (2) The Gram-Schmidt transform is
applied to the simulated Pan image as the first band; (3) The high spatial resolution pan
image band is replaced with the first Gram-Schmidt band; (4) The inverse GramSchmidt transform is applied to form high-resolution multispectral bands.
Figure 2. Subi Reef 24/07/2018: (a) The original image;
(b) After image enhancement using Gram-Schmidt tranform.
The advantage of the Gram-Schmidt pan-sharpening method is that there is no
restriction on the number of multispectral bands in the image. The multispectral band's
processing and spectral reflectance properties are kept in the enhanced image.
The procedure reduces the correlation value (excess value) between the bands by
orthogonalizing matrix data or bands of a digital image. To prevent bands with
associated values, the revised technique subtracts the average value of each band from
each pixel.
3.2. Assessment the change of land cover by using multi-temporal Landsat images
Figure 3 shows the proposed method for classification land cover changes in Subi
Reef using multi-temporal Landsat images.
77
Section on Special Construction Engineering
Figure 3. The workflow of the proposed method.
The workflow of the proposed method consists of four steps:
- Step 1: Multi-temporal Landsat images are pre-processed using the DOS method
for atmospheric correction and the Gram-Schmidt transform algorithm for image
enhancement.
- Step 2: At the time of image acquisition, based on visual interpretation
information on high-resolution satellite images and multi-spectral characteristics to
choose ROI (Region of Interest) samples.
- Step 3: Using the SVM algorithm, classify images using a supervised
classification method.
- Step 4: Assess land cover changes on multi-temporal Landsat images using the
post-classification analysis method.
4. Results and discussion
The land cover features of Subi Reef are classified using the workflow indicated
in Figure 3.
The land cover features of Subi Reef have changed from year to year. As a result,
the interpretation of the corresponding high-resolution satellite image each year (Figure 4)
and the spectral reflectance characteristics of the features (Figure 5) are used to determine
the land cover of Subi Reef. Figure 5 shows the difference between the spectral
78
Journal of Science and Technique - ISSN 1859-0209
reflectance patterns of barren land and built-up features. The surface reflectance values of
the runway, built-up, and under construction (in 2016) features are similar, and the
spectral reflectance profiles of coral reefs, grass, and solar panels are all different.
Figure 4. Visual interpretation land cover features of Subi Reef on high resolution
satellite image. (A) Runway, (B) Built-up; (C) Under construction [16].
Figure 5. The surface reflectance of land cover features on Subi Reef in Landsat image.
79
Section on Special Construction Engineering
Table 2. Assessment of the classification accuracy from 2014 to 2020
Landsat image
Kappa index
Overall accuarcy
24/04/2014
0.9738
98.86%
11/04/2015
0.9873
98.18%
29/04/2016
0.9602
97.65%
16/04/2017
0.7725
85.52%
24/07/2018
0.9849
99.18%
06/04/2019
0.8597
91.72%
10/05/2020
0.8274
89.82%
Table 2 shows the Subi Reef's land cover classification accuracy from 2014 to
2020. The classification accuracy is calculated by ROI samples selected from the
Landsat multispectral image. With a Kappa index of 0.9849, the greatest classification
accuracy was 99.18%. The overall classification accuracy of the multi-temporal images
are more than 85%.
Figure 6a shows the landcover classification results of Subi Reef using multitemporal Landsat images from 2014 to 2020. Subi Reef was only an atoll in 2014, with
a military building on the island's southwest. China began construction activities on
Subi Reef in 2015. A number of constructions were built on the island in 2016. From
2017 to 2020, the island's infrastructure and buildings were still being built.
Figure 6a. The landcover classification of Subi Reef from 2014-2020.
80
Journal of Science and Technique - ISSN 1859-0209
Figure 6b. The landcover area changes of Subi Reef from 2014-2020.
Figure 6b illustrates the land cover area changes of Subi Reef from 2014 to 2020.
Subi Reef's area in 2014 was mostly coral reef with 1912.8 ha. The coral reef area was
decreased to 742.4 ha in 2015. Simultaneously, land cover features such as sand and
barren land increased approximately 99.8 ha and 106.16 ha, correspondingly. In 2015,
China began work on the Subi Reef. China had completed the runway and certain
building elements with a total size of 3.2 ha by 2016. In 2016, the area of coral reef
declined to 567.4 ha, while barren land and under construction features expanded. The
built-up area increased significantly from 2017 to 2020 with 80 ha and the coral reef's
area remains unchanged at 510.8 ha. In 2020, the area of barren land was be decreased to
20.4 ha, and increased the area of grass feature of 125.1 ha and solar panel.
According to that, China has seized Subi Reef and rebuilt it into an artificial
island. This will have a significant impact on regional security while also affecting the
maritime ecosystem of the Truong Sa Islands.
5. Conclusion
Consequently, China's illegally occupied Subi Reef is currently mainly an
artificial island. Since 2015, China has been reclaiming the island. During 2014 to 2020,
the land cover features of the island changed with each step of the island's reclamation.
According to study, Subi Reef was just an atoll in 2014. However, different land cover
features such as built-up, barren land, and grass will be founded in 2020. China is
increasing human activity on Subi Reef, as evidenced by the appearance of man-made
features on the island.
81
Section on Special Construction Engineering
According the classification result, Landsat satellite images are significant data for
classifying land cover features on offshore islands, especially atolls and artificial islands
in the Truong Sa Islands. To classify the land cover on small islands in the Truong Sa
Islands, Landsat images should be pre-processed, which includes atmospheric effecting
correction using the DOS method and image fusion using Gram-Schmidt method to
enhance images. Land cover classification results using multi-temporal Landsat images
have an accuracy of more than 85%. Additionally, the classification results are
consistent with the results of a high-resolution satellite image evaluation of construction
activities at Subi Reef.
References
[1]
Nhu Tam (2015), />
[2]
A. Singh, "Review Article Digital change detection techniques using remotely-sensed
data", International Journal of Remote Sensing, 10(6), pp. 989-1003, 2010.
[3]
D. Lu, P. Mausel, E. Brondizio and E. Moran, "Change detection techniques",
International Journal of Remote Sensing, 25(12), pp. 2365-2401, 2004.
[4]
J. Rogan and D. M. Chen, "Remote sensing technology for mapping and monitoring landcover and land-use change", Progress in Planning, 61(4), pp. 301-325, 2004.
[5]
X. Yang and C. P. Lo, "Using a time series of satellite imagery to detect land use and land
cover changes in the Atlanta, Georgia metropolitan area", International Journal of
Remote Sensing, 23(9), pp. 1775-1798, 2002.
[6]
A. Jwan, B. M. Shattri, Z. M. S. Helmi, "Change Detection Process and Techniques",
Civil and Environmental Research, 3(10), pp. 37-46, 2013.
[7]
C. Baker, R. L. Lawrence, C. Montagne, D. Patten, "Change detection of wetland
ecosystems using Landsat imagery and change vector analysis", WETLANDS. 27(3),
pp. 610-619, 2007.
[8]
G. T. Ayele and et al., Multitemporal Land Use/Land Cover Change Detection for the
Batena Watershed, Rift Valley Lakes Basin, Ethiopia, 2016, pp. 51-72.
[9]
Z. Hassan and et al., "Dynamics of land use and land cover change (LULCC) using
geospatial techniques: A case study of Islamabad Pakistan", SpringerPlus, 5(1), p. 812,
2016.
[10] K. M. Kafi, H. Z. M. Shafri, A. B. M. Shariff, "An analysis of LULC change detection
using remotely sensed data; A Case study of Bauchi City", IOP Conference Series: Earth
and Environmental Science, 20, p. 012056, 2014.
[11] L. B. Nguyen, "Land cover change detection in northwestern Vietnam using Landsat
images and Google Earth Engine", Journal of Water and Land Development, 40(VII-IX),
pp. 162-169, 2020.
82
Journal of Science and Technique - ISSN 1859-0209
[12] L. D. Nguyen and et al., “Change Detection of Land Use and Riverbank in Mekong
Delta, Vietnam Using Time Series Remotely Sensed Data”, Journal of Resources and
Ecology, 2(4), pp. 370-374, 2011.
[13] N. T. Thanh, “Fractional Vegetation Cover Change Detection in Megacities Using
Landsat Time-Series Images: A Case Study of Hanoi City (Vietnam) during 1986-2019”,
Geography, Environment, Sustainability, 12(4), pp. 175-187, 2019.
[14] J.W. Stephen, and et al., Land cover and land use change on islands: Social & Ecological
Threats to Substainability, Springer, Switzerland, pp. 63-88, 2020.
[15] C. A. Laben and et al., “Process for enhancing the spatial resolution of multispectral
imagery using pan-sharpening”, US Patent, No. US006011875A, 2000.
[16] />
ĐÁNH GIÁ BIẾN ĐỘNG LỚP PHỦ TRÊN ĐẢO ĐÁ XU BI
TẠI QUẦN ĐẢO TRƯỜNG SA, VIỆT NAM SỬ DỤNG
ẢNH LANDSAT ĐA THỜI GIAN
Lê Minh Hằng
Tóm tắt: Trong bài báo này, tác giả đề xuất tư liệu ảnh Landsat sẽ thực hiện bước tiền xử
lý ảnh gồm hiệu chỉnh khí quyển bằng phương pháp DOS và tăng cường chất lượng ảnh bằng
phương pháp Gram-Schmidt. Kết quả cho thấy độ chính xác phân loại trên ảnh đa thời gian đạt
trên 85% và tư liệu ảnh Landsat phù hợp để phân loại lớp phủ trên các đảo nhỏ tại quần đảo
Trường Sa như đảo đá Xu bi.
Từ khóa: Biến động lớp phủ; đảo đá Xu bi; quần đảo Trường Sa; ảnh đa thời gian; ảnh Landsat.
Received: 05/04/2022; Revised: 02/06/2022; Accepted for publication: 20/06/2022
83