Health, schooling and lifestyle among young adults in Finland ppt
Bạn đang xem bản rút gọn của tài liệu. Xem và tải ngay bản đầy đủ của tài liệu tại đây (193.42 KB, 16 trang )
HEALTH ECONOMICS
Health Econ. 15: 1201–1216 (2006)
Published online 19 June 2006 in Wiley InterScience (www.interscience.wiley.com). DOI:10.1002/hec.1123
Health , schoo lin g and lifestyle am on g y oung adults in Fin land
Unto Ha
¨
kkinen
a,
*, Marjo-Riitta Ja
¨
rvelin
b,c
, Gunnar Rosenqvist
a,d
and Jaana Laitinen
e
a
Centre for Health Economics at STAKES (CHESS), Finland
b
Department of Public Health and General Practice, University of Oulu, Finland
c
Department of Epidemiology and Public Health, Imperial College London, UK
d
Swedish School of Economics and Business Administration, Helsinki, Finland
e
Oulu Regional Institute of Occupational Health, Finland
Summary
This was a longitudinal, general population study based on a Northern Finland 1966 Birth Cohort, using a
structural equation approach to estimate the health production function and health input functions for four lifestyle
variables (smoking, alcohol consumption, exercise and unhealthy diet) for males and females. In particular, we
examined the productive and allocative effects of education on health. We used 15D, a generic measure of health-
related quality of life, as a single index score measure but we also estimated models for some of its dimensions.
Among the males, the important factors impacting on health were education and all the four lifestyle factors, as well
as some exogenous variables at 31 years and variables describing parents’ background, and health and behaviour at
14 years. An increase of five years in schooling increased the health score by 0.008, of which about 50% was due to
direct effect and 50% due to indirect effects. Among the females, education does not impact on health, but health
was affected by the use of alcohol, exercise and diet, but not by smoking.
Our results indicate that policy options that increase education among men will increase their health indirectly via
healthier lifestyles. However, since the total effect was rather modest and the direct effect insignificant, an increase of
schooling is not a cost-effective way to increase health given the present high educational level of Finland. The young
adults’ and particularly women’s internationally high educational status in Finland might be a reason why we find
only a modest effect of schooling on health and the non-existence of such effects among women. Copyright # 2006
John Wiley & Sons, Ltd.
Received 29 April 2004; Accepted 28 February 2006
Keywords health; education; lifestyle; longitudinal study; health production function
Introduction
Information on health determinants is one of the
most important starting points for health policy.
Various studies by eco nomists and epidemiologists
have tried to understand the relationship between
health, schooling and other policy-relevant factors.
Most economic studies on health determinants
are based on the estimation of reduced-form
equations, often using cross-sectional and rather
crude health variables. In our study, a structural
equation model of health determinants was deve-
loped using a unique longitudinal birth cohort
study in order to estimate the relative effect of
factors impacting health. Of special interest was
modelling the relationship between health and
schooling while taking into account lifestyle
mediators. A verified positive causal link between
*Correspondence to: Centre for Health Economics at STAKES (CHESS), PO Box 220, Lintulahdenkuja 4, 00530 Helsinki,
Finland. E-mail: unto.hakkinen@stakes.fi
Copyright # 2006 John Wiley & Sons, Ltd.
schooling and health would, depending on its
nature, imply the possibility of increasing the
aggregate level of health either by increasing
schooling or by increasing health education and
other activities designed to encourage health
habits.
The effect of schooling on health has been
subject to a large amount of economic research,
which has been extensively reviewed several times
[1–4]. The main message from these reviews of the
literature is that education has a positive causal
effect on health. This finding emerges irrespective
of how health is measured. The same finding has
been noticed in studies made in developed
countries, in the USA and also in a few studies
made in Europe.
During the last decades the level of education
has still increased in many developed countries and
the young adults are more educated than earlier
generations. So far a majority of studies have been
based on data in which it has not been possible
to consider the relationship between health and
education among the young generations. One
exception is a recent study by Auld and Sidhu [5]
using a US longitudinal dataset of youths, which
oversamples minorities and economically disad-
vantage individuals. According to their results an
increase in schooling will have an effect on health
only for individuals who have obtained low levels
of schooling, particularly low-ability individuals.
In addition, most economic studies on the topic
are made in developing countries or in the USA,
whose education and schooling systems differ from
those in Europe. The Finnish system is closest to
those in the other Nordic welfare-state countries in
which socio-economic equity has been emphasised
as a target for both the educational and health
system. In Finland, the participation of women
in the labour force is high compared to many other
countries, which also may affect the relationship
between health and schooling. In the mid-1990s,
the educational level of Finns aged 25–35 was
clearly higher than the EU average and among
females the educational level was one of the
highest in the EU [6]. Thus among youn g adults
in Finland, the marginal effects of general educa-
tion on health might be small or even null.
One concern in previous studies was related to
measuring health status. Usually it is measured by
indicators such as self-rated health [7–9], activity
limitations [10,11], restricted activity days [10,11]
and blood pressure [10]. We measured health by
15D. It is a measure for health-related quality of
life (HRQOL) [12–14], which combines informa-
tion on different dimensions of health into a single
score. In addition, we estimated the effects of
education and lifestyle variables on the dimensions
of the 15D. In many respects, especially in
terms of discriminating power (sensitivity) the
properties of the 15D have been found to be
superior to generally used profile and single index
score instruments [14–16]. The 15D has recently
been used as a standard to validate different
methods concerning the problems associated with
use of self-rated health measures [17]. The 15D has
been and is used in many projects for evaluating
health technology and is included in population
surveys. Thus, the results of this study can be
compared with those from these previous studies.
Theo reti cal framewo rk
The economic literature describing health determi-
nants follows on predominantly from Grossman’s
[18] contribution. In this framework, the indivi-
dual is seen as combining market and non-market
inputs to yield an output of good health. The
individual is assumed to choose a health lifestyle
based on health effects and direct utility effects,
subject to income and time constraints. The indivi-
dual also determines his or her health, in part,
through health lifestyle choices. Different theore-
tical [8,9] models lead to a general model on
determinants of health in a period t:
H
t
¼ HðH
tÀ1
; L; E; XÞð1Þ
where H
tÀ1
is health status in tÀ1, E is education,
L is lifestyle and X is a vector of exogenous
characteristics.
When estimating the health production func-
tion, the effect of schooling is important from a
policy perspective. If there is a high correlation
between health and schooling, an increase in
expenditure on education may be a cost-effective
technique for increasing the aggregate level of
health. It is common to distinguish the productive
(direct) from the allocative effects of education on
health. Productive efficiency refers to the fact that
education leads to a larger health output from a
given set of health input. The notion of allocative
efficiency
a
suggests that a more educated person
is likely to select more efficient inputs (such as
lifestyles) to produce health. For example, school-
ing increases information about the true effects of
Copyright # 2006 John Wiley & Sons, Ltd. Health Econ. 15: 1201–1216 (2006)
DOI: 10.1002/hec
U. Ha
º
kkinen et al.
1202
health inputs. The more educated may have more
knowledge about the harmful effects of cigarette
smoking or about what constitutes an appropriate,
healthy diet. The distinction between the two
forms of efficiency is important for resource allo-
cation: evidence in support of allocative efficiency
will justify efforts encouraging healthy habits
whereas evidence in support of productive effi-
ciency will justify an expansion of schooling [1,7].
On the other hand, a positive correlation bet-
ween health and schooling may be due to one or
more unobservable variables such as genetics,
personal factors or rates of time preference affect-
ing both health and schooling in the same direc-
tion. Finally, it can be due to reverse causality,
arguing that better health results in more school-
ing. In econometric terminology, Grossman [2]
points out that both explanations can be seen
as falling under the general rubric of biases due
to unobserved heterogeneity among individuals.
In the case of unobserved variables or reverse
causality, the policy-rel evant effects of an increase
in education are not valid.
So far as we know, there is only one study that
has tried to distinguish between the pr oductive and
allocative effects of education [8]. They found that
the productive effects were clearly greater than the
allocative effects. However, the study is based on
cross-sectional US data from 1987 and thus some
caution is required in generalising their results [4].
In this study, we will evaluate directly the
productive and allocative efficiency effects and
try to take into account possible reverse causality,
as well as control for a possible unobserved
common source. We will focus on young adults
i.e. a generation whose education level is consider-
ably high.
Methodical questio n s
From a methodological point of view, it should be
noted that the health production function is a
structural equation system, since health inputs
may also be endogenous. Ordinary least squares
(OLS) estimates of the parameters of the produc-
tion function may be biased and inconsistent
because the inputs are likely to be correlated with
disturbance terms. Early research in this area
assumed that reduced form equations could be
estimated by OLS. Later research has questioned
this procedure; in particular, that schooling is
uncorrelated with the disturbance term for health
in the reduced form [1]. The usual method is to
first estimate the reduced form equation for health
inputs and then, in the second stage, the input
demand functions are substituted into the health
production function. As shown by Rosenzweig
and Schultz [20], such a two-stage procedure can
also take into account omitted variables (popu-
lation heterogeneity), assuming that variables used
to predict inputs are not correlated with the
error terms of the input equation or the produc-
tion function. In the two-stage least squares
models, there have been difficulties in calculating
the predicted values of the endogenous inputs:
Most instrument variables used in the first stage
have turned out to be poor predictors and the
second-stage results have been sensitive to the
specific specifications employed [11,21,22].
We estimate all equations of the structural
model simultaneously. This is done by the
LISREL program [23], which provides the possi-
bility to include, for example, latent variables,
measurement errors in dependent and independent
variables, correlation between measurement
errors, simultaneity, and detailed effect decom-
position. Estimation is done with maximum like-
lihood under a normality assumption. This
approach allows direct testing of the endogeneity
of inputs and makes it possible to calculate direct
and indirect (i.e. the productive and allocative
efficiency) effects, which are not possible to sepa-
rate from each other in reduced-form equations.
The statistical tests and diagnostics included in the
output of the program (e.g. modification indices)
help the investigators to choose the sp ecification.
In this study, by applying the LISREL approach
to longitudinal data, it was also possible to take
into account possible reverse causality, since we
had information on health status and education at
adolescence [2,22]. The third variable hypothesis is
tested by allowing disturbances of health and
education to correlate. The previous studies on the
effects of controlling unobserved heterogeneity are
not clear. For example, in the US study,
this third variable bias was not significant and
results were inconsistent with the time preference
hypothesis [10]. On the other hand, Gillesekie
and Harr ison [8] reported that controlling for
unobserved heteroge neity using a discrete factor
random effects estimator has a substantial impact
on parameter estimates. At least this underlines the
importance of careful model specification, includ-
ing the selection of the relevant explanatory
variables.
Health, Schooling and Lifestyle among Young Adults in Finland 1203
Copyright # 2006 John Wiley & Sons, Ltd. Health Econ. 15: 1201–1216 (2006)
DOI: 10.1002/hec
Data and variables
The data are based on a Northern Finland 1966
Birth Cohort study (u.fi/NFBC). All
births in the provinces of Oulu and Lapland in
Northern Finland 1966 (96.3% of all 1966 births)
were eligible (n ¼ 12 058 live births). The data
include questionnaires, hospital records and other
information collected from other registers [24,25].
Data on parents’ socio-demographic back-
ground factors were collected by questionnaire
during the 24th–28th gestational weeks. Data on
the course of the pregnancy were prospectively
recorded in the maternity records, and transferred
by midwives onto study forms, as were data
on birth and the newborn at the time of delivery.
Data were also collected at 1 year from child
welfare centres and at 14 years by adolescent
questionnaires. The latter include questi ons con-
cerning growth and health, living habits, school
performance and family conditions.
The latest follow-up in 1998, at age 31, consisted
of questionnaires to all offspring (76% response)
and further examinations for those living in the
original target area or in the area of the capital
Helsinki when additional inquiries on health and
quality of life were distributed. For the rest of
the cohort population living in other parts of
Finland, the same data (15D) were collected by
mailed questionnaire. The data are described in
the appendix. The data used here included 1989
males and 2354 females.
Table 1 show the variables included in the final
models. Health status was measured by an index
score of 15 dimensions: mobility, vision, hearing,
breathing, sleeping, eating, speech, elimination,
usual activities, mental function, discomfort
and symptoms, depression, distress, vitality, and
sexual activity [12–14]. The valuation system of the
15D is based on an application of the multi-
attribute utility theory. A set of utility or prefe-
rence weights , elicited from the general public
through a valuation procedure is used in an addi-
tive aggregation formula to generate the 15D score
(a single index number) over all the dimensions.
The maximum index score is 1 (no problems on
any dimensions) and the minimum score is 0
(being dead). The 15D score is defined as
v
H
¼
X
j
I
jk
ðx
jk
Þw
jk
ðx
jk
Þ¼
X
j
D
jk
ðx
jk
Þð2Þ
where I
jk
ðx
jk
Þ is the average relative impor tance
people attach to level k ðk ¼ 1; ; 5Þ of dimension
jðj ¼ 1; ; 15Þ; and w
jk
ðx
jk
Þ is the average value
people place on level k of dimension j. The main
analysis is made using the 15D score as the
dependent variable. Additional analyses were also
made using the scores of individual dimensions as
a dependent endogenous variable (Figure 1).
Lifestyle variables (diet, alcohol consumption,
exercise, and smoking) as well as other back-
ground variables were ascert ained at the 31-year
follow-up as a part of the larger postal ques-
tionnaire sent to all cohort members. Data on food
consumption was gathered with a method com-
monly used in Finnish population surveys [26,27].
The subjects were asked to consider their food
consumption during the previous 6 months and to
choose a suitable alternative on a structured 6-
point scale. Data on the frequency of consumption
of food rich in fibre (such as rye bread, fresh
vegetables and salads, berries or fruit) and food
rich in high saturated fats (such as sausages) were
obtained. From this information, an ordinal six-
class variable was constructed (0 ¼ healthy diet,
5 ¼ unhealthy features of diet) [28]. For the diet
variable that is observed on an ordinal scale, we
use the LISREL approach of assuming an under-
lying latent continuous variable that is normally
distributed with a zero mean and a standard
deviation of one [29].
The questions on alcohol measured the average
frequency of consumption of be er, wine, and
spirits during the last year, and the usual amount
of alcohol consumed on one occasion. The amount
of alcohol (grams) consumed per day (continuous
variable) was calculated using the average
estimates of alcohol content in beer, light wi nes,
wines and spirits [28]. The frequency of smoking
(number of cigarettes per day) and exerci se
(number of minutes of training) were calculated
in a similar way using rather detailed questions.
Exercise was also treated as a continuous variable.
Since dist ribution of smoking was rather skewed
with a large number of zeros it was treated as
an ordinal variable including three values (0 ¼ no
smoking, 1 ¼ occasional smoking, 2 ¼ regular
daily smoking).
Education was measured by the years of school-
ing prior to the 31-year follow-up, which were
calculated from the education register data linked
to cohort data using the unique personal ID-
number.
As can be seen from the appendix, the study
used data from about 36% of the original sample
and about 37% of the cases who were alive in
U. Ha
º
kkinen et al.1204
Copyright # 2006 John Wiley & Sons, Ltd. Health Econ. 15: 1201–1216 (2006)
DOI: 10.1002/hec
1997. The 15D variable was available for more
than 50% of the cases. Attrition for different
reasons decreased the sample considerably. An
analysis of the sample selection indicated that
persons with lower education had a much higher
probability to be excluded from our sample than
persons with a higher education (appendix).
Model speci ¢cati on
In this study, our analytical focus is on the
health determinants of 31 year olds. It is assumed
that their independent rational behaviour started
after the age of 14. Thus, many variables related
to health, e.g. health-related behaviour as well
as family background measured at the age of
14 years are predetermined (exogenous) in our
model.
The empirical model building process proceeded
in stages. First, the input function for each lifestyle
variable was estimated separately. In addition,
a separate function was estimated for education
in order to evaluate the possible causal effects
of health determinants through education. Finally,
the health production function (1) was estimated.
With longitudinal data, the timing of events
constitutes a natural restriction on the direction
of causal relationships – cause must precede effect.
Hence, we can specify a system of equations which
Table 1. Description of variables and their means among males and females
Males Females
Endogenous variables (at 31 years of age)
Health, 15D score (H) 0.962 0.950
Schooling, number of years of schooling (E) 12.2 12.5
Smoking, ordinal variable describing smoking habits
(0 ¼ no smoking, 1 ¼ occasional smoking, 2 ¼ regular daily smoking)
0.70 0.47
Alcohol, consumption of alcohol (grams) per day 13.3 5.2
Exercise, number of minutes of heavy training in a month 334 287
Diet, ordinal variable describing dietary habits
(0 ¼ healthy diet, 5 ¼ unhealthy features in diet)
2.39 1.72
Health at birth and parents background variables (X)
Birth weight,1000 g 3.6 3.5
Mothers schooling, number of years of schooling 6.8 6.8
Fathers socio-economic class 1 at 14 years old, dummy
variable ¼ 1 if socio-economic class 1 0.14 0.13
Fathers socio-economic class 2 at 14 years old, dummy
variable ¼ 1 if socio-economic class 2 0.20 0.19
Father living in the family at 14 years old, dummy variable ¼ 1 if father living
in the family
0.90 0.88
Living in rural area, dummy variable ¼ 1 if living for rural area at time of birth 0.68 0.66
Health and behaviour at 14 years old (Z)
Smoking at 14 years old, dummy variable ¼ 1 if smoking at least once a week 0.05 0.06
Alcohol drinking at 14 years old, dummy variable ¼ 1 if drinking at least
once in a month
0.02 0.03
Exercise at 14 years old, number of sport activities in a month 14.0 9.28
Average grade in all subjects at school at 14 years old (scored 4–10) 7.46 8.04
Repeated years at school at 14 years old 0.02 0.01
Occurrence of mild illness of long duration 0.14 0.14
Occurrence of severe illness of long duration 0.09 0.10
Number of Illness days during the year at 14 years old 1.56 1.59
Exogenous variables at 31 years old (Y)
Unemployment, dummy variable ¼ 1 if unemployed 0.09 0.10
Total years of unemployment 0.54 0.52
Student, dummy variable ¼ 1 if student 0.02 0.04
Number of children in family 1.06 1.38
Number of adults in family 1.83 1.80
Health, Schooling and Lifestyle among Young Adults in Finland 1205
Copyright # 2006 John Wiley & Sons, Ltd. Health Econ. 15: 1201–1216 (2006)
DOI: 10.1002/hec
is recursive at least if we disregard possible
covariance between error terms.
In summary, our model consists of the following
equations:
H ¼ a
1
þ a
2
E þ a
3
DIET þ a
4
EXERCISE
þ a
5
ALCOHOL þ a
6
SMOKING
þ a
7
X
1
þ a
8
Z
1
þ a
9
Y
1
þ e
1
ð3Þ
E ¼ b
1
þ b
3
X
2
þ b
4
Z
2
þ b
5
Y
2
þ e
2
ð4Þ
DIET ¼ c
1
þ c
2
E þ c
3
X
3
þ c
4
Z
3
þ c
5
Y
3
þ e
3
ð5Þ
EXERCISE ¼ d
1
þ d
2
E þ d
3
X
4
þ d
4
Z
4
þ d
5
Y
4
þ e
4
ð6Þ
ALCOHOL ¼ e
1
þ e
2
E þ e
3
X
5
þ e
4
Z
5
þ e
5
Y
5
þ e
5
ð7Þ
SMOKING ¼ f
1
þ f
2
E þ f
3
X
6
þ f
4
Z
6
þ f
5
Y
6
þ e
6
ð8Þ
where H is health status as measured with 15D;
E is education; DIET, EXERCISE, ALCOHOL
and SMOKING are lifestyle variables; X, Y and
Z are vectors of exogenous variables with X
describing parents background and health at
birth, Z health an d behaviour at the age of 14
and Y exogenous variables at the age of 31, while
e
j
are error terms.
The X, Y and Z vectors need to be specified.
Neither the theoretical health production model
nor the findings of other relevant studies give us
complete guidance for each of the model equations
on the exact choice of specific variables from the
set available. We perform a general-to-specific
specification search [30] with the aim of finding
a model that fits the data well and in where
the parameters are significant and substantially
meaningful. Parameters with small t-values are
eliminated and parameters with large modification
indices are added [23]. In addition to the vari-
ables given in Table 1, for example, a number of
variables describing parent’s behaviour and family
circumstances at time of birth were excluded since
they were not significant and did not affect the
coefficients of other variables.
b
0.750
0.800
0.850
0.900
0.950
1.000
male
0.990 0.989 0.994 0.970 0.934 0.998 0.985 0.958 0.986 0.957 0.849 0.965 0.942 0.930 0.992
female
0.988 0.988 0.995 0.955 0.923 0.999 0.987 0.927 0.982 0.949 0.798 0.947 0.932 0.901 0.982
mobility vision hearing
breath-
ing***
sleeping
**
eating speech
elimina-
tion***
usual
activities
mental
function
discom-
fort***
depres-
sion***
distress**
vitality***
sexual
activity***
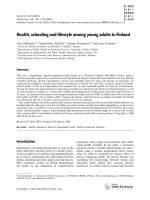
Figure 1. The 15D profiles of the OULU Cohort 1966 population at 31 years old. Mean scores of each dimension among males and
females. The scores are standardised so that the highest level of each dimension has a value of 1. Asterisks indicates statistical
differences in mean scores between the genders (
*
p50.05,
**
p50.01,
***
p50.001)
U. Ha
º
kkinen et al.
1206
Copyright # 2006 John Wiley & Sons, Ltd. Health Econ. 15: 1201–1216 (2006)
DOI: 10.1002/hec
Before the estimation of the final models, we
made some preliminary analysis using a single
equation (OLS) production function for health
(where all other variables in Table 1 were treated
as exogenous) in order to get some guidance for
the model specification. We analysed the func-
tional form of the endogenous variable and the
differences between the sexes of effects that lifestyle
variables and exogenous variables had on health.
For example, in some studies the effect of alcohol
consumption on health has been found to be non-
linear so that moderate drinking has had favour-
able health effects compared to non-drinking or
heavy drinking. In our data, we did not find
evidence of non-linearity.
There were gender differences in mean values
of endogenous and exogenous variables (Table 1).
The total score of 15D as well as eight of its dimen-
sions (Figure 1) were statistically higher among
males compared to females while the opposite was
found with respect to schooling. The preliminary
analysis using a single equation (OLS) production
function indicated significant sex differences
(Chow test). A dummy variable test indicated that
the differences between the males and females were
related in particular to smoking (more negative
effect among males), alcohol consumption (more
negative effect among females) and being a student
(less negative effect among females). Thus, models
were estimated separately for males and females.
We specified similar models for both genders in
order make their comparison easy. In other words,
if a variable was significant for one of the sexes, it
was kept in the model for both of them.
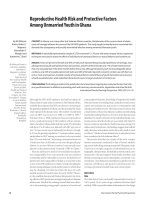
The general structure of the model is shown
in Figure 2. There is no clear theoretical basis
to model the relationship between the lifestyle
variables. Thus we end up with a specification
in which we allowed the disturbances of life-
style variables to correlate. This means that the
system of equations is in fact block recursive. The
LISREL approach allows us to control for possi-
ble unobserved latent variables by allowing the
error terms of endogenous variables to be corre-
lated with each other and by specifying specific
factors. We teste d the third variable hypotheses
by allowing the error terms of the health and
education equations (3) and (4), i.e. e
1
and e
2
; to be
correlated. However, for both genders, the covari-
ation between these error terms was not statis-
tically significant (t ¼ 0:65 among males and t ¼
0:96 among females and the corresponding like-
lihood ratio test gave a chi-square statistic of 0.88
for male s and 1.87 for females on one degree of
freedom). Thus there is no significant covariation
left to be explained by a latent ‘third variable’.
Consequently, this error covariance is restricted to
zero and is not included as a free parameter in the
estimated models to be reported.
In order to get a more detailed picture of the
relationship between health, schooling and life-
style, the models developed for the total score
Schooling
Lifestyle
variables
Health
Health at birth
and parents’
background
Health and
behaviour
at 14
years of age
Exogenous
variables
at 31 years
of age
Figure 2. The structure of the model
Health, Schooling and Lifestyle among Young Adults in Finland
1207
Copyright # 2006 John Wiley & Sons, Ltd. Health Econ. 15: 1201–1216 (2006)
DOI: 10.1002/hec
(15D) were applied to some of the dimensions
of the 15D. Since our study population consists
of young adults whose health status was consider-
ably good, the analysis is only sensible for those
dimensions where there is sufficient variation. For
example, in dimensions such as mobility, vision.
hearing, and eating, the mean score was rather
near 1 (Figure 1), with most of the individual
values concentrated at the highest level.
In addition to looking at the direct and indirect
effects of education on health, it could be of policy
interest to distinguish between the total (cumula-
tive) and dynamic (short-term) effects of educa-
tion on health. Here, dynamic effects refer to the
effect of education on the change of health status
between two periods. As we have no measure-
ments between the ages of 14 and 31, we cannot
extract short-term effects, rather the estimated
effects have to be regarded as cumulative ones.
However, as pointed out by van Doorslaer [22],
possible unobserved factors that have executed
their whole effect on health status already at the
age of 14 do not cause an omitted variable bias
when estimating the health production function at
31, controlling for health status at the age of 14.
Results
The estimation results are displayed in Table 2 for
males, in Table 3 for females and the total effects
of exogenous variables on health are in Table 4.
The goodness-of-fit of the models measured by the
Table 2. Estimation results, males (N ¼ 1989)
Smoking Alcohol Exercise Diet Schooling Health
Endogenous variables (at 31 years of age)
Smoking À0.002
*
Alcohol À0.0002
***
Exercise 0.00001
***
Diet À0.003
**
Schooling À0.08
***
À0.77
***
9.3
*
À0.088
***
0.0009
Health
Exogenous variables
Health at birth and parents background
Birth weight À0.08
*
À0.005 0.002
Mothers schooling 0.08
***
Fathers socio-economic class 1 2.7
*
0.6
***
Fathers socio-economic class 2 0.03 2.7
*
0.2
*
Father living in the family À0.16
*
0.2
Living in rural area À0.17
***
À2.4
**
À0.09
*
À0.3
**
Health and behaviour at 14 years of age
Smoking at 14 years old 0.67
***
5.4
*
Alcohol at 14 years old 0.14 11.2
**
Exercise at 14 years old 58
***
À0.008
***
0.0002
*
Average grade in all subjects at school À0.19
***
À0.14
***
1.4
***
Repeated years at school À0.06 À0.57
*
Occurrence of mild illness of long duration À0.06 À0.007
*
Occurrence of severe illness of long duration 0.09 À0.1 À0.012
***
Number of illness days during the year 0.02
*
0.027
**
À0.02 À0.0007
Exogenous variables at 31 years of age
Unemployment À0.03 5.6
***
118
***
À0.01
**
Total years of unemployment 0.006
**
0.4 À0.0008
Student 0.20 0.38
**
À0.03
***
Number of children 0.05
**
À1.2
***
À31
***
0.04
*
0.07
**
Number of adults À0.15
***
À3.3
***
6.4
R
2
0.16 0.06 0.05 0.11 0.46 0.08
Chi-square = 52.9 (p ¼ 0:73). Degrees of freedom = 60. Root mean square error of approximation (RMSEA) = 0.09.
Comparative fit index (CFI) = 1.000. Adjusted goodness of fit index (AGFI) = 0.989.
*
p50.05,
**
p50.01,
***
p50.001.
U. Ha
º
kkinen et al.
1208
Copyright # 2006 John Wiley & Sons, Ltd. Health Econ. 15: 1201–1216 (2006)
DOI: 10.1002/hec
usual chi-square statistics as well as other mea-
sures were satisfactory.
Among males, the use of alcohol (À), exercise
both at the ages of 31 and 14 years (+), being a
student (À), indices for the occurrence of long-
duration illnesses at 14 years (À), (unhealthy) diet
(À), unemploym ent (À) and smoking (À) were
directly and statistically significantly related to
health (Table 2). We find a significant total effect
on health for the variables of previous childhood:
average school grades (+); mothers’ schooling
(+); smoking (À), father living in a family (+);
drinking habits (À). In addition, the total effect of
the number of adults (+) as well as children (À)in
the family at 31 years were also significant
(Table 4). Schooling was positively related to
health, but the relationship was not statistically
significant (p ¼ 0:07). There was a clear indication
of the allocative effects of schooling, since school-
ing was related to the lifestyle variable in a health-
promoting way.
As was expected from our preliminary analysis
there were clear differences in the results between
the genders. The most impor tant difference is that
smoking and schooling were not associated with
health among females as they were among males.
On the other hand, alcohol con sumption, exercise
and diet were related to health in a similar way
among females as among males, but the negative
effects of alcohol on health was much greater
among females. Among females, education was
related in a health promoting way to smoking,
Table 3. Estimation results, females (N ¼ 2354)
Smoking Alcohol Exercise Diet Schooling Health
Endogenous variables (at 31 years of age)
Smoking 0.0001
Alcohol À0.0009
***
Exercise 0.000006
*
Diet À0.005
***
Schooling À0.07
***
À0.41
***
À2.9 À0.047
***
À0.00002
Health
Exogenous variables
Health at birth and parents background
Birth weight À0.05 À0.03 À0.004
Mothers schooling 0.08
***
Fathers socio-economic class 1 2.4
***
0.4
***
.
Fathers socio-economic class 2 0.10
*
À0.14 0.1
Father living in the family À0.27
***
0.3
**
Living in rural area À0.13
***
À0.10 À0.14
***
À0.12
Health and behaviour at 14 years of age
Smoking at 14 years old 0.71
***
1.6
*
Alcohol at 14 years old 0.24
*
1.9
Exercise at 14 years old 42
***
À0.005
*
0.00007
Average grade in all subjects at school À0.29
***
À0.11
***
1.26
***
Repeated years at school À0.65
***
À0.36
Occurrence of mild illness of long duration À0.06 À0.008
**
Occurrence of severe illness of long duration À0.13
*
0.05 À0.009
**
Number of illness days during the year 0.02
*
À0.007 À0.03
*
À0.001
***
Exogenous variables at 31 years old
Unemployment 0.16
*
À0.27 74
***
À0.0008
Total years of unemployment À0.04
*
À0.51
***
À0.002
**
Student 0.20
*
0.28
*
À0.005
Number of children À0.089
***
À1.39
***
À43
**
À0.06
***
À0.20
***
Number of adults À0.20
***
À1.13
***
26
***
R
2
0.23 0.08 0.04 0.04 0.43 0.06
Chi-square = 68.3 (p ¼ 0:22). Degrees of freedom = 60. Root mean square error of approximation (RMSEA) = 0.008.
Comparative fit index (CFI) = 0.998. Adjusted goodness of fit index (AGFI) = 0.987.
*
p50.05,
**
p50.01,
***
p50.001.
Health, Schooling and Lifestyle among Young Adults in Finland
1209
Copyright # 2006 John Wiley & Sons, Ltd. Health Econ. 15: 1201–1216 (2006)
DOI: 10.1002/hec
alcohol consumption and diet, as among men, but
not to exercise. In addition, the mechanism and
effects associated with parents’ socio-economic
status, behaviour at 14 years, being a student,
unemployment and family structure were different.
For example, among females, the total effect of
the fathers’ good socio-economic status on health
was negative since this variable was associated
with increasing alcohol consumption, and
although it was positively related with education,
as noted, education was not significantly related
with health among females. Finally, it is worth
mentioning that effects of family structure at
31 years old is different between the genders, the
number of children had a positive effect only
among females whereas the opposite held for
males. The positive effect of the number of adults
in the family was significant only among males.
In Table 5, we have illustrated the results by
calculating the total effects as well as the direct and
indirect effects of schooling on the 15D score. In
addition, we have also illustrated practically the
effects of the lifestyle variables. For the ordinal
variables (smoking and diet) the effects have been
calculated on the basis of normal scores in the
form of class means of the assumed normal vari-
able [29]. The indirect effects of schooling reflect
the effects of schoo ling on health via lifestyle
variables.
Among males, an increase of 5 years of school-
ing increases the health score by 0.008 (i.e.
increases health by about 1%), of which about
half is due to direct and half to indirect effects.
Among the females, the small total effect is due to
indirect effect. Among the males, the total effect of
change of diet from unhealthy to healthy had
about the same effect on health as an increase in
schooling of 5 years. Even greater health effects
can be obtained among the females by a similar
change in diet or by decreasing alcohol consump-
tion by 16 g (about 1–1.5 bottle of beer) per day.
In general, although most changes are statisti-
cally significant, their practical importance is not
Table 4. Total effects of exogenous variables on health
Males Females
Parents background
Birth weight 0.002 –0.003
Mothers schooling 0.0001
**
0.00004
Fathers socio-economic class 1 0.0003 –0.0019
**
Fathers socio-economic class 2 –0.0003 0.0003
Father living in the family 0.0007
*
–0.0003
Living at rural area 0.0008 0.0006
Health and behaviour at
14 years old
Smoking at 14 years old –0.003
**
–0.0003
Alcohol drinking at 14 years
old
–0.003
*
–0.001
Exercise at 14 years old 0.0003
**
0.0001
Average grade in all subjects
at school
0.003
***
0.0007
Repeated years at school at
14 years old
–0.0008 –0.001
Occurrence of mild illness of
long duration
–0.007
*
–0.008
**
Occurrence of severe illness of
long duration
–0.012
***
–0.009
**
Number of illness days during
the year
–0.0009 –0.0013
**
Exogenous variables at 31 years
old
Unemployment –0.01
**
0.0002
Total years of unemployment –0.0001 –0.002
*
Student –0.033
***
–0.006
Number of children in family –0.0004
*
0.001
***
Number of adults in family 0.001
***
0.0004
*
p50.05,
**
p50.01,
***
p50.001.
Table 5. Total direct and indirect effect of education and lifestyle variables on health
Males Females
Total Direct Indirect Total Direct Indirect
Schooling (increase in 5 years of schooling) 0.008
***
0.004 0.004
***
0.002 0.000 0.002
***
Smoking (change of smoking habits from no
smoking to regular daily smoking)
–0.004
*
–0.004
*
– 0.003 0.003 –
Alcohol consumption (increase in consumption
by 16 g (one bottle of beer) per day)
–0.004
***
–0.004
***
– –0.014
***
–0.014
***
–
Exercise (increase in training by 1 h/week) 0.003
***
0.003
***
– 0.001
*
0.001
*
–
Diet (change of diet from healthy to unhealthy
(from score 0–1 to score 4–5))
–0.009
**
–0.009
**
– –0.015
***
–0.015
***
–
*
p50.05,
**
p50.01,
***
p50.001.
U. Ha
º
kkinen et al.
1210
Copyright # 2006 John Wiley & Sons, Ltd. Health Econ. 15: 1201–1216 (2006)
DOI: 10.1002/hec
high. A change of 0.02–0.03 in the score has been
observed to be such that people can feel the
difference [14]. We found such effects only in
variables describing student status (among males)
and alcohol consumption (change of over 24 g/day
among females).
Table 6 describes the estimation results of those
separate dimensions of 15D for which we got signi-
ficant effects for schooling and lifestyle variables.
In most cases, the same model developed for the
overall index score also fitted the data, in terms of
chi-square statistics, for the dimensions evaluated.
Only in the models for sleeping (both genders), as
well as breathing, elimination, menta l functioning
and depression (among females) did we make
modest modifications to the original model in
order to get a satisfactory goodness- of-fit.
According to dimension-specific analysis among
males, the total effects of schooling were positive
and significant in breathing, usual activities, mental
functioning, and discomfort and symptoms. Only
in elimination did we find any significant negative
effect of schooling on health. In usual activities and
mental functioning, the positive total effect of
schooling was due to a direct effect, but in
breathing, discomfort and symptoms there was
also a significant indirect effect. In sleeping, elimi-
nation, depression, distress and vitality the indirect
effect of schooling was positive and significant,
but not so great that it resulted in a significant
total effect. Among the dimensions, the mean score
was lowest in discomfort and symptoms and was
under 0.95 also in sleeping, distress and vitality, i.e.
in dimensions where indirect effects are very signi-
ficant (Figure 1). Thus we can assume that any
positive indirect effects of schooling on the total
15D score are mainly due to these effects.
Among males, the negative effects of smoking
on health (total 15D) seem to be due to negative
effects in four dimensions (breathing, sleeping
usual activities, and vitality), ne gative effects of
alcohol consumption in six (breathing, sleeping,
elimination, depression, distress, and vitality)
and unhealthy diet in four dimensions (sleeping,
discomfort and symptoms, depression, and vital-
ity), whereas the positive effect of exercise was due
to effects found in seven dimensions (breathing,
elimination, mental functioning, discomforts and
symptoms, depression, distress and vitality).
Among the females, the total effect of schooling
was positive only for mental functioning, which
was also the only dimension in which we found an
indication of productive (dir ect) effect. The overall
positive ind irect effect of schooling on the total
15D can be explained by the corresponding
indirect effect of breathing, sleeping, discomfort
and symptoms, depression, distress and vitality.
Among females, the observed ove rall rather
strong negative effect of alcohol consumption
on health seems to be explained by negative
effects of alcohol in eight dimensions (breathing,
sleeping, usual activities, mental functioning,
discomfort and symptoms, depression, distress
and vitality). Exercise has a positive effect in two
(mental functioning, and vitality) and unhealthy
diet has a negative effect in six dimensions (breath-
ing, sleeping, discomfort and symptoms, depres-
sion, distress and vitality). Among the females,
smoking was not related to the total score (15D).
We find a negative significant effect of smoking
only in breathing. However, rather unexpected
results are the positive effects of smoking to usual
activities and mental functio ning.
Conclusions
In this study, we have analysed the relationship
between schooling and health using longitudinal
data with a generic measure of health-related qua-
lity of life. As in earlier economic studies [8,10,11],
our results confirm significant effects of education
on health, but only among males.
But even among males, the effect was rather
modest. Among females, whose educational level
was higher, we could find no significant total
effects of schooling on health.
The richness of the data, the character of
the health variable and the methodological
approach allow us to distinguish between the
productive and allocative effects of education [8].
Our results concerning the importance of the allo-
cative effect among men disagree with the results
of the US study, where the productive effects were
clearly greater than the allocative effects. One
possible reason might be that the US study might
underestimate the allocative effects, since the
study is based on cross-sectional data and did
not include the effects of drinking and diet, which,
in our study were important lifestyle mediators.
Using our approach, it was also possible to des-
cribe in more detail the mechanism underlying the
causal relationships, as well as to find out the most
important dimensions of health on which educa-
tion and lifestyle had effects.
Health, Schooling and Lifestyle among Young Adults in Finland 1211
Copyright # 2006 John Wiley & Sons, Ltd. Health Econ. 15: 1201–1216 (2006)
DOI: 10.1002/hec
Table 6. Statistically significant effects of education and lifestyle variables on dimensions of 15D
Males Females
Total Direct Indirect Total Direct Indirect
Breathing
Schooling +++ +++ +++ +++
Smoking – – – – – – – –
Alcohol – – – – – – – –
Exercise ++ ++
Diet – – – – – –
Sleeping
Schooling +++ ++
Smoking – –
Alcohol – – – – – – – – – – – –
Diet – – – – – – – – – – – –
Elimination
Schooling – – – – +
Alcohol – –
Exercise + +
Usual activities
Schooling ++ ++
Smoking – – + +
Alcohol – – – – – –
Exercise
Mental functioning
Schooling ++ ++ + +
Smoking ++ ++
Alcohol – – – – – –
Exercise + + + +
Discomfort and symptoms
Schooling + + ++ +
Alcohol – – – – – –
Exercise + +
Diet – – – – – – – –
Depression
Schooling +++ +++
Alcohol – – – – – – – – – – – –
Exercise + +
Diet – – – – – – – –
Distress
Schooling +++ +++
Alcohol – – – – – – – – – – – –
Exercise + +
Diet – – – – – –
Vitality
Schooling +++ +++
Smoking – –
Alcohol – – – – – – – –
Exercise +++ +++ + +
Diet – – – – – – – – – – – –
+, positive and significant effect (p50.05); ++, positive and significant effect (p50.01); +++, positive and significant effect
(p50.001); –, negative and significant effect (p50.05); – –, negative and significant effect (p50.01); – – –, negative and significant
effect (p50.001).
U. Ha
º
kkinen et al.
1212
Copyright # 2006 John Wiley & Sons, Ltd. Health Econ. 15: 1201–1216 (2006)
DOI: 10.1002/hec
Theoretically, our health measure (15D) defines
literally billions of mutually exclusive health
states, thus having a great potential for discrimi-
natory power and responsiveness to small changes.
We find many statistically significant although
not always clinically important effects. The latter
can be due to the fact that the analysis is based on
a sample that is relatively healthy, also indicating
that effects are rather small when used in
comparisons with health c are interventions [14]. On
the other hand, results can be seen also as an
indication that 15D and some of its dimensions are
very sensitive even in a relatively healthy population.
Although the data and measures of health status
were better than those available in many other
studies, there are still factors that should be taken
into account when considering the results. Firstly,
as usual in a longitudinal study with a long follow-
up, the number of missing cases was significant.
The analysis of non-responses indicated that
persons with a lower level of education clearly
have a greater possibility of being excluded from
the sample. It can be assumed that these persons
also have low er health status than those included.
One could argue that our results possibly under-
estimate the effect of schooling on health.
Secondly, the fact that the study includes a
cohort from Northern Finland may create some
caveats in generalising the results. For exampl e,
cultural and religious factors in Northern Finland
differ from those of the rest of the country, which
may affect the role and effects of lifestyle variables
in health production. However, according to a
recent study among Finnish adolescents, the
regional differences in health behaviour reflect
more socio-economic variation than cultural fac-
tors [31]. For example, adolescents’ smoking and
physical activity were determined merely by
individual characteristics, and of those behaviours
(drinking and diet) that where influenced by socio-
economic context (i.e. cultural factors), the rela-
tionship was more moderate than that between
individual characteristics and health behaviour
[32]. In addition, a consider able part of the cohort
has moved from Northern Finland, which also
reduces the effects of cultural factors.
Thirdly, our health production function does
not include health care utilisation, which may
result in some biased effects of schooling and
health behaviour on health. However, health care
utilisation is rather modest among young adults.
According to Finnish studies (e.g. [33]), the use of
health care among children as well as young adults
is not significantly related to education. Thus, we
can assume that the effect of omitting the use
of health care from the health production function
is not very important for studying the relation
between health and education.
Fourthly, concerning the estimated effects of
lifestyle variables on health, one should take into
account that their negative health effects will
appear at later stages of life. This might be a
reason that we do not find much negative effects of
smoking on health. The reverse might hold for the
use of alcohol since the positive effects of moderate
drinking have been indicated to reduce cardio-
vascular disease, which usually emerges in later
stages of life. However, in this study, we find
among both genders very clear and significant
effects of schooling on diet, smoking and alcohol
consumption. Since these habits usually begin
early in life, it is possible that our results under-
estimate the allocative effects of schooling on
health which will be realised in later stages of life.
Many epidemiological studies have demon-
strated a strong, negative association between
education and health status as measured by morta-
lity or morbidity. For example, a Dutch long-
itudinal study of men found an inverse relation
between education level and mortality even after
confounding effects of height and health score
were taken into account [34]. When lifestyle
variables were included in the analysis, the results
suggest that the higher prevalence of major risk
factors among those with a lower educational level
is not the dominant mediating mechanism that can
explain educational disparities in health status [35].
More generally, lifestyle variables usually explain a
rather modest proportion of the socio-economic
gradient in mortality or morbidity. Contoy annis
and Jones [9] indicated that the failure of epi-
demiological analyses to account for unobserved
heterogeneity could explain their low estimates of
the relevance of lifestyle in the relationship
between socio- economic status and health. In our
study, we found that among males, the indirect
effect of schooling was statistically significant and
explained about 50% of the total effect. Among
the females, we find only significant indirect effect.
Our results indicate that policy options that
increase education among men will increase their
health indirectly via healthier lifestyles. However,
since the total effect was rather modest and
the direct effect insignificant, efforts at increasing
the general level of schooling to promote health
may be no longer cost-eff ective compared to more
Health, Schooling and Lifestyle among Young Adults in Finland 1213
Copyright # 2006 John Wiley & Sons, Ltd. Health Econ. 15: 1201–1216 (2006)
DOI: 10.1002/hec
specific health education in Finland. A better
alternative will be paying more attention to acti-
vities promoting directly healthy lifestyles. Among
females our results did not give any support to
increasing the years of schooling and indicates
the importance of drinking behaviour as a target
for health promotion in Finland.
The results of studies made in other countries
have been interpreted to indicate direct causality
between more schooling and better health [1,3,4].
Our results from Finland give support to the
conclusion made by Auld and Sidhu [5] that an
increase in schooling does not directly cause
better health on average for young individuals.
The young adults’ and particularly female’s inter-
nationally high educational status in Finland
might be a reason why we find only a modest
effect of schooling on health and the non-existence
of such effects among females. However, since
education still strongly affects health behaviour,
one can argue that a high education status as such
does not guarantee the socio-economic equity in
health which has been the main target of health
policy during recent decades in Finland.
Acknowledgements
We are grateful to two anonymous referees and Harri
Sintonen for valuable comments.
Notes
a. Muurinen [19] refers to this concept as use-related
deprecation.
b. Based on referees suggestion, we included birth
weight into the models, although the variable was
not statistically significant.
Appen dix A: Descriptio n of data used
and analysi s o f no nres pon se rate
Table A1 describes original data and the data used
in this study. As usual in a long-lasting panel
study, attrition is significant. As can be seen from
the table, there are many sources for nonresponse.
Using data collected from the education register,
it was possible to analyse the determinants of
nonresponse. From the register, we got informa-
tion on 9699 (4844 males and 4855 females)
original cohort persons of which we also had data
collected at 14 years of age. Nonresponse was
higher, among the males (59%) than among the
females (52%). A logit regression using parents’
background variables as well as health and beha-
viour variables at 14 years (see Table 1) indicated
that the probability of being included in our
sample was, among males, strongly related to
schooling (+) and also statistically significantly
to occurrence of severe illness (À), smoking at
Table A1. Original data and sources of attrition
Number of cases
Total original cohort 12 058 (12 231, all births)
Alive in 1997 11 877
Postal questionnaire in 1997
Respondents to which the postal questionnaire was sent 11 541
Returned questionnaires 8764
Clinical examination 1997 (those living in provinces of Oulu,
Lapland and Capital area of Finland)
Invited 8463
Participated 6066
Cases with completed 15D 5606
Middle of Finland (other than Oulu, Lapland and Capital area)
postal questionnaire of 15D 1997
Cases sent 2000
Cases with completed 15D 1381
Total number of cases with completed 15D 6987
Total number of cases included in this study (after deletion of
cases with missing data on all variables)
4343
U. Ha
º
kkinen et al.1214
Copyright # 2006 John Wiley & Sons, Ltd. Health Econ. 15: 1201–1216 (2006)
DOI: 10.1002/hec
14 years old (À), average grade (+), repeated
years of schooling (À) and living in a rural area
(+). Among females, the probability was also
related strongly to schooling (+), and statistically
significantly also to average grade (+), repeated
schooling (À), and to the variable describing
whether the father lived in the family (+).
The nonresponse rate was studied also by logit
regression, while including both genders in the
data, producing a significant dummy variable for
gender (indicating higher nonresponse among
males). We also compared the logit models for
attrition between the genders with a Chow-type
test, which indicated significant differences bet-
ween the genders. A dummy variable test illu-
strated statistically significant differences in effects
between the genders in four variables (smoking at
14 years, occurrence of severe illness, livin g at
rural areas and fathers socio-economic class being
2 at 14 years old).
Referen ces
1. Grossman M, Kaestner R. Effects of education on
health. In The Social Benefits of Education, Behrman
JR, Stacey N (eds). University of Michigan Press:
Ann Arbor, 1997; 69–123.
2. Grossman M. The human capital model. In Hand-
book of Health Economics, vol. 1A, Culyer AJ,
Newhouse JP (eds). Elsevier: Amsterdam, 2000;
348–408.
3. Grossman M. The demand for health, 30 years later:
a very personal retrospective and prospective reflec-
tion. J Health Econ 2004; 23(4): 629–636.
4. Grossman M. Education and nonmarket outcomes.
NBER Working Paper series. Working Paper 11582,
Cambridge, 2005.
5. Auld MC, Sidhu N. Schooling, cognitive ability,
and health. Health Econ 2005; 12(10): 1019–1034.
6. OECD. Education at Glance, OECD Indicators 1977.
OECD: Paris, 1997.
7. Leigh PJ. Direct and direct effects of education on
health. Soc Sci Med 1983; 17(4): 227–234.
8. Gillesekie DB, Harrison AL. The effects of endo-
genous health inputs on the relationship between
health and education. Econ Educ 1998; 17(3):
279–297.
9. Contoyannis P, Jones A. Socio-economic status,
health and lifestyle. J Health Econ 2004; 23:
965–995.
10. Berger M, Leigh P. Schooling, self-selection, and
health. J Human Res 1988; 24: 343–455.
11. Kenkel DS. Should you eat your breakfast. Health
Econ 1995; 4(1): 15–29.
12. Sintonen H. The 15D Measure of Health Related
Quality of Life: Reliability, Validity and Sensitivity
of its Health State Descriptive System. National
Centre for Health Program Evaluation: Melbourne,
1994.
13. Sintonen H. The 15D-Measure of Health Related
Quality of Life. II Feasibility, Reliability and Validity
of its Valuation system. National Centre for Health
Program Evaluation: Melbourne, 1995.
14. Sintonen H. The 15D instrument of health-related
quality of life: properties and applications. Ann Med
2001; 33: 328–336.
15. Stavem K. Reliability, validity and responsiveness
of two multiattribute utility measures in patients
with chronic obstructive pulmonary disease. Qual
Life Res 1999; 8: 45–54.
16. Hawthorne G, Richardson J, Day NA. A compar-
ison of the assessment of quality of life (AQoL) with
four others generic utility instruments. Ann Med
2001; 33: 358–370.
17. Lauridsen J, Christiansen T, Ha
¨
kkinen U. Measur-
ing inequality in self-reported health – discussion of
a recently suggested approach using Finnish data.
Health Econ 2004; 13(7): 725–732.
18. Grossman M. The Demand for Health: aTheoretical
and Empirical Investigation. NBER: New York, 1972.
19. Muurinen J-M. Demand for health: a generalised
Grossman model. J Health Econ 1982: 1: 5–28.
20. Rosenzweig MR, Schultz PT. The behaviour
mothers as inputs to child health: the determinants
of births weight, gestation, and rate of fetal growth.
In Economic Aspects of Health, Fuchs V (ed.).
University Chicago Press: Chicago, 1982; 53–92.
21. Kemna H. Working conditions and the relationship
between schooling and health. J Health Econ 1987;
6: 189–210.
22. van Doorslaer E. Health, Knowledge and the
Demand for Medical Care. Van Corcum&Comp:
Assen, 1987.
23. Jo
¨
reskog K, So
¨
rbom D. Lisrel 8. User’s Reference
Guide. Scientific Software International: Chicago,
1996.
24. Rantakallio P. Groups at risk in low birth weight
infants and prenatal mortality. Acta Paediatr Scand
1969; 193: 1–71.
25. Laitinen J, Power C, Ja
¨
rvelin M. Family social class,
maternal body mass index, childhood body mass
index, and age at menarche as predictors of adult
obesity. Am J Clin Nutr 2001; 74: 287–294.
26. National Public Health Institute. Finravinto 1997
(the 1997 dietary survey of Finland). Helsinki, 1998.
27. Helakorpi S, Uutela A, Puska P. Suomalaisten
aikuisva
¨
esto
¨
n terveyska
¨
ytta
¨
ytyminen, keva
¨
t 1997
(Health Behaviour Among Finnish Adult Population,
Spring 1997). National Public Health Institute:
Helsinki, 1997.
28. Laitinen J, Pietilainen K, Wadsworth M, Sovio U,
Ja
¨
rvelin M. Predictors of abdominal obesity among
Health, Schooling and Lifestyle among Young Adults in Finland 1215
Copyright # 2006 John Wiley & Sons, Ltd. Health Econ. 15: 1201–1216 (2006)
DOI: 10.1002/hec
31-y-old men and women born in Northern Finland
in 1966. Eur J Clin Nutr 2004; 58( 1): 180–190.
29. Jo
¨
reskog K, So
¨
rbom D. Prelis 2: User’s Reference
Guide. Scientific Software International: Lincon-
wood, 1999.
30. Hendry DF. Dynamic Econometrics. Oxford Uni-
versity Press Oxford, 1995.
31. Karvonen S. The Regional Context of Health
Behaviour among Finnish adolescents. Jyva
¨
skyla
¨
:
Stakes, Research Reports 76, 1997.
32. Karvonen S, Rimpela
¨
A. Socio-regional context as a
determinant of adsolescents’ health behaviour in
Finland. Soc Sci Med 1996; 43(10): 1467–1474.
33. Ha
¨
kkinen U. Change in determinants of use
of physician services in Finland between
1987 and 1996. Soc Sci Med 2002; 55: 1523–
1537.
34. Doornbos G, Kromhout D. Educational level and
mortality in a 32-year follow-up study of 18-year old
men in the Netherlands. Int J Epidemiol 1990; 19(2):
374–379.
35. Lanz PM, Lynch JW, House JS et al. Socio-
economic disparities in the health change in
a longitudinal study of US adults: the role of
health-risk behaviours. Soc Sci Med 2001: 56(1):
29–40.
U. Ha
º
kkinen et al.1216
Copyright # 2006 John Wiley & Sons, Ltd. Health Econ. 15: 1201–1216 (2006)
DOI: 10.1002/hec