Báo cáo khoa học: Intrinsic local disorder and a network of charge–charge interactions are key to actinoporin membrane disruption and cytotoxicity ppt
Bạn đang xem bản rút gọn của tài liệu. Xem và tải ngay bản đầy đủ của tài liệu tại đây (768.94 KB, 10 trang )
Intrinsic local disorder and a network of charge–charge
interactions are key to actinoporin membrane disruption
and cytotoxicity
Miguel A. Pardo-Cea
1,
*, Ine
´
s Castrillo
1,
*, Jorge Alegre-Cebollada
2,
,A
´
lvaro Martı
´
nez-del-Pozo
2
,
Jose
´
G. Gavilanes
2
and Marta Bruix
1
1 Departamento de Quı
´
mica Fı
´
sica Biolo
´
gica, Instituto de Quı
´
mica Fı
´
sica Rocasolano, Madrid, Spain
2 Departamento de Bioquı
´
mica y Biologı
´
a Molecular I, Facultad de Quı
´
mica, Universidad Complutense, Madrid, Spain
Introduction
Actinoporins are very potent cytolysins secreted as
part of the venom of a large number of sea anemones
[1]. These proteins are produced as water-soluble
monomers that form oligomeric pores upon interaction
with membranes [2–5]. Sticholysin II (StnII) is an acti-
noporin isolated from the Caribbean species Stichodac-
tyla helianthus. The three-dimensional structure of the
soluble form of StnII [6], as well as that of its relative
Equinatoxin II from Actinia equina [7,8], have been
solved. Both proteins share the same global tertiary
structure composed of a b-barrel flanked by two short
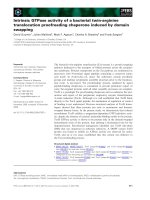
a-helices, one at each side (Fig. 1). Studies performed
in recent years have made it possible to propose a
model for the interaction of these proteins with cellular
Keywords
actinoporin; dynamics; electrostatic
interactions; NMR structure; sticholysin
Correspondence
M. Bruix, Departamento de Quı
´
mica Fı
´
sica
Biolo
´
gica, Instituto de Quı
´
mica Fı
´
sica
Rocasolano, CSIC, Serrano 119, 28006
Madrid, Spain
Fax: +34 91 561 9400
Tel: +34 91 745 9511
E-mail:
*These two authors contributed equally to
this work
Present address
Department of Biological Sciences,
Columbia University, New York, USA
(Received 1 February 2011, revised 10
March 2011, accepted 1 April 2011)
doi:10.1111/j.1742-4658.2011.08123.x
Actinoporins are a family of sea anemone proteins that bind to membranes
and produce functional pores which result in cell lysis. Actinoporin vari-
ants with decreased lytic activity usually show a reduced affinity for mem-
branes. However, for some of these mutant versions there is no direct
correlation between the loss of binding affinity and the decrease in their
overall lytic activity, suggesting that other steps in pore formation may be
hampered or facilitated by the mutations. To test this hypothesis on the
mechanism of pore formation by this interesting family of proteins, struc-
tural and dynamic NMR studies have been carried out on two disabled
variants of the actinoporin Sticholysin II, R29Q and Y111N. It is shown
that their lytic activity is not only related to their membrane affinity but
also to their conformational mechanism for membrane insertion. Altera-
tions in their activities can be explained by structural, electrostatic and
dynamic differences in a cluster of aromatic moieties and the N-terminus.
In addition, the dynamic properties of some segments located at the C-ter-
minus of the R29Q variant suggest a relevant role for this region in terms
of protein–protein interactions. On the basis of all these results, we propose
that R29 anchors a network of electrostatic interactions crucial for the acti-
noporin’s approach to the membrane and that Y111 induces a necessary
disorder in the loop regions that bind to membranes.
Abbreviations
POC, phosphocholine; StnII, Sticholysin II.
2080 FEBS Journal 278 (2011) 2080–2089 ª 2011 The Authors Journal compilation ª 2011 FEBS
membranes [9–11] including the pore formation mecha-
nism [3,12–14]. First, a cluster of aromatic residues
and a phosphocholine (POC) binding site, together
with some positively charged side chains, would be
responsible for the initial attachment to the membrane.
Then, the N-terminal region would extend the a-helix
and penetrate into the membrane, forming the pore.
However, the molecular bases directing these processes
are still largely unknown. In this regard, mutagenesis
studies have proved to be very useful to detect the
implication of certain regions of StnII in the different
steps involved in the formation of the pore [15,16]. In
particular, calorimetric and other structural and spec-
troscopic studies on StnII suggested that residues at
positions 29 (Arg) and 111 (Tyr), which are 100% con-
served in the actinoporins family [17,18], have an
important functional role in membrane binding [16].
R29 is located in the protein segment that is supposed
to rotate in the first steps of pore formation. Addition-
ally, R29 belongs to one cluster of cationic residues
that has been postulated as an important motif due to
its situation between the N-terminus and the other
binding regions of StnII. Also, Y111 is crucial for
membrane binding as it is located at the POC binding
site.
It was shown previously [16] that the two mutations
R29Q and Y111N have an identical effect on mem-
brane binding: they lower it to 13% of that of the
wild-type protein. Although the lytic activity is much
reduced for both variants, it is particularly small for
the Y111N. In fact, the lytic activity is five times lower
for Y111N than for R29Q. Taken together, on the
basis of these previously reported data, we now
hypothesize that actinoporins act in at least two stages:
(a) an initial approach to and binding of the mem-
brane; (b) oligomerization, pore formation and lysis.
We also hypothesize that R29 and Y111 contribute
distinctly to the second stage.
In this work, NMR spectroscopy has been used to
determine the solution structure and dynamics of the
StnII-R29Q and StnII-Y111N variants. Structurally,
both substitutions are moderately conservative. The
glutamine side chain, despite its lack of positive
charge, maintains the polar character and the possibil-
ity of donating H-bonds. In the Y111N variant, the
aromatic ring is replaced by a group which is also
structurally planar and able to accept and donate
H-bonds. In this context, our data indicate that the
positive surface together with a network of electrostatic
interactions, and the presence of flexibility in the loops
in close contact with the membranes, can play critical
roles in the overall toxic mechanism of StnII. These
results are relevant not only for the characterization of
the molecular interactions of StnII with the membrane
at residue level, but also to better understand the
cytotoxic mechanism of this family of proteins.
Results
Global fold of StnII-R29Q and StnII-Y111N
mutants
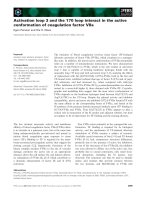
Figure 2 shows the three-dimensional structure of the
two mutants in solution determined on the basis of the
NMR restraints summarized in Tab le 1. The resulting
structures satisfy the experimental constraints with
small deviations from the idealized covalent geometry
and most of the backbone torsion angles lie within the
allowed regions in the Ramachandran plot. The global
averaged pairwise rmsd values of the calculated 20
structures for the backbone were larger for StnII-R29Q
(1.5 A
˚
) than for StnII-Y111N (0.8 A
˚
). However, when
only the regular secondary elements were considered
these values dropped to 0.7 and 0.6 A
˚
, respectively,
showing that these regions, which constitute the protein
core, are similarly well defined. The global fold closely
resembles that of wild-type StnII (Fig. 1) and the other
proteins belonging to the actinoporins family [6–9].
Structure and dynamic properties of StnII-R29Q
The secondary structure of StnII-R29Q is composed of
two a-helices (residues 14–22 and 128–135) and nine
R29
Y111
N
C
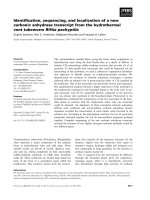
Fig. 1. Crystal structure of wild-type StnII. The thickness of the
backbone trace is proportional to the reported B-factors (pdb:1gwy).
The secondary structure elements and the side chains of R29 and
Y111 are shown. The figure was created with
MOLMOL [29].
M. A. Pardo-Cea et al. Structure of R29Q and Y111N StnII mutants
FEBS Journal 278 (2011) 2080–2089 ª 2011 The Authors Journal compilation ª 2011 FEBS 2081
b strands (33–38, 43–52, 67–71, 85–92, 96–102, 114–
121, 145–150, 156–161 and 169–174) arranged accord-
ing to the classical b-sheet actinoporin structural topol-
ogy (Figs 1–3). Structural variability was only
observed in segments corresponding to the loops con-
necting these regular secondary elements (Figs 2 and 3).
This is especially evident for loops 23–32 (Fig. 2,
cyan), 72–84 (Fig. 2, yellow), 103–113 (Fig. 2, green)
and 162–168 (Fig. 2, pink) which have higher than
average rmsd values. All these loops are topologically
located in the same region of the protein which also
corresponds to the membrane interaction face (Figs 2
and 4). In the wild-type structure, the side chain of
R29 interacts with K75, T82, F106 and E166; thus it
links together four different loops of the structure
(Fig. 5). Mutation of this arginine residue by the
shorter and neutral glutamine prevents the formation
of those contacts and the loops are far apart in the
R29Q mutant. As a consequence, F106 is more
exposed to the solvent and loop 72–84 is disordered
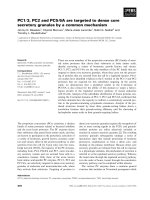
and adopts different conformations (Fig. 5). Further-
more, charge density on the side facing the membrane
is dramatically changed (Fig. 4).
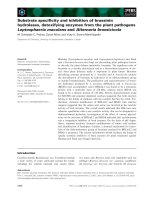
Finally, as
15
N NMR relaxation can be used to char-
acterize the dynamic properties of a protein in solu-
tion, relaxation data were obtained for 147 of the 175
residues present in StnII-R29Q. It is interesting that
signals from residues 29, 30, 106–107, 110–113 and
164–167 were not observable in the
15
N-HSQC spectra
because of excessive broadening, most probably due to
conformational exchange processes (Fig. 3). Good cor-
relations could be established between structure and
experimental relaxation data in that most residues in
regular secondary structure elements exhibited hetero-
nuclear NOE values close to the theoretical maximum,
indicating high rigidity in these regions. In contrast,
residues at the N- and C-termini, and in loop regions,
showed decreased longitudinal relaxation rates (R
1
),
variable transversal relaxation rates (R
2
) and low NOE
values, suggesting a much higher mobility on the
picoseconds time scale (Fig. 3).
Residues in loops exhibited decreased R
1
values indi-
cating higher flexibility, but the overall differences are
not significant (mean values 1.0 s
)1
). More variability
was clearly observed in the NOE and R
2
data, with
mean values of 0.8 and 17.6 s
)1
, respectively. Low R
2
values correlate with a decrease in the NOE ratio in
loop 23–32, the first residues of loop 72–84 and posi-
tion 111 (Fig. 3). However, other regions of StnII-
R29Q with low or average NOE values present higher
R
2
values with respect to the mean. These correspond
to residues 82–84 and 104 in the membrane interaction
face and segments 140–147 and 159–163 towards the
end of the protein sequence (Fig. 3), indicating that
these residues are affected by conformational exchange
processes.
Structure and dynamic properties of StnII-Y111N
The secondary structure for variant Y111N is also well
defined with two a-helices (residues 14–24 and 129–
135) and nine b strands (30–37, 43–52, 67–74, 84–91,
N
180º
N
C
α
2
α
2
β
1
α
1
α
1
β
1
C
A
B
C
Fig. 2. Solution structure of the StnII-R29Q and StnII-Y111N
mutants. The ensemble of the 20 final structures of StnII-R29Q (A)
and StnII-Y111N (B) are shown as cross-eyed stereo diagrams with
the mutated face pointing down. Loops corresponding to this face
are represented in different colours: StnII-R29Q 23–32, cyan;
72–84, yellow; 103–113, green; 162–168, pink; StnII-Y11N 25–29,
cyan; 75–83, yellow; 105–113, green; 161–167, pink. Two views
rotated 180° of the ribbon diagram of the minimal energy structure
of StnII-Y111N are shown in (C). The orientation of the structures
in (A) and (B) is the same as in the left panel of (C). Some interest-
ing regions and secondary structure units are indicated in (C).
These figures were produced using
MOLMOL [29].
Structure of R29Q and Y111N StnII mutants M. A. Pardo-Cea et al.
2082 FEBS Journal 278 (2011) 2080–2089 ª 2011 The Authors Journal compilation ª 2011 FEBS
97–104, 114–120, 147–148, 156–160 and 168–174)
arranged in a b-barrel like those in the wild-type
protein and StnII-R29Q mutant (Figs 1 and 2). In
addition, the structure of StnII-Y111N shows two
additional short b-strands (residues 5–8, 62–64) and a
3–10-helix (residues 9–11). Compared with wild-type
StnII, a new hydrogen bond is detected between side
chains of N111 and D107.
The substitution of Y111 for N provokes conforma-
tional changes in the surrounding structure (Fig. 6A).
Fig. 3. Backbone NMR heteronuclear R
1
and R
2
relaxation rates and heteronuclear
NOE data for StnII-R29Q as a function of
the sequence (800 MHz, 25 °C and pH 4.0).
The horizontal line represents the mean
value and red crosses at positions 29, 30,
106–107, 110–113 and 164–167 represent
missing NMR signals in the
15
N-HSQC spec-
trum because of excessive broadening.
Table 1. NMR structural calculations summary and statistics.
StnII-R29Q StnII-Y111N
Calculation
Distance restraints 2195 1450
Angular restraints 178 254
Max violation (A
˚
) 0.4 0.2
CYANA (20 structures)
Energy function (mean value) 0.94 ± 0.42 0.67 ± 0.14
AMBER (20 structures)
Total energy (kcalÆmol
)1
) )5640 ()5718 to )5529) )6015 ()6089 to )5930)
van der Waals (kcalÆmol
)1
) )1194 ()1231 to )1145) )1298 ()1330 to )1266)
Electrostatic (kcalÆmol
)1
) )11481 ()12346 to )10420) )11161 ()11967 to )10409)
rmsd (A
˚
)
All residues (backbone, heavy atoms) 1.5 ± 0.2 2.4 ± 0.2 0.8 ± 0.1 1.4 ± 0.1
Secondary (backbone, heavy atoms) 0.7 ± 0.1 1.4 ± 0.2 0.6 ± 0.1 1.3 ± 0.1
Ramachandran plot
Most favoured (%) 73.9 79.1
Allowed (%) 24 19.3
Add. allowed (%) 1.5 1.4
Disallowed (%) 0.5 0.2
M. A. Pardo-Cea et al. Structure of R29Q and Y111N StnII mutants
FEBS Journal 278 (2011) 2080–2089 ª 2011 The Authors Journal compilation ª 2011 FEBS 2083
In particular, Y108 adopts a different conformation
(Fig. 6B). Interestingly, helix-a
2
is slightly shifted while
loops connecting it with the central b-barrel (121–128
and 136–146) are also structurally affected (Figs 1 and
6B). In addition, loops 25–29 and 75–83 adopt confor-
mations that are slightly different from those found in
wild-type StnII. Finally, the conformation of K26 side
chain changes; it moves close to E166 and establishes
a new electrostatic interaction not present in the parent
protein. This interaction could cause the slightly differ-
ent position of the above mentioned helix-a
2
and
nearby areas (Fig. 6A).
Relaxation data were obtained for 153 residues in
StnII-Y111N. The profiles with respect to the sequence
number are plotted in Fig. 7. The mean values
obtained after the analysis are the following: R
1
1.1 s
)1
, R
2
14.3 s
)1
and NOE 0.8. Low R
2
and NOE
values are observed for the regions 24–28, 76–83, 122–
126 and 137–140 showing a higher mobility on the
picosecond–nanosecond time scale. In contrast, the
region near the mutated residue, 104–110, shows high
R
2
values, suggesting a conformational exchange pro-
cess on the microsecond–millisecond time scale.
Diffusion properties of StnII mutants studied by
analytical ultracentrifugation
At the concentrations (0.50 mm) of StnII-R29Q and
StnII-Y111N (molecular masses 19 255 and 19 223 Da,
respectively) employed for NMR spectroscopy, the
data obtained from equilibrium sedimentation are best
fitted by a monomer M dimer equilibrium. The appa-
rent molecular masses are 29 600 Da for the
StnII-R29Q variant and 24 880 Da for the StnII-Y111N
variant. These data clearly indicate that under condi-
tions used for the NMR relaxation and structural
studies these proteins, especially StnII-R29Q, show
some tendency to associate. A similar situation has been
demonstrated previously for the wild-type protein [19].
Discussion
The three-dimensional data presented here agree with
those previously reported on the basis of far UV-CD
E166
K75
R29
F106
T82
E166
F106
T82
K75
Q29
A
B
Fig. 5. Comparison of the loop regions located in the mutation face
for the X-ray structure of wild-type StnII (A) and for the minimal
energy structure of the StnII-R29Q mutant (B). Side chains of resi-
dues R ⁄ Q29 in loop 23–32 are in blue, K75 and T82 in loop 72–84
are in orange, F106 in loop 103–113 are in green and E166 in loop
162–168 are in red. These figures were produced with
PYMOL [30].
D
AB
C
Fig. 4. Diagram showing the membrane interaction face of StnII (A)
and its electrostatic distribution surface potential for the wild-type
protein (B) and the StnII-R29Q (C) and StnII-Y111N (D) variants. Blue
and red correspond to positively and negatively charged areas,
respectively. The side chains of R29 and Y111 are shown in (A).
Structure of R29Q and Y111N StnII mutants M. A. Pardo-Cea et al.
2084 FEBS Journal 278 (2011) 2080–2089 ª 2011 The Authors Journal compilation ª 2011 FEBS
and IR data, showing that mutations at positions 29
and 111 do not alter the overall fold of StnII [16].
Despite the conservation of the tertiary structure and
tendency to form quaternary structure, both
StnII-R29Q and wild-type StnII-Y111N mutants have
a highly diminished lytic activity in comparison with
wild-type StnII. This decrease has been related to their
low association constant for membranes [16]. However,
the decrease in membrane bindings is identical,
whereas the lytic activity is five times lower for StnII-
Y111N than for StnII-R29Q. This significant differ-
ence led us to propose different roles in membrane
lysis for Y111 and R29. The roles are revealed by the
high resolution NMR studies of the structure and
dynamics of these variants reported here.
The structural results presented now confirm the
strategic location of R29. Its substitution by glutamine
affects not only the structure and dynamics of its local
environment and the four nearby loops but also the
conformation of sequence stretches located near the
C-terminus of the molecule. All these loops and
stretches are distant along the sequence (Figs 2, 3 and
5). The NMR relaxation data show very clearly that
these regions are highly dynamic in both the nanosec-
ond–picosecond and millisecond–microsecond time
scales (Fig. 3). Therefore, the decreased membrane
binding observed for this variant could be related to
the increased conformational freedom of these regions.
Moreover, the distribution of the electrostatic potential
along the surface of the protein face involved in recog-
nizing the membrane changes significantly (Fig. 4). A
dramatic loss of positive potential could affect interac-
tions with the negatively charged phosphate groups
from the phospholipid heads at the membrane surface.
In this regard, it seems clear that changes on the
protein surface could play a key role in targeting these
proteins to the membranes as the electrostatic interac-
tions are effective at long range. In addition, the loss
of interactions due to the R29Q substitution endows
Fig. 7. Backbone heteronuclear R
1
and R
2
relaxation rates and NMR NOE relaxation
data for StnII-Y111N (800 MHz, 25 °C and
pH 4.0). The horizontal line represents the
mean value.
E166
E166
Y108
A
POC binding
site
B
K26
K26
Y108
Fig. 6. Ribbon representation of the superposition of the backbone
atoms of the wild-type StnII (green) and the StnII-Y111N (blue) for
the N-terminal region (A) and for the membrane binding site (B).
Side chains of residues that change orientation upon mutation are
represented. These figures were produced using
MOLMOL [29].
M. A. Pardo-Cea et al. Structure of R29Q and Y111N StnII mutants
FEBS Journal 278 (2011) 2080–2089 ª 2011 The Authors Journal compilation ª 2011 FEBS 2085
the hinge region between helix-a
1
and the protein core
with a dynamic flexibility not found in StnII-Y111N
and most probably not present in wild-type StnII.
Unfortunately wild-type StnII has not yet been studied
by NMR methods and no relaxation data are avail-
able. However, according to the B-factors reported in
its X-ray structure (Fig. 1) [6], this region does not
show signs of important flexibility. The flexibility
observed in StnII-R29Q could facilitate detachment of
helix-a
1
in the mutant and explain why the R29Q
mutant has a lytic activity that, although low with
respect to StnII, is higher than what would be expected
from its weak affinity for membranes [16]. The loss of
interactions involving Arg29 when it is replaced by
Gln (Fig. 5) would then facilitate the movement of this
a-helix and the pore formation following the stage of
initial contact.
Regarding the Y111N mutant, it is evident that the
global structure and in particular the loop segments on
the interacting face are very well defined and lack
internal flexibility. This behaviour is in striking con-
trast to that observed in the R29Q mutant and the
wild-type protein. Probably the hydrogen bond found
in the structure of the Y111N mutant, between N111
and D107, plays an important role in rigidifying its
nearby loops. Thus, according to the StnII X-ray
structure and on the basis of the reported B-factors
[6], loop 105–113, which comprises part of the aro-
matic cluster and the POC binding site, is highly
dynamic in wild-type StnII (Fig. 1). In particular, the
B-factors of N109 and W110 are > 80, and no density
was reported for the side chain of this later amino
acid. The differences between StnII and its Y111N var-
iant clearly suggest that the Tyr at position 111, essen-
tial for membrane interaction, induces intrinsic local
disorder which seems to be key for function [20].
The structural changes compromise regions that are
important for membrane interaction (loop 105–113
and helix-a
2
and its surroundings) and insertion
(N-terminus end and loop 25–29), as described above.
Interestingly, the modifications in loop 25–29 (Fig. 2,
cyan), new electrostatic interactions supplied by the
K26 side chain (Fig. 6), and extension of strand-b
1
(Fig. 2C) probably contribute to rigidifying this region,
hampering the detachment of helix-a
1
. Therefore,
Y111N represents the opposite situation to R29Q. As
stated above, Y111N is less lytic than predicted from
its binding affinity [16]. Thus, the decrease in lytic
activity for Y111N-StnII can be explained by the addi-
tive effects of a decreased membrane affinity due to
lack of the necessary local flexibility together with the
long-range modifications observed along the N-termi-
nal region, which would hamper later stages for pore
formation subsequent to the initial contact with the
membrane.
Observation of the dynamic properties of StnII-
R29Q reveals the unexpectedly high R
2
values for the
regions comprising residues 140–147 and 159–163, not
located at the membrane interaction face. These
stretches partially overlap the b-hairpin composed by
b-strands 145–150 and 156–161 and they are rich in
hydrophobic and exposed residues. In particular, the
aromatic rings of Y140 and W146 have high accessible
surface area (30% and 35%, respectively). To date, no
specific function has yet been assigned to this region of
the actinoporin structure. Considering the results men-
tioned above, it is tempting to speculate that the con-
formational processes affecting these residues could be
involved in other types of molecular interactions apart
from those involving lipid binding and pore formation.
Accordingly, the hydrophobic moieties of these seg-
ments could contribute to oligomerization as detected
by the ultracentrifuge experiments.
In summary, the results reported here permit us to
corroborate and extend the model for actinoporin
membrane binding and lysis. In addition to confirming
roles for the hinge loop flexibility for helix-a
1
mem-
brane penetration, the results support the importance
of a network of electrostatic interactions, anchored by
R29, in the first stage of membrane binding. Y111
induces a necessary disorder in exposed hydrophobic
side chains that promotes their interaction with the
membrane.
Materials and methods
Expression and purification of StnII-R29Q and
StnII-Y111N mutants
The unlabelled StnII-R29Q and the double uniformly
labelled
13
C ⁄
15
N StnII-R29Q and
13
C ⁄
15
N StnII-Y111N
samples were produced using an Escherichia coli expression
system following a previously described protocol [21–23].
For the labelled forms, cells were grown in an M9 minimal
medium with
15
NH
4
Cl (1 gÆL
)1
) and
13
C
6
-glucose (4 gÆL
)1
)
as the sole nitrogen and carbon sources. Protein purifica-
tion was achieved by ion exchange chromatography on
CM52 equilibrated in 50 mm Tris ⁄ HCl, pH 6.8 for StnII-
R29Q or pH 7.8 for StnII-Y111N. The homogeneity of all
protein samples used was confirmed by SDS ⁄ PAGE and
amino acid analysis.
NMR sample preparation
Typically samples contained up to 0.5 mm of protein and
were prepared in both 90% H
2
O ⁄ 10% D
2
O and D
2
Oat
Structure of R29Q and Y111N StnII mutants M. A. Pardo-Cea et al.
2086 FEBS Journal 278 (2011) 2080–2089 ª 2011 The Authors Journal compilation ª 2011 FEBS
pH 4.0 (uncorrected for deuterium isotope effects). Sodium-
4,4-dimethyl-4-silapentane-1-sulfonate was used as internal
1
H chemical shift reference.
NMR structure calculation
All the NMR spectra were recorded in a Bruker AV-800
instrument equipped with cryoprobe and field gradients. All
data were acquired and processed with topspin (version
1.3) (Bruker, Rheinstetten, Germany) at 25 °C. Spectral
assignment was done using sets of standard two-dimen-
sional and three-dimensional experiments as reported previ-
ously [22,23]. Three-dimensional
15
N-NOESY-HSQC and
13
C-NOESY-HSQC spectra with 50 ms mixing times were
recorded for both proteins. In addition, two-dimensional
1
H-
1
H NOESY spectra with 80 ms mixing time in 90%
H
2
O ⁄ 10% D
2
O and D
2
O solutions were recorded with the
unlabelled StnII-R29Q sample. The spectral analysis was
performed with the program sparky (version 3.1) [24] on
the bases of the published assignments [22,23]. The struc-
ture calculation of the StnII-R29Q and StnII-Y111N vari-
ants was performed with cyana [25] using the automatic
NOE assignment facility combined with lists of manually
assigned NOEs. NOE intensities were calibrated with
cyana and used as upper distance limit constraints in the
calculations. Moreover, backbone dihedral angle con-
straints were determined from chemical shift values using
talos [26] and incorporated into the structure calculation
protocol. Initially, 100 conformers were generated that were
forced to satisfy the experimental data during a standard
automatic cyana protocol based on simulated annealing
using torsion angle dynamics. The 20 conformers with the
lowest final cyana target function values were selected and
subjected to 2000 steps of energy minimization using the
generalized Born continuum solvation model implemented
in amber9 [27] with a non-bonded cutoff of 10 A
˚
. The final
structure quality was checked with procheck-nmr [28].
The structures have no representative experimental distance
violations > 0.4 A
˚
or dihedral angle violations > 5°.
Coordinates for the final set of 20 structures have been
deposited in the Protein Data Bank database with accession
number 2KS3 for StnII-R29Q and 2L2B for StnII-Y111N.
The programs molmol [29] and pymol [30] were used for
molecular display and structure analysis.
NMR dynamics
All NMR relaxation experiments were carried out in the
same conditions as described above. Conventional
15
N het-
eronuclear relaxation rates R
1
, R
2
and NOE data were
determined (Fig. S1). To this end, a series of two-dimen-
sional heteronuclear correlated spectra using a sensitivity
enhanced gradient pulse scheme [31] were recorded. The
relaxation delay times were set as follows: for R
1
, 5, 50,
150, 300, 600, 800, 1000 and 1200 ms; and for R
2
, 15.6,
31.3, 46.8, 62.5, 78.2, 93, 109.4 and 125 ms. The relaxation
rate constants R
1
and R
2
were obtained from the exponen-
tial fits of the measured cross-peak intensities. The uncer-
tainty was taken as the error in the fit of the decay
function. For the NOE measurement, the experiments with
and without proton saturation were acquired simulta-
neously in an interleaved manner with a recycling delay of
5 s and were split during processing into separate spectra
for analysis. The values for the heteronuclear NOEs were
obtained from the ratio intensities of the resonances with
and without saturation. Here, the uncertainty was estimated
to be about 5%.
Analytical ultracentrifugation
Ultracentrifugation was performed on a Beckman-Coulter
Optima XL-1 analytical ultracentrifuge at 20 °C. The sam-
ple solutions were those used in NMR in water at pH 4.0.
Both equilibrium sedimentation and sedimentation velocity
(final velocity 24 000 r.p.m.) experiments were conducted.
The heteroanalysis program [32] was used to analyse the
results.
Acknowledgements
This work was supported by projects CTQ2008-
00080 ⁄ BQU and BFU2009-10185 from the Spanish
Ministerio de Ciencia e Innovacio
´
n. We thank Dr D.V.
Laurents for critical comments on the manuscript.
References
1 Macek P (1992) Polypeptide cytolytic toxins from sea
anemones (Actiniaria). FEMS Microbiol Immunol 5,
121–129.
2 Anderluh G & Macek P (2002) Cytolytic peptide and
protein toxins from sea anemones (Anthozoa: Actinia-
ria). Toxicon 40, 111–124.
3 Alegre-Cebollada J, On
˜
aderra M, Gavilanes JG &
Martı
´
nez-del-Pozo AM (2007) Sea anemone actinopo-
rins: the transition from a folded soluble state to a func-
tionally active membrane-bound oligomeric pore. Curr
Protein Pept Sci 8 , 558–572.
4 Anderluh G, Dalla Serra M, Viero G, Guella G, Macek
P & Menestrina G (2003) Pore formation by equinatox-
in II, a eukaryotic protein toxin, occurs by induction of
nonlamellar lipid structures. J Biol Chem 278, 45216–
45223.
5 Bakrac B & Anderluh G (2010) Molecular mechanism
of sphingomyelin-specific membrane binding and pore
formation by actinoporins. Adv Exp Med Biol 677,
106–115.
6 Manchen
˜
o JM, Martı
´
n-Benito J, Martı
´
nez-Ripoll M,
Gavilanes JG & Hermoso JA (2003) Crystal and
M. A. Pardo-Cea et al. Structure of R29Q and Y111N StnII mutants
FEBS Journal 278 (2011) 2080–2089 ª 2011 The Authors Journal compilation ª 2011 FEBS 2087
electron microscopy structures of sticholysin II actinop-
orin reveal insights into the mechanism of membrane
pore formation. Structure 11 , 1319–1328.
7 Athanasiadis A, Anderluh G, Macek P & Turk D
(2001) Crystal structure of the soluble form of equina-
toxin II, a pore-forming toxin from the sea anemone
Actinia equina. Structure 9, 341–346.
8 Hinds MG, Zhang W, Anderluh G, Hansen PE &
Norton RS (2002) Solution structure of the eukaryotic
pore-forming cytolysin equinatoxin II: implications for
pore formation. J Mol Biol 315 , 1219–1229.
9 Castrillo I, Araujo NA, Alegre-Cebollada J, Gavilanes
JG, Martı
´
nez-del-Pozo A & Bruix M (2010) Specific
interactions of sticholysin I with model membranes:
an NMR study. Proteins 78, 1959–1970.
10 Anderluh G, Razpotnik A, Podlesek Z, Macek P,
Separovic F & Norton RS (2005) Interaction of the
eukaryotic pore-forming cytolysin equinatoxin II with
model membranes: 19F NMR studies. J Mol Biol 347,
27–39.
11 Bakrac B, Gutierrez-Aguirre I, Podlesek Z, Sonnen AF,
Gilbert RJ, Macek P, Lakey JH & Anderluh G (2008)
Molecular determinants of sphingomyelin specificity of
a eukaryotic pore-forming toxin. J Biol Chem 283,
18665–18677.
12 Kristan K, Viero G, Macek P, Dalla Serra M & Ander-
luh G (2007) The equinatoxin N-terminus is transferred
across planar lipid membranes and helps to stabilize the
transmembrane pore. FEBS J 274, 539–550.
13 Kristan KC, Viero G, Dalla Serra M, Macek P &
Anderluh G (2009) Molecular mechanism of pore
formation by actinoporins. Toxicon 54, 1125–1134.
14 Mechaly AE, Bellomio A, Gil-Carton D, Morante K,
Valle M, Gonza
´
lez-Man
˜
as JM & Guerı
´
n DM (2011)
Structural insights into the oligomerization and archi-
tecture of eukaryotic membrane pore-forming toxins.
Structure 19, 181–191.
15 Alegre-Cebollada J, Lacadena V, On
˜
aderra M, Manche-
n
˜
o JM, Gavilanes JG & Martı
´
nez-del-Pozo AM (2004)
Phenotypic selection and characterization of randomly
produced non-haemolytic mutants of the toxic sea
anemone protein sticholysin II. FEBS Lett 575, 14–18.
16 Alegre-Cebollada J, Cunietti M, Herrero-Gala
´
nE,
Gavilanes JG & Martı
´
nez-del-Pozo A (2008) Calorimet-
ric scrutiny of lipid binding by sticholysin II toxin
mutants. J Mol Biol 382, 920–930.
17 Monastyrnaya M, Leychenko E, Isaeva M, Likhatskaya
G, Zelepuga E, Kostina E, Trifonov E, Nurminski E &
Kozlovskaya E (2010) Actinoporins from the sea
anemones, tropical Radianthus macrodactylus and
northern Oulactis orientalis: comparative analysis of
structure–function relationships. Toxicon 56, 1299–1314.
18 Uechi G, Toma H, Arakawa T & Sato Y (2010)
Molecular characterization on the genome structure of
hemolysin toxin isoforms isolated from sea anemone
Actineria villosa and Phyllodiscus semoni.
Toxicon 56,
1470–1476.
19 de los Rios V, Manchen
˜
o JM, Martinez del Pozo A,
Alfonso C, Rivas G, On
˜
aderra M & Gavilanes JG
(1999) Sticholysin II, a cytolysin from the sea anemone
Stichodactyla helianthus, is a monomer-tetramer associ-
ating protein. FEBS Lett 455, 27–30.
20 Zidek L, Novotny MV & Stone MJ (1999) Increased pro-
tein backbone conformational entropy upon hydropho-
bic ligand binding. Nat Struct Biol 6, 1118–1121.
21 Alegre-Cebollada J, Clementi G, Cunietti M, Porres C,
On
˜
aderra M, Gavilanes JG & Martı
´
nez del Pozo A
(2007) Silent mutations at the 5¢-end of the cDNA of
actinoporins from the sea anemone Stichodactyla helian-
thus allow their heterologous overproduction in Escheri-
chia coli. J Biotechnol 127 , 211–221.
22 Pardo-Cea MA, Alegre-Cebollada J, Martinez-del-Pozo
A, Gavilanes JG & Bruix M (2010)
1
H,
13
C, and
15
N
NMR assignments of StnII-Y111N, a highly impaired
mutant of the sea anemone actinoporin Sticholysin II.
Biomol NMR Assign 4, 69–72.
23 Castrillo I, Alegre-Cebollada J, Martinez-del-Pozo A,
Gavilanes JG & Bruix M (2009)
1
H,
13
C, and
15
N
NMR assignments of StnII-R29Q, a defective lipid
binding mutant of the sea anemone actinoporin
Sticholysin II. Biomol NMR Assign 3, 239–241.
24 Goddard TD & Kneller DG (2005) SPARKY 3.
University of California, San Francisco, CA.
25 Gu
¨
ntert P (2004) Automated NMR structure calcula-
tion with CYANA. Methods Mol Biol 278, 353–378.
26 Cornilescu G, Delaglio F & Bax A (1999) Protein back-
bone angle restraints from searching a database for
chemical shift and sequence homology. J Biomol NMR
13, 289–302.
27 Case DA, Cheatham TE III, Darden T, Gohlke H, Luo
R, Merz KM Jr, Onufriev A, Simmerling C, Wang B &
Woods RJ (2005) The Amber biomolecular simulation
programs. J Comput Chem 26 , 1668–1688.
28 Laskowski RA, Rullmann JAC, MacArthur MW,
Kaptein R & Thornton JM (1996) AQUA and
PROCHECK-NMR: programs for checking the quality
of protein structures solved by NMR. J Biomol NMR
8, 477–486.
29 Koradi R, Billeter M & Wu
¨
thrich K (1996) MOLMOL:
a program for display and analysis of macromolecular
structures. J Mol Graph 14, 29–32.
30 DeLano WL (2006) The PyMol molecular graphics
system. Version 1.3, Schro
¨
dinger, LLC. San Francisco,
CA.
31 Farrow NA, Muhandiram R, Singer AU, Pascal SM,
Kay CM, Gish G, Shoelson SE, Pawson T, Forman-
Kay JD & Kay LE (1994) Backbone dynamics of a free
and phosphopeptide-complexed Src homology 2 domain
studied by
15
N NMR relaxation. Biochemistry 33,
5984–6003.
Structure of R29Q and Y111N StnII mutants M. A. Pardo-Cea et al.
2088 FEBS Journal 278 (2011) 2080–2089 ª 2011 The Authors Journal compilation ª 2011 FEBS
32 Cole J & Lary J (2009) HeteroAnalysis. Analytical
Ultracentrifugation Facility, Bioservices Center,
University of Connecticut, Storrs, CT.
Supporting information
The following supplementary material is available:
Fig. S1. Heteronuclear
1
H–
15
N NOE spectra of StnII-
Y111N variant. Both NMR spectra with and without
saturation are represented. Signals are labelled with
the one letter amino acid code and the sequence num-
ber.
This supplementary material can be found in the
online version of this article.
Please note: As a service to our authors and readers,
this journal provides supporting information supplied
by the authors. Such materials are peer-reviewed and
may be re-organized for online delivery, but are not
copy-edited or typeset. Technical support issues arising
from supporting information (other than missing files)
should be addressed to the authors.
M. A. Pardo-Cea et al. Structure of R29Q and Y111N StnII mutants
FEBS Journal 278 (2011) 2080–2089 ª 2011 The Authors Journal compilation ª 2011 FEBS 2089