Andersons pediatric cardiology 1116
Bạn đang xem bản rút gọn của tài liệu. Xem và tải ngay bản đầy đủ của tài liệu tại đây (137.59 KB, 3 trang )
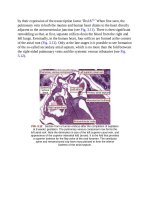
FIG.42.18 Color-comparisonimageintheparasternalshort-axisview
obtainedinapatientwithvalvarpulmonarystenosis.Thecolor-flow
Dopplerimageontherightdemonstratesturbulentbloodfloworiginatingat
thestenosedpulmonaryvalvewithcorrespondingtwo-dimensionalimaging
ofthevalveontheleft.
FIG.42.19 Continuous-wavespectralDoppleracrossthepulmonary
valvedemonstratingahighvelocityofflowaswellascalculatedpeak
instantaneousandmeangradientsacrossthevalve.
AstudybyHanyaandcolleaguesattemptedtovalidatethespecifiedBernoulli
constant(K),whichwas3.9andthereforeveryclosetothesimplifiedBernoulli
constant(4.0).31Theauthorsfoundthatthemoreseverethepulmonaryvalve
stenosis,thelesswidelyscatteredtheresultswere,suggestingthatthesimplified
Bernoulliconstantwasmoresuitableformoreseverepulmonaryvalvestenosis.
CalculationsofestimatedpressuregradientsderivedfromDoppler
measurementsofvelocityareanautomaticpartofallcommerciallyavailable
systemsforcardiacultrasonicinvestigation.Althoughbothpeakandmean
Dopplergradientscaneasilybecalculatedusingthesemethods,peakDoppler
gradientsaretypicallyusedintheclinicalsettinginmanagingpulmonary
stenosis.AstudybyAldousanyandcolleaguesfoundagoodcorrelationbetween
peak-to-peakcatheter-derivedgradientandpeakinstantaneousDopplergradient
obtainedbyechocardiography,eventhoughthepeakinstantaneousgradient
appearedtooverestimatethepeak-to-peakgradientfairlyconsistentlyby25%to
40%.32Intermsofabsolutenumbers,though,themeanDopplergradientmaybe
morecloselyrelatedtothepeak-to-peakgradientobtainedinthecatheterization
laboratory.
Twosettingsinwhichthemeasuredpressuregradientmayunderestimatethe
degreeofstenosisareinthecontextofanelevatedpulmonaryvascular
resistanceordecreasedrightventricularcontractility.Thepulmonaryvascular
resistancefrequentlyremainselevatedincriticalneonatalpulmonarystenosis,
causingthepulmonaryarterialpressuretobeelevateddistaltotheobstructionas
well.Whenventricularfunctioniscompromised,thecontractilitymaybe
insufficienttogenerateapressuregradientreflectiveofthedegreeofstenosis.
Similarly,therightventricularpressurecanalsobeestimatedbythevelocity
ofthejetoftricuspidvalvarregurgitation,whenpresent,addedtotheestimated
rightatrialpressure(Fig.42.20).Therightventricularpressureestimatecanbe
comparedtothemeasuredsystemicbloodpressuretoprovidetheclinicianwith
anapproximationofthedegreeofrightventricularhypertension(half-systemic,
three-quarterssystemic,etc.).Thereforeanaccuratemeasurementofthe
systemicbloodpressureatthetimeoftricuspidregurgitationjetvelocity
calculationisneededforcomparison.
FIG.42.20 Continuous-waveDopplerassessmentofthejetoftricuspid
incompetencepermittingtheestimationofrightventricularpressure.
FetalEchocardiography
Improvementsinimagingtechnologyhaveenhancedthecapabilityofimproved
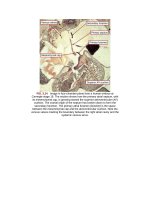
prenataldetectionofmanychildrenwithpulmonarystenosis.ColorDoppler
flowhasbeencreditedwithimprovedprenataldetectionofdefectssuchas
pulmonarystenosis(Fig.42.21)duetotheturbulenceofthehigh-velocityjetsit
canproduceacrosssemilunarvalves.33Multiplefactorsaffecttheprenatal
detectionrateofcongenitalheartdisease,includingpulmonarystenosis.
Inclusionoftheoutflowtractviewsinobstetricscanningincreasesthe
sensitivityofprenataldetectionofcongenitalheartdisease.34Prenatally,the
four-chamberviewmaybenormalinpatientswithpulmonarystenosis;therefore
theinclusionofoutflowtractvisualizationwouldaidinprenataldetection.