Classification and regression tree (CART) model to predict pulmonary tuberculosis in hospitalized patients docx
Bạn đang xem bản rút gọn của tài liệu. Xem và tải ngay bản đầy đủ của tài liệu tại đây (302.61 KB, 8 trang )
RES E AR C H A R T I C L E Open Access
Classification and regression tree (CART) model to
predict pulmonary tuberculosis in hospitalized
patients
Fabio S Aguiar
1*
, Luciana L Almeida
2
, Antonio Ruffino-Netto
3
, Afranio Lineu Kritski
1
, Fernanda CQ Mello
1
and Guilherme L Werneck
4,5
Abstract
Background: Tuberculosis (TB) remains a public health issue worldwide. The lack of specific clinical symptoms to
diagnose TB makes the correct decision to admit patients to respiratory isolation a difficult task for the clinician.
Isolation of patients without the disease is common and increases health costs. Decision models for the diagnosis
of TB in patients attending hospitals can increase the quality of care and decrease costs, without the risk of hospital
transmission. We present a predictive model for predicting pulmonary TB in hospitalized patients in a high
prevalence area in order to contribute to a more rational use of isolation rooms without increasing the risk of
transmission.
Methods: Cross sectional study of patients admitted to CFFH from March 2003 to December 2004. A classification
and regression tree (CART) model was generated and validated. The area under the ROC curve (AUC), sensitivity,
specificity, positive and negative predictive values were used to evaluate the performance of model. Validation of
the model was performed with a different sample of patients admitted to the same hospital from January to
December 2005.
Results: We studied 290 patients admitted with clinical suspicion of TB. Diagnosis was confirmed in 26.5% of them.
Pulmonary TB was present in 83.7% of the patients with TB (62.3% with positive sputum smear) and HIV/AIDS was
present in 56.9% of patients. The validated CART model showed sensitivity, specificity, positive predictive value and
negative predictive value of 60.00%, 76.16%, 33.33%, and 90.55%, respectively. The AUC was 79.70%.
Conclusions: The CART model developed for these hospitalized patients with clinical suspicion of TB had fair to
good predictive performance for pulmonary TB. The most important variable for prediction of TB diagnosis was
chest radiograph results. Prospective validation is still necessary, but our model offer an alternative for decision
making in whether to isolate patients with clinical suspicion of TB in tertiary health facilities in countries with
limited resources.
Keywords: Sensitivity and specificity, Accuracy, Tuberculosis, Diagnosis, Predictive models, CART
* Correspondence:
1
Instituto de Doenças do Tórax (IDT)/Clementino Fraga Filho Hospital (CFFH),
Federal University of Rio de Janeiro, Rua Professor Rodolpho Paulo Rocco, n°
255 - 6° Andar - Cidade Universitária - Ilha do Fundão, 21941-913 Rio de
Janeiro, Brazil
Full list of author information is available at the end of the article
© 2012 Aguiar et al.; licensee BioMed Central Ltd. This is an Open Access article distributed under the terms of the Creative
Commons Attribution License ( which permits unrestricted use, distribution, and
reproduction in any medium, provided the original work is properly cited.
Aguiar et al. BMC Pulmonary Medicine 2012, 12:40
/>Background
Even after 50 years of effective treatment, tuberculosis
(TB) remains a major public health issue worldwide. Its
airborne transmission endangers all individuals irre-
spective of social class or country of origin, although it
affects mostly the poorer groups of the society [1]. For
disease control to be achieved, prompt diagnosis and ef-
fective treatment of active cases, associated with treat-
ment of latent TB infection (LTBI) are essential [2].
Sadly, most of the modern diagnostic tests have not yet
become available in resource constrained countries [3],
which concentrate 95% of world’s TB cases and 98% of
deaths [1]. In these settings, diagnosis is still dependent
of detection of acid-fast bacilli (AFB) through sputum
smear analysis (SSA) or isolation of Mycobacterium tu-
berculosis (Mtb) after growth in solid culture medium.
Although inexpensive and widely available, SSA has a
low sensitivity and, in areas with laboratory shortage,
results can take up to 7 days instead of a few hours [2].
The lack of specific clinical symptoms to predict pul-
monary TB diagnosis makes the correct decision to
admit patients to respiratory isolation (RI) a difficult task
for the clinician. Since rapid RI of suspected cases is
highly effective in preventing hospital transmission [4-7],
overuse of isolation rooms (IR) is common, with
described rates of TB diagnosis ranging from 3.7 to 44%
among patients admitted to RI [8-14]. As a consequence,
medical costs are increased due to the need for installing
and maintaining IR [15-17]. IR are still scarce and infec-
tion control measures in health care facilities are at an
early stage of development in most resource constrained
countries, as shown by recent data from the WHO [18].
For more than 10 years it has been hypothesized that the
identification of clinical parameters r eadily available at t he
time of admission can improve the use of isolation rooms
[8]. Predictive models need to be validated in the popula-
tion where it will be applied, sinc e even high accuracy mod-
els might perform p oorly in a population with different TB
epidemiology [19]. As a conseq uence, no prediction models
have been validated for use in multiple settings.
Brazil ranks 14th in the World Health Organization
(WHO) list of countries with highest burden of the disease
[18]. Rio de Janeiro City (RJC) has a incidence of TB of
around 105.5 cases per 100,000 habitants [20] and one
third of its cases are diagnosed in hospitals [21]. Such
environments have an established role in the transmission
of TB and, although infection control measures are con-
sidered by the WHO as essential [18], few hospitals in RJC
have implemented any of these measures. As a conse-
quence, an increased risk of transmission to other patients
and health care personnel is expected in these settings as
shown in data from developed countries and South Africa
[7,22-25]. Recently, outbreaks of XDR-TB have been
reported in hospitals from South Africa [25].
The decision to isolate patients is largely based in
physician experience and intuition but this can be mis-
leading [26]. Clinical prediction rules have been devel-
oped to assist the clinician in decision making of
isolation, with utilization of many statistical techniques
such as logistic regression and neural networks, for ex-
ample [27]. Few studies used CART methodology to pre-
dict TB diagnosis [8,28,29], two of which have been
performed by our group among outpatients in RJC.
Mello et al [28] have applied CART to identify patients
with smear-negative pulmonary tuberculosis (SNTB)
with good results. Santos et al [29] also showed good
results in applying CART to SNTB patients. To our
knowledge the only study that applied CART method-
ology to predict TB in hospitalized patients was per-
formed by El-Sohl et al [8] in the USA. The researchers
described a simple model able to reduce unnecessary RI
by 40%.
Clinical algorithms can increase the pretest likelihood
of TB diagnosis in high and low income countries [30].
Since substantial economic costs are related to unneces-
sary isolation of patients [31], a clinical model to predict
active TB in patients admitted to hospitals can become
an important tool for improving infection control in re-
source constrained countries with high disease burden.
The use of such models at the moment of arrival at the
health unit may be able to lower utilization of IR in
patients with other diseases, thus reducing costs and im-
proving the rationale utilization of such beds [9]. There-
fore, we studied a hospitalized sample of patients in a
tertiary hospital located in a high TB prevalence area of
RJC to develop a pred ictive model for pulmonary TB
aiming at contributing to a more rational decision on
the use of isolation rooms (IR).
Methods
We performed a cross sectional study among patients
admitted to IR of the Clementino Fraga Filho Hospital
(CFFH) of the Federal University of Rio de Janeiro.
CFFH is a tertiary hospital, reference for the treatment
of patients with HIV/AIDS. In 1998, a TB control pro-
gram (TCP) was implemented in CFFH as a novel strat-
egy for the control of TB with significant reduction of
LTBI in health care workers (HCW) [32]. The program
consisted of isolation of TB suspects and confirmed TB
inpatients, quick turnaround for acid-fast bacilli sputum
tests and HCW education in use of protective respira-
tors, with a consistent reduction in tuberculin skin test
conversion among HCW .
From March 2003 to December 2004, a convenience
sample of all patients admitted in IR had their medical
charts reviewed. Inclusion criterion was clinical suspi-
cion of TB. We defined clinical suspicion in the same
way patients in our hospital are selected for RI: cough
Aguiar et al. BMC Pulmonary Medicine 2012, 12:40 Page 2 of 8
/>for more than 2 weeks associated with an y radiologic ab-
normality, or any respiratory symptom in patients with
confirmed or suspected HIV infection. Patients with ac-
tive TB diagnosis previous to the admission, with extra-
pulmonary TB and without a final diagnosis were
excluded. Decision to isolate these patients was made by
emergency room or TB control program physicians
according to the TB program criteria. Patients HIV
negative with cough for more than 2 weeks and an asso-
ciated abnormality in a chest X-ray were considered sus-
pect of having TB and were isolated. For patients HIV
positive were considered suspects if they had any re-
spiratory symptom and were also isolated. Clinical data
regarding demographic characteristics, respiratory and
constitutional symptoms, potential predictive factors for
TB diagnosis, radiologic test results and final diagnosis
of admission were analyzed retrospectively. Radiologic
tests were analyzed in a standard manner by a pulmo-
nologist (L.L.A.) with experience in TB care, blinded to
patient’s information. The tests were classified as either
normal or sequelae from a previous TB episode, suggest-
ive of TB by typical or possible X-ray findings and atyp-
ical findings (Table 1). Typical were those considered as
having any parenchymal infiltrate or cavity localized in
the upper zone (defined as the area above the posterior
third rib); possible were those presenting a miliary pat-
tern, pleural effusion or thoracic adenopathy, and atyp-
ical those showing any other abnormality.
Pulmonary TB was defined by isolation of Mycobacter-
ium tuberculosis (Mtb) in Lowesten-Jensen (L-J) solid
culture medium in respiratory samples (spontaneous or
induced sputum and bronchoalveolar lavage), by findings
of granulomatous inflammation with caseous ne crosis in
respiratory tissue biopsy samples or by improvement of
respiratory symptoms within 60 days of TB treatment,
without treatment for other diseases. A minimum of two
spontaneous sputum samples were analyzed for each pa-
tient. Those without sputum were submitted to one
sample of induced sputum or bronchoscopy with
bronchoalveolar lavage for analysis.
Differences in the prevalence of pulmonary TB by po-
tential predictors were analyzed using the Chi-Square
test for categorical variables or the Mann-Whitney test
for continuous variables. Associations between putative
predictive factors and the outcome were expressed as
odds ratio (OR) and their respective 95% confidence
intervals (95%CI) estimated by logistic regression.
We developed a CART model using S-Plus 4.5 (Math-
Soft, Inc) software. CART builds a tree through recur-
sive partitioning, so the data set is successfully split into
increasingly homogenous subgroups. At each stage
(node) the CART algorithm selects the explanatory vari-
able and splitting value that gives the best discrimination
between two outcome classes. A full CART algorithm
adds nodes until they are homogenous or contains few
observations (≥5 is the standard cut off in S-Plus). The
problem of creating a useful tree is to find suitable
guidelines to prune the tree. The general principle of
pruning is that the tree of best size would have the low-
est misclassification rate for an individual not included
in the original data [33].
Data collected from all patients were included in the
model. Patients with missing HIV serology results were
joined with the HIV negative group (HIV negative/unde-
terminate), since patients with clinical suspicion of HIV
infection were more likely to have a test requested
by the attending physician. The predictive variables
included in the model were chest X-Ray results (as
described in Table 1), age, gender, cough for more than
3 weeks, HIV/AIDS, hemoptysis, weight loss >10% of
body weight, dyspnea, fever, smoking and alcohol use
history and recent contact with a pulmonary TB case.
The response variable was final diagnosis of pulmonary
TB. The process of growing the tree was stopped when
we found a gain of less than 1% of the classification
error or when the number of patients within each knot
was less than five. We then validated the model with an-
other convenience sample of patien ts with similar char-
acteristics admitted to IR of the hospital in a one year
period from January to December 2005. This sample
consisted of 191 individuals admitted to the hospital
with clinical suspicion of pulmonary TB from January to
December 2005. The prevalence of TB in the validation
sample was 16.6%. HIV prevalence was 46.6%. Other
clinical and radiological characteristics were similar to
the original sample.
The area under the ROC curve, sensitivity, specificity,
positive and negative predictive values with their re-
spective 95% confidence intervals, estimated using Stata
software, version 9.0, were used to evaluate the
Table 1 Description of x-ray findings
X-ray finding Description
Suggestive Infiltrate or cavities in one of more segments of superior lobes and/or superior segments of lower pulmonary lobes,
miliary pattern, pleural effusion and/or thoracic adenopathy
Normal or Sequelae Normal X-ray or findings suggestive of a previous TB episode, without suspicion of active disease
Atypical Any abnormalities not classified by Suggestive or Possible
Aguiar et al. BMC Pulmonary Medicine 2012, 12:40 Page 3 of 8
/>performance of the model. The study was approved by
the CFFH Ethics Committee.
Results
From March 2003 to December 2004, 315 patients were
admitted to RI in CFFH with clinical suspicion of TB.
We excluded 25 patients due to TB diagnosis previous
to the admission (n = 15) and absence of final diagnosis
(n = 10). Data was analyzed for the remaining 290
patients. Pulmonary TB diagnosis was confirmed in
26.5% (77/290) of the patients, with isolation of Mtb in
72 patien ts (48 had positive SSA). In addition, 2 had
chronic granulomatous inflamma tion with caseous ne-
crosis and three had TB confirmation by clinical im-
provement with TB treatment. SNTB was present in
37.7% of pulmonary TB cases. HIV/AIDS was present in
56.9% (n = 165) of patients. In the HIV group, SNTB was
present in 48.6% (n = 82). Three HIV positive patients
with AFB in SSA had identification of non-tuberculous
mycobacteria (NTM) (5.9% of positive SSA). Medium
age was 42 years. Other clinical, demographic and radio-
logic data of the patients are displayed in Table 2.
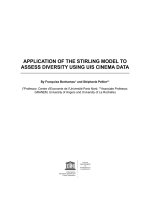
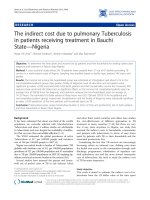
The generated CART model is displayed in Figure 1.
Only 275 patients were included in this model due to
missing values in one or more variables. The variable
with the greatest discriminative power was the x-ray re-
sult. The validated CART model showed sensitivity, spe-
cificity, positive predictive value and negative predictive
value of 60%, 76%, 33%, and 90%, respectively. The AUC
was 79% (Table 3). The minimum number of patients in
the parent and daughter nodes were 15 and 7, respect-
ively. The residual mea n deviance was 0.108 and the
misclassification rate was 15%.
Discussion
The CART model developed for these hospitalized
patients with clinical suspicion of TB had fair to good
accuracy for pulmonary TB as indicated by the area
under the ROC curve. The model was developed to
achieve a high specificity in order to avoid nosocomial
transmission, but had also fair to high sensitivity. The
sensitivity of the model is higher than the sensitivity of
sputum microscopy examination among all suspected
cases (48%) and in HIV patients (30%) [32]. This result
is relevant since it is common in some settings, mainly
in resource constrained countries, to have smear exam-
ination for acid fast bacilli as the only test available for
pulmonary TB diagnosis. The model also had a high
negative predictive value (90.55; 95% CI 84.08–95.02).
In our sample of all patients submitted to RI, only 26.6%
had TB confirmed. The high negative predictive value
found in the CART model allows its application in
patients with clinical suspicion of TB in the emergency
room in order to lower the number of unnecessary RI.
The application of a predictive model in patients with clin-
ical suspicion of TB has been described before and was
able to reduce the number of unnecessary isolations with-
out increasing the risk of nosocomial transmission [14].
Our model had a high negative predictive value, simi-
lar to the CART model described by El-Sohl et al [8],
with an overall higher accuracy. We also had a higher
accuracy than the CART model developed by Me llo et al
in RJC that included only SNTB [28]. This finding is
expected since SNTB is a factor known to harden TB
diagnosis [28]. Two studies have used neural networks
for case detection in hospitalized patients. El-Sohl et al
[9] described a model with a sensitivity of 92.3% and
specificity of 71.6% for case detection, which are higher
than we found in our model. Santos et al, studying
SNTB, constructed a neural network with accuracy simi-
lar to ours, being able of correctly classifying 77% of the
cases [29].
The most important variable for prediction of TB diag-
nosis was chest radiograph results. Typical or compatible
x-rays were found to predict the diagnosis of pulmonary
TB. This finding has been previously reported in CART
models for TB in hospitalized patients [8]. Although
chest radiography has been described a s less specific for
TB diagnosis and with a higher cost for case detection in
outpatients with clinical suspicion of TB [34], for hospi-
talized patients the test seems to have clinical import-
ance. Age has been described as important for prediction
of TB in RJC patients [28,29]. In our model, a cutoff of
30 years of age was important for discriminating TB, par-
ticularly in patients with atypical chest X-Ray without
dyspnea.
Predictive models for the diagnosis of TB provide a
useful framework for systematization of the diagnostic
approach [35] and are able to standardize data colle ction
from clinicians [36], optimize high cost resources such
as IR [29] and lower empiric treatments. In order to
achieve control of TB new low-cost, highly accurate
tests, are essential for use in areas with high TB preva-
lence. CART methods build a binary classification sys-
tem according to the variable with the greatest capacity
for discriminating between outcomes (in this case, the
presence or absence of TB). The discriminatory power
decreases with each subsequent division. The main
advantages of CART are that it is simple, interactions be-
tween the variables can be identified directly from the
model and probability can be displayed in the tree. Its
simple structure makes it easy for the clinician to under-
stand the data displayed, unlike some other statistical
methods. It is also inexpensive and allows immediate
results. Therefore, it can become a tool for TB diagnosis
in resource limited settings.
Predictive models should be applied to populations
where they were validated [27,28]. Our model was
Aguiar et al. BMC Pulmonary Medicine 2012, 12:40 Page 4 of 8
/>Table 2 Clinical and radiologic characteristics of the patients included and associations with pulmonary TB
N (%) OR 95% CI
Demographic Data
Gender
Male 173 59.7 1
Female 117 40.3 0.53 0.30-0.94
Age
Mean 43.2 41.48 – 44.93
< 31 yrs 60 20.7 1
31-40 yrs 73 25.2 0.48 0.22 – 1.04
41-50 yrs 66 22.7 0.55 0.25 – 1.19
51-60 yrs 53 18.3 0.56 0.24 – 1.27
>60 yrs 38 13.1 0.61 0.25 – 1.50
HIV/AIDS
No/ Undeterminate 125 43.1 1
Yes 165 56.9 0.61 0.36-1.04
Clinical Characteristics
Fever
No 85 29.3 1
Yes 205 70.7 1.37 0.76-2.48
Cough for more than 3 weeks
No 162 58.3 1
Yes 116 41.7 2.49 1.44-4.28
Hemoptysis
No 235 81.0 1
Yes 55 19.0 0.48 0.22-1.03
Weight Loss
No 165 56.9 1
Yes 125 43.1 3.40 1.97-5.88
Dyspnea
No 168 57.9 1
Yes 122 42.1 0.62 0.36-1.07
Recent Contact with TB
No 262 91.3 1
Yes 25 8.7 1.64 0.69-3.87
Habits
Smoking History
No 134 47.7 1
Yes 147 52.3 1.22 0.72-2.08
Alcoholism
No 241 84.0 1
Yes 46 16.0 0.89 0.42-1.85
Radiological Results
Chest X-Ray
Normal or Sequelae 89 30.7 1
Typical or Compatible 81 27.9 68.08 19.58 – 236.69
Atypical 120 41.4 4.73 1.34 – 16.68
Aguiar et al. BMC Pulmonary Medicine 2012, 12:40 Page 5 of 8
/>validated with the use of a sample of different patients
admitted to the same hospital in another period of time,
reason why we assume it to be a robust model for pre-
diction of TB diagnosis. The main strength of our model
is to allow utilization in resource limited settings since it
has bee n developed from individuals attending a health
unit in a city with high prevalence of TB and with a
number of restrictions in the availability of diagnostic
resources for TB. The variables selected can be easily
obtained by clinical interview and a chest radiograph,
allowing its use for rapid isolation decision. Also, the
high accuracy of the model allow prompt use in a popu-
lation of hospitalized patients, a population known to be
difficult to diagnose TB due to the high number of alter-
native diagnoses, especially in HIV/AIDS patients.
Our study has some limitations. All data was collected
retrospectively, increasing the risk of information bias
due to risk of incomplete registry of data and potentially
increasing the accuracy [37]. This limitation is inherent
to the development of such models, and further valid-
ation in prospective studies is necessary. Also, since we
studied a convenience sample of patients admitted to RI,
this might not be representative of the population we
wish to make inferences and might also not meet the
sample size requirements for generating models with
the best possible predictive performance. Another limi-
tation is that the model wa s generated with data from
patients admitted in a tertiary hospital, limiting the
generalization of the results. Selection bias is another
potential problem, since we studied a convenience sam-
ple and not a probabilistic sample, and it is possible that
the studied population does not represent the target
population for whom we wanted to make inferences.
Also, patients were selected after admission to an isola-
tion room, thus increasing the pretest probability of TB.
Our main discriminative variable was chest radiography.
Other studies have a different classification of thoracic
radiography [8-13,26,27]. To our knowledge, there is no
data in the literature to define a universal classification
system. We used the same classification method from
previous studies of predictive models from our group
Clinical Suspicion of TB
Total = 275
p = 27.0%
n = 190
p = 37.0%
n = 85
p = 3.5%
X-Ray:
Typical, possible or
atypical
X-Ray:
Normal or Sequelae
n = 30
p = 60.0%
No Weight Loss
n = 46
p = 78.0%
Weight Loss
Atypical X-Ray
Typical or possible X-Ray
n = 76
p = 71.0%
n = 114
p = 14.0%
Dyspnea
No Dyspnea
n = 50
p = 24.0%
n = 64
p = 6.2%
HIV negative/
undeterminate
n = 49
p = 2.0%
HIV positive
n = 15
p = 20.0%
No Weight loss
Weight loss
n = 7
p = 0%
n = 8
p = 38.0%
n = 12
p = 50.0%
Age 30 yrs
n = 38
p = 16.0%
Age > 30yrs
Figure 1 Classification and regression tree model for predicting pulmonary tuberculosis (TB) in hospitalized patients. The number of
patients (n) and the probability of TB (p) are given inside each node. Terminal nodes are shaded.
Table 3 Results from validation of the CART
model – Sensitivity, Specificity, Positive and Negative
predictive values and area under the ROC curve
% 95% CI
Sensitivity 60 40 – 77
Specificity 76 68 – 82
Positive Predictive Value 33 21 – 47
Negative Predictive Value 90 84 – 95
Area under the ROC curve 79 70 – 88
Aguiar et al. BMC Pulmonary Medicine 2012, 12:40 Page 6 of 8
/>in order to maintain standardization of our findings
[28,29]. Last, the approach to classify patients with miss-
ing HIV serology results and low clinical suspicion for
HIV infection in the HIV negative/undeterminate group
may have misdiagnosed some of these patients, interfer-
ing with the accuracy of the model.
Conclusion
Prospective validation is necessary, but our CART model
offers an alternative for decision making in whether to
isolate patients with clinical suspicion of TB in tertiary
health facilities in countries with limited resources. A
reasonable strategy for the present model would be its
application in patients with clinical suspicion of TB who
demand admission to a hospital with a limited number
of IR, especially for HIV/AIDS patient s. Patients with a
low probability of TB in the model can have bacteriolo-
gic analysis while admitted in regular hospital beds, es-
pecially those with confirmed or suspicion of HIV/AIDS
diagnosis. Nonetheless, currently there are no predictive
models for this purpose that can be generalized for all
settings. CART models are an alternative for the devel-
opment of such clinical decision rules, but other statis-
tical techniques, such as logistic regression and neural
networks, are available and more studies are needed to
define which would have the best performance for pre-
dicting TB and thus contribute to a more rational deci-
sion on the use of isolation rooms (IR). Further studies
are needed with prospective data before these tools can
become clinical practice in resource constrained coun-
tries with high TB prevalence.
Competing interests
The author(s) declare that they have no competing interests.
Authors’ contributions
FSA analyzed the data, constructed the model and wrote the final
manuscript; LLA had the idea, wrote the study project, collected the data
and performed the preliminary analysis, AR-N discussed and made changes
to the study project, performed orientation during the data collection and
preliminary analysis; ALK discussed and made changes to the study project,
performed orientation during the data collection and preliminary analysis;
FCQM discussed and made changes to the study project, performed
orientation during the data collection and preliminary analysis; wrote the
final manuscript; GLW wrote the methods section on the study project,
constructed the model, validated the model and wrote the final manuscript.
All authors read and approved the final manuscript.
Acknowledgements
FS Aguiar is supported by Fogarty/NIH 3 D43 TW000018-16S3 and 5 U2R
TW006883-02; GL Werneck partially funded by CNPq (504162/2008-0 and
308889/2007-0).
Author details
1
Instituto de Doenças do Tórax (IDT)/Clementino Fraga Filho Hospital (CFFH),
Federal University of Rio de Janeiro, Rua Professor Rodolpho Paulo Rocco, n°
255 - 6° Andar - Cidade Universitária - Ilha do Fundão, 21941-913 Rio de
Janeiro, Brazil.
2
Harbor Hospital, 3001 S. Hanover St, Baltimore, MD 21225
USA.
3
Ribeirão Preto Medical School, University of São Paulo, Av.
Bandeirantes, 3900, 14049-900 Ribeirão Preto-SP, Brazil.
4
Instituto de Estudos
em Saúde Coletiva, Federal University of Rio de Janeiro, Praça Jorge
Machado Moreira, Ilha do Fundão, Cidade Universitária, 21944-210 Rio de
Janeiro, Brazil.
5
Instituto de Medicina Social, State University of Rio de
Janeiro, Rua São Francisco Xavier, 524, 7° andar, Bloco D. – Maracanã,
20550-900 Rio de Janeiro, Brazil.
Received: 13 October 2011 Accepted: 26 July 2012
Published: 7 August 2012
References
1. Raviglione MC, Gupta R, Dye CM, Espinal MA: The burden of drug-resistant
tuberculosis and mechanisms for its control. Ann N Y Acad Sci 2001,
953:88–97.
2. Luna JA: A tubeculosis guide for specialist physicians. International Union
Against Tuberculosis and Lung Disease (IUATLD).; 2004. ieder.
org/publications/books_english/specialists_en.pdf.
3. Keeler E, Perkins MD, Small P, Hanson C, Reed S, Cunningham J, Aledort
JE, Hillborne L, Rafael ME, Girosi F, Dye C: Reducing the global burden
of tuberculosis: the contribution of improved diagnostics. Nature 2006,
444(Suppl 1):49–57.
4. Menzies D, Fanning A, Yuan L, FitzGerald JM: Hospital ventilation and risk
for tuberculous infection in canadian health care workers. Canadian
Collaborative Group in Nosocomial Transmission of TB. Ann Intern Med
2000, 133(10):779–789.
5. Nicas M: Assessing the relative importance of the components of an
occupational tuberculosis control program. J Occup Environ Med / Am Coll
Occup Environ Med 1998, 40(7):648–654.
6. Blumberg HM, Watkins DL, Berschling JD, Antle A, Moore P, White N, et al:
Preventing the nosocomial transmission of tuberculosis. Ann Intern Med
1995, 122(9):658–663.
7. Centers for Disease Control and Prevention: Guidelines for preventing the
transmission of Mycobacterium tuberculosis in health-care settings,
2005. MMWR Recomm Rep 2005, 54(17):1–141.
8. El-Solh A, Mylotte J, Sherif S, Serghani J, Grant BJB: Validity of a decision
tree for predicting active pulmonary tuberculosis. Am J Respir Crit Care
Med 1997, 155:1711–1716.
9. El-Solh A, Hsiao C-B, Goodnough S, Serghani J, Grant BJB: Predicting active
pulmonary tuberculosis using an artificial neural network. Chest 1999,
116:968–973.
10. Mylotte JM, Rodgers J, Fassl M, Seibel K, Vacanti A: Derivation and
validation of a pulmonary tuberculosis prediction model. Infect Control
Hosp Epidemiol 1997, 18:554–560.
11. Tattevin P, Casalino E, Fleury L, Egmann G, Ruel M, Bouvet E: The validity of
medical history, classic symptoms and chest radiographs in predicting
pulmonary tuberculosis – Derivation of a pulmonary tuberculosis
prediction model. Chest 1999,
115:1248–1253.
12. Wisnivesky JP, Kaplan J, Henschke C, McGinn TG, Crystal RG: Evaluation of
clinical parameters predicts Mycobacterium tuberculosis in inpatients.
Arch Intern Med 2000, 160:2471–2476.
13. Wisnivesky JP, Henschke C, Balentine J, Willner C, Deloire AM, McGinn
TG: Prospective validation of a prediction model for isolating
inpatients with suspected pulmonary tuberculosis. Arch Intern Med
2005, 165:453–457.
14. Lagrange-Xe’lot M, Porcher R, Gallien S, Wargnier A, Pavie J, de Castro N,
Molina J-M: Prevalence and clinical predictors of pulmonary tuberculosis
among isolated inpatients: a prospective study. Clin Microbiol Infect 2010,
17(4):610–614. doi:10.1111/j.1469-0691.2010.03259.x. PubMed PMID:
20459437.
15. TB Management Program: Guidelines for Preventing the Transmission of
Tuberculosis in Canadian Health Care Facilities and Other Institutional
Settings - CCDR Vol 22 22S1. available at />ccdr-rmtc/96vol22/22s1/index.html, last accessed November 23
rd
2009.
16. Nardell EA: Fans, filters or rays? Pros and cons of the current
environmental tuberculosis control technologies. Infect Control Hosp
Epidemiol 1993, 14:681–685.
17. Fella P, Rivera P, Hale M, Siegal M, Dehovitz J, Sepkowitz K:
Implementations of OSHA guidelines for protection of employiees
against tuberculosis at New York City hospital (abstract). Am J Infect
Control 1994, 22:100.
18. WHO: WHO Report 2009: Epidemiology Strategy Financing.; 2009. http://
whqlibdoc.who.int/publications/2009/9789241563802_eng_doc.pdf.
Aguiar et al. BMC Pulmonary Medicine 2012, 12:40 Page 7 of 8
/>19. Steenstra R, Brandon B, Gaeta T: External validation of a decision tree for
predicting active pulmonary tuberculosis [abstract]. Am J Respir Crit Care
Med 1998, 157:A180.
20. Boletim Informativo do Programa de Controle de Tuberculose do Município do
Rio de Janeiro, 2004. Rio de Janeiro: PCT; 2004. http://200.141.78.79/dlstatic/
10112/123737/DLFE-1745.pdf/TB_BoletimEpidemiologicoTBMRJ2001_2006.
pdf.
21. PCT-RJ: Boletim informativo do Programa de Controle de Tuberculose do
Município do Rio de Janeiro. Rio de Janeiro: 2003.
22. CDC: Drug-susceptible tuberculosis outbreak in a state correctional
facility housing HIV-infected inmates—South Carolina, 1999–2000.
MMWR 2000, 49:1041–1044.
23. Dooley SW, Jarvis WR, Martone WJ, Snider DE Jr: Multidrugresistant
tuberculosis. Ann Intern Med 1992, 117:257–259.
24. Edlin BR, Tokars JI, Grieco MH, et al: An outbreak of multidrugresistant
tuberculosis among hospitalized patients with the acquired
immunodeficiency syndrome. N Engl J Med 1992, 326:1514–1521.
25. Gandhi NR, Moll A, Sturm AW, Pawinski R, Govender T, Lalloo U, Zeller K,
Andrews J, Friedland G: Extensively drug-resistant tuberculosis as a cause
of death in patients co-infected with tuberculosis and HIV in a rural area
of South Africa. Lancet 2006, 368(9547):1575–1580.
26. Wisnivesky JP, Serebrisky D, Moore C, Sacks HS, Iannuzzi MC, McGinn T:
Validity of clinical prediction rules for isolating inpatients with suspected
tuberculosis. A systematic review. J Gen Intern Med. 2005, 20(10):947–952.
Review. PubMed PMID: 16191144; PubMed Central PMCID: PMC1490232.
27. Solari L, Acuna-Villaorduna C, Soto A, van der Stuyft P: Evaluation of clinical
prediction rules for respiratory isolation of inpatients with suspected
pulmonary tuberculosis. Clin Infect Dis 2011, 52(5):595–603.
28. Mello FCQ, Bastos LGV, Soares SLM, Rezende VMC, Conde MB, Chaisson RE,
Kritski AL, Ruffino-Netto A, Werneck GL: Predicting smear negative
pulmonary tuberculosis with classification trees and logistic regression: a
cross-sectional study. BMC Public Health 2006, 6:43.
29. Santos AM, Pereira BB, Seixas JM, Mello FCQ, Kritski AL: Neural networks: an
application for predicting smear negative pulmonary tuberculosis.In
Advances in statistical methods for the health sciences applications to cancer
and AIDS studies, genome sequence analysis, and survival analysis. Edited by
Jean-Louis A, Balakrishnan N, Mounir M, Geert M. Boston: Birkhäuser; 2006.
30. Schluger N: Changing approaches to the diagnosis of tuberculosis. Am J
Respir Crit Care Med 2001, 164:2020
–2024.
31. Griffiths RI, Hyman CL, McFarlane SI, Saurina GR, Anderson JE, O’Brien T,
Popper C, McGrath MM, Herbert RJ, Sierra MF: Medical resource use for
suspected tuberculosis in a New York City hospital. Infect Control Hosp
Epidemiol 1998, 19:747–753.
32. da Costa PA, Trajman A, Mello FC, Goudinho S, Silva MA, Garret D, Ruffino-
Netto A, Kritski AL: Administrative measures for preventing
Mycobacterium tuberculosis infection among healthcare workers in a
teaching hospital in Rio de Janeiro, Brazil. J Hosp Infect 2009, 72(1):57–64.
33. SPLUS: SPLUS Guide for Statistical and Mathematical Analysis. Seattle:; 1998.
/>34. Harries AD, Kamenya A, Subramanyam VR, et al: Screening pulmonary
tuberculosis suspects in Malawi: testing different strategies. Trans R Soc
Trop Med Hyg 1997, 91:416–419.
35. Hopewell PC, Pai M, Maher D, Uplekar M, Raviglione MC: International
standards for tuberculosis care. Lancet Infect Dis 2006, 6(11):710–725.
36. World Health Organization: Toman’s tuberculosis case detection, treatment
and monitoring: questions and answers.: World Health Organization; 2004.
WHO/HTM/TB/2004.334. Page 12. Available at />publications/2004/9241546034_1.pdf.
37. Rutjes AWS, Reitsma JB, Nisio MD, Smidt N, van Rijn JC, Bossuyt PMM:
Evidence of bias and variation in diagnostic accuracy studies. CMAJ 2006,
174(4):469–476. PubMed PMID: 16477057; PubMed Central PMCID:
PMC1373751.
doi:10.1186/1471-2466-12-40
Cite this article as: Aguiar et al.: Classification and regression tree (CART)
model to predict pulmonary tuberculosis in hospitalized patients. BMC
Pulmonary Medicine 2012 12:40.
Submit your next manuscript to BioMed Central
and take full advantage of:
• Convenient online submission
• Thorough peer review
• No space constraints or color figure charges
• Immediate publication on acceptance
• Inclusion in PubMed, CAS, Scopus and Google Scholar
• Research which is freely available for redistribution
Submit your manuscript at
www.biomedcentral.com/submit
Aguiar et al. BMC Pulmonary Medicine 2012, 12:40 Page 8 of 8
/>