Understanding Aggregate Default Rates of High Yield Bonds docx
Bạn đang xem bản rút gọn của tài liệu. Xem và tải ngay bản đầy đủ của tài liệu tại đây (73.03 KB, 6 trang )
Understanding Aggregate Default Rates of High Yield Bonds
Jean Helwege and Paul Kleiman
What explains the wide swings in the default rate on high yield bonds in recent years?
Differences in credit quality from year to year account for much of the observed variation in
default rates, but economic conditions and the “age” of bonds have also played a role.
The market for high yield or speculative-grade bonds
1
has grown from $30 billion of outstanding bonds in 1980
to nearly $250 billion today. Over this period, the market
has evolved from a collection of “fallen angels”—bonds
that have lost their investment-grade rating—into an
established capital market for raising funds.
Although the high yield market is now mature, its
behavior during business cycle downturns is not well
understood. During the severe recessions of 1980-82,
when the market was in its infancy, few issuers of specu-
lative bonds defaulted on their obligations to creditors.
By contrast, in the mild recession of 1990-91, the default
rate soared to 11 percent. These sharply divergent experi-
ences raise the question: How does the high yield market
typically respond to a slowing economy?
To understand the effects of recessions on default
rates, we must first understand what causes the default
rate to vary over time. This article explores the factors
that help explain the past history of the aggregate high
yield default rate. To begin our analysis, we consider
existing statistical models that attribute variation in
the default rate to changes in credit quality, macro-
economic conditions, and the “age” of bonds. We then
build on this earlier work by clarifying the relative
importance of each of the factors in the models and by
refining the measures used.
Explaining Aggregate Default Rates
The fraction of all high yield issuers defaulting in a given
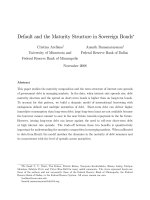
year has fluctuated greatly in the recent past. Since
1981, the aggregate default rate averaged just under
4½ percent, but the level of aggregate defaults varied
considerably from year to year. Defaults ranged from as
high as 11 percent in 1991 to less than 2 percent in 1981
and 1994 (see chart). In 1986, the default rate rose con-
siderably above the average, reaching 6 percent.
What explains these wide fluctuations in aggregate
default rates? In recent years, researchers (Fons 1991
and Jonsson and Fridson 1996) have identified three
factors that influence the pattern of defaults. First, they
have shown that changes in the credit quality of specu-
lative-grade bonds affect default rates over time. If the
high yield market has a greater fraction of lower rated
bonds, the aggregate default rate should rise in that year.
Second, the state of the economy affects the aggregate
default rate. Profits decline in downturns, leaving com-
panies with less cash to pay their bondholders. Third,
because defaults are most likely to occur three years
after being issued, the length of time that risky bonds
have been outstanding will influence the default rate.
This last factor is known as the aging effect.
Fons constructed a statistical model that included
two of these factors—credit quality and macroeco-
May 1996 Volume 2 Number 6
nomic conditions.
2
He factored credit ratings into his
model by calculating an expected default rate for the
high yield market each year. The expected default rate
is the default rate that would occur if firms in each
major rating category defaulted according to his-
torical patterns. To arrive at this rate, Fons multiplied
the fraction of the speculative-grade market in a major
rating category at the start of the year by the cate-
gory’s historical one-year default rate, repeated this for
each category, and then added up the products. Fons
used the Blue Chip consensus forecast of GDP growth
at the start of the year to incorporate a prediction of
macroeconomic effects on aggregate default rates.
Jonsson and Fridson modified the Fons model by
including the aging effect and incorporating macro-
economic variables that were more closely tied to
the financial health of corporations.
3
The authors
accounted for aging by using the fraction of high yield
bond issuance rated B3 or lower by Moody’s lagged by
three years. In essence, they combined two factors in
one variable: the lag allows for the effect of aging,
while the fraction of low-rated bonds measures credit
quality in the market. Because predicted GDP was
found to be only marginally significant, Jonsson and
Fridson included two macroeconomic variables that
had more explanatory power—corporate profits and the
liabilities of failed firms.
In the following sections, we investigate the rela-
tionship of credit quality, the macroeconomy, and aging
to default rates in greater detail. We improve on the
models of Fons and Jonsson and Fridson by refining
the variables they use to measure these three factors
and by introducing an alternative method of gauging
macroeconomic effects on default behavior. In addi-
tion, we use regression analysis to determine the
FRBNY 2
CURRENT ISSUES IN ECONOMICS AND FINANCE
relative importance of each of the factors in explaining
yearly fluctuations of the default rate.
To evaluate a factor’s contribution, we observe its
effect on the adjusted R-squared of a regression model.
Ranging from 0 to 100, the R-squared measures the
percentage of variation in annual aggregate defaults
that can be explained by the factors in the model. The
adjusted R-squared approaches 100 when these factors
account for most of the observed variation over time.
A regression model with a high adjusted R-squared
produces estimates of default rates that closely track
actual rates.
Credit Ratings
Bond ratings summarize the risk of default for an
individual bond. The safest bonds—AAA, AA, A, and
BBB—have a one-year probability of default that is
less than 0.1 percent.
4
Speculative-grade bonds—BB,
B, and CCC—are considerably riskier. Analysts assign
ratings to bonds by examining the issuing firm’s finan-
cial and business risk, as well as the risk factors
that are common to all firms in an industry. Ratings
therefore can be viewed as a proxy for underlying indi-
cators of financial strength. If the analysts are largely
correct in their opinion of individual bonds, then col-
lectively these bond ratings should help explain the
variation in aggregate default rates from year to year.
In particular, the distribution of ratings in the high
yield market at the beginning of a year should tell us a
considerable amount about the aggregate default rate in
that year. That is, when the ratings distribution of high
yield bonds is tilted toward the riskier end of the scale,
default rates should rise. The riskiest bonds issued in
the high yield market are those at the lower end of the
B category—rated B3 by Moody’s or B- by Standard &
Poor’s (S&P)—and the CCC bonds. Indeed, default
statistics calculated by Fons, Carty, and Kaufman
(1994) indicate that B3 bonds are three times more
likely to default than B1 bonds. Thus, the more bonds
rated B3 or lower that exist at the beginning of the year,
the more likely the default rate is to rise in that year.
We find that during the 1981-94 period, the expected
default rate based on major ratings categories has sig-
nificant explanatory power. The adjusted R-squared in
a regression model including only the expected default
rate is 34 percent, capturing just over a third of the vari-
ation in the aggregate default rate over time (see box).
This explanatory power is substantial, especially con-
sidering that the expected default rate is based on only
three categories—BB, B, and CCC.
We can refine our definition of the expected default
rate by calculating the fraction of the high yield market
in the modified letter categories—in the terminology of
Percent
Source: Standard & Poor’s.
0
2
4
6
8
10
12
Y
early Default Rate for the High Yield Bond Market
1981 82 83 84 85 86 87 88 89 90 91 92 93 94
Explanatory Power of Credit Ratings, the Economy, and the Aging Factor
This box presents six regression estimates of aggregate
default rate models. The adjusted R-squared measures
each model’s ability to explain the yearly fluctuations in
aggregate defaults. A higher adjusted R-squared indi-
cates greater explanatory power.
EDR
1
is the expected default rate calculated with
major ratings categories (in S&P’s terminology—BB,
B, and CCC); EDR
2
is the expected default rate calcu-
lated with modified ratings categories (in Moody’s ter-
minology—Ba1, Ba2, Ba3, B1, B2, B3, and Ca);
LAGB3 is the dollar amount of B3 or lower rated bonds
issued, lagged by three years.
S&P, the BB+, BB, BB-, B+, B, B-, and CCC cate-
gories.
5
Using data from S&P and Moody’s on the
distribution of bonds according to modified ratings, we
recalculated the expected default rate from 1981 to
1994. Including this new measure of the expected
default rate, rather than that based on major ratings
categories, increases the adjusted R-squared of the
model by 13 percentage points, to 47 percent (see box).
The statistical evidence clearly indicates that a high
concentration of low-rated bonds at the beginning of
the year is associated with above-average defaults
during the year. Still, although credit ratings provide
information about the aggregate default rate, more than
half of the variation in defaults over time remains unex-
plained. We now turn to the second factor influencing
default behavior, the state of the economy.
The Macroeconomy
A company’s ability to pay its bondholders depends on
the ability to generate profits, which may be sharply
impaired in a recession. To assess the aggregate effect of
economic shifts on high yield bond default rates, we can
include a measure of general economic growth in our
regression model. A natural measure of economic condi-
tions is GDP growth. When GDP growth is included
along with the expected default rate (using modified rat-
ings categories), the adjusted R-squared rises to 60 per-
cent, an increase of 13 percentage points (see box).
Those interested in forecasting the aggregate default
rate for the coming calendar year might be tempted to
use this regression model’s estimates together with
current ratings information and a prediction of eco-
nomic growth, such as the Blue Chip forecast.
However, the Blue Chip forecast for economic growth,
like many macroeconomic forecasts, is known to
systematically overpredict growth in recessions and
underpredict it in booms, so the model would not work
as well for predictions. Indeed, the same regression
using forecast GDP instead of actual GDP explains
only 54 percent of the observed variation—6 percent-
age points less than the regression using actual GDP.
As we noted earlier, alternative measures of general
economic conditions are corporate profits as a percent
of GDP and the current liabilities of failed businesses.
3
Regression Model Adjusted R-Squared
Credit Ratings
1) Default rate = -8.26 + 2.88 x EDR
1
34%
(-1.82)
*
(2.78)
**
2) Default rate = -13.41 + 2.91 x EDR
2
47%
(-2.70)
*
(3.57)
**
Macroeconomy
3) Default rate = -10.09 + 2.58 x EDR
2
- 0.52 x GDP 60%
(-2.19)
*
(3.54)
**
(-2.17)
*
4) Default rate = -9.08 + 2.07 x EDR
2
+ 0.56 x (recession indicator x EDR
2
) 75%
(-2.53)
*
(3.44)
**
(3.81)
**
Aging
5) Default rate = 1.12 + 12.53 x LAGB3 77%
(1.93)
*
(6.67)
**
6) Default rate = 1.61 + 8.89 x LAGB3 + 4.23 x (recession indicator x LAGB3) 81%
(2.68)
**
(3.35)
**
(1.80)
*
*
Significant at the 90 percent confidence level.
**
Significant at the 95 percent confidence level.
Liabilities of failed businesses emerge as a significant
factor in a regression, but they are in part an indicator
of the degree to which corporations are unable to ser-
vice their debt—the very variable we wish to explain!
Corporate profits are significant only when business
failure liabilities are also included in the regression
model. Even if business failure liabilities were an
independent factor in aggregate defaults, they are quite
difficult to forecast (much more so than corporate prof-
its). Consequently, these variables may be more helpful
in explaining past history than in predicting future varia-
tion in defaults.
So far we have only considered measures of eco-
nomic growth that vary continuously from weak to
strong. These measures force changes in the economy
to affect the aggregate default rate to the same extent
regardless of the initial strength of the economy. That
is, a slowdown of a strong economy, such as a drop in
GDP growth from 6 to 5 percent, would be predicted to
affect the aggregate default rate to the same degree as
weakness in a fragile economy—say, a drop in growth
from 2 to 1 percent. A more realistic specification of
the model would include an indicator variable for weak
economies. With an indicator variable, the aggregate
default rate would be predicted to remain unchanged
whenever the economy is strong. However, when the
economy dips below a critical level of GDP growth—
say, 1.5 percent—the aggregate default rate would be
expected to rise.
Furthermore, one would expect more defaults in a
downturn if during that time a greater proportion of
companies had low ratings. For example, suppose GDP
growth is only 1.0 percent this year. If most of the high
yield market is rated B3 by Moody’s, we would expect
many of these risky firms to default with such sluggish
growth. By contrast, if most of the bonds in the high
yield market are rated Ba1, the highest speculative-
grade rating, far fewer companies would be pushed into
default by the slow economy.
We incorporate these two concepts in our model
with a new variable—the product of changes in the
economy and the level of credit quality of the com-
panies in the market. First, we create a recession
indicator variable that takes on the value of one if the
economy experiences slow or negative growth, and
zero otherwise.
6
Then we multiply this recession
indicator by the expected default rate based on modi-
fied ratings. This new interaction variable raises the
explanatory power of the model another 15 percentage
points, to 75 percent (see box).
The interaction variable also sheds light on the
dramatic difference in the aggregate default rates of
1981-82 and 1990-91. The rate during the mild reces-
sion of 1990-91 far exceeded the default rates during
the severe recessions of the early 1980s because the
fraction of risky bonds was much greater at the start of
the 1990-91 recession.
The Aging Factor
The high yield bond market has cycles of issuance that
roughly correspond to returns in the market: in years
when returns are strong, more firms issue high yield
bonds. In addition, the market is more receptive to
riskier bonds at such times. These surges in issuance of
riskier bonds can lead to a greater fraction of defaults
in subsequent years.
Altman and Kishore (1995) show that low-rated
bonds are less likely to default in the first year after
issuance and most likely to default three years after
issuance. There are two plausible reasons why defaults
occur with a lag: First, companies that recently raised
money in the bond markets are likely to have the cash to
pay their creditors. Second, bond markets generally do
not lend to companies in immediate danger of default.
The fraction of bonds rated B3 or lower and lagged
by three years encompasses both this aging effect and
the notion that very low-rated bonds tend to default
more frequently. This variable by itself accounts for
77 percent of the variation in aggregate default rates
over time (see box). Compared with the results for a
model that includes just the expected default rate, this
result represents an improvement in the adjusted
R-squared of 30 percentage points (line 5 versus line 2
in the box), indicating a substantial role for aging.
The aging measure, however, may be correlated with
economic activity. Issuance of riskier bonds increases
when the capital markets are rising in anticipation of a
strong economy. Three years after such a period, the
economic environment is likely to be weaker. Thus, the
strength of lagged issuance of B3 and lower rated bonds
may incorporate macroeconomic effects as well as
credit quality and aging. To isolate the effect of aging
from both of these factors, we can compare the
explanatory power of 1) a regression model with lagged
B3 or lower issuance and the macroeconomic interac-
tion variable and 2) a regression model with the expected
default rate and the interaction variable (see box, line 6
versus line 4). This comparison suggests a much smaller,
yet still important, role for aging. The adjusted R-
squared with lagged B3 or lower issuance is only 6 per-
centage points higher (81 percent) than that of the
model based on the expected default rate and macroeco-
nomic interaction variable (75 percent).
The aging factor surely played a role in the surge in
default rates in 1990 and 1991: issuance of low-rated
bonds in 1987 and 1988 was more than triple its normal
FRBNY
4
CURRENT ISSUES IN ECONOMICS AND FINANCE
level. In contrast, such low-rated bonds were rarely
issued in the late 1970s, suggesting a small role for
aging in the recessions of 1980 and 1981-82.
The 1986 Puzzle
In 1986, speculative bond defaults jumped from 4 to
6 percent (see chart). Yet none of the factors explored
in this article were present at that time: the economy
was not in recession, the credit quality of the market
was not tilted toward the lower end, and lagged new
issuance had not peaked. What additional factor
accounts for the spike in defaults?
The jump largely reflects the decline in oil and gas
prices during 1986. Salomon Brothers (1992) calcu-
lates that half of the defaults on original-issue high
yield bonds in 1986 were in the energy industry. The
1986 experience suggests that some of the variation in
default rates not explained by our models may reflect
industry-specific economic trends.
Weakness in one industry can affect the aggregate
default rate because the high yield market is not well
diversified. Even the well-established high yield
market of 1988-92 had a number of industries that
claimed a sizable 5 percent share or more of the market
(Table 1). Nevertheless, if an overrepresented industry
is to have a substantial impact on the aggregate default
rate in any given year, it must experience a large
number of defaults. We know that some high yield
industries have recorded double-digit default rates
(Table 2). But how often does an industry with a signif-
icant share of the market suffer numerous defaults? We
calculate that since 1983, the high yield market experi-
enced these conditions jointly seven times—contribut-
ing 1 percent or more to the aggregate default rate
(Table 3). Moreover, this combination of conditions
raised the rate by more than 1.5 percentage points on
two occasions: oil and gas firms in 1986 and retailers
in 1991.
FRBNY
5
Table 1
Industries with 5 Percent or More of the High Yield
Bond Market, 1983-92
Average Average
1983-87 1988-92
Industry (Percent) Industry (Percent)
Oil and gas 10 Retail 10
Retail 7 Finance 7
Electronics 6 Oil and gas 6
Steel 5 Electronics 5
Home building and Home building and
building products 5 building products 5
Source: Authors’calculations.
If our models could capture these industry-specific
problems, their explanatory power would surely rise.
Unfortunately, with so few years of data, there is no
systematic way to incorporate these effects in a model.
Researchers can, however, make a qualitative adjust-
ment to their forecasts if they believe that the default
rate in one of the largest industries in the high yield
market will rise into the double digits.
Conclusion
We have examined three factors that influence the
year-to-year variation in the aggregate default rate: the
riskiness of the bonds outstanding in the market, the
length of time they have been outstanding, and the state
of the economy. Our analysis has shown that each plays
a strong part in determining aggregate defaults, but
credit quality appears to be the most influential
factor. We also find that a downturn in the economy
leads to many more defaults when the composition of
Table 2
Highest Industry Default Rates on High Yield Bonds,
1983-92
Percent of Issuers
Industry Defaulting Year
Finance 23 1989
Textile and shoes 21 1990
Oil and gas 19 1986
Home building and building products 18 1990
Textile and shoes 17 1991
Retail 17 1991
Services 13 1991
Finance 13 1990
Oil and gas 12 1985
Air transportation 11 1990, 91
Sources: Salomon Brothers; authors’calculations.
Table 3
Largest Contributors to the Default Rate on High
Yield Bonds, by Industry, 1983-92
Industry Percent Year
Oil and gas 1.7 1986
Retail 1.7 1991
Finance 1.3 1989
Oil and gas 1.2 1984, 85
Finance 1.1 1990
Home building and building products 1.0 1990
Memo:
Average annual default rate for all industries 4.5 1981-94
Sources: Salomon Brothers; authors’calculations.
CURRENT ISSUES IN ECONOMICS AND FINANCE
the high yield market is skewed toward riskier bonds.
The sharply divergent experiences in the recessions of
the early 1980s and the recession of 1990-91 reflect
differences in these factors: The early high yield
market, with mostly fallen angels, had fewer risky
bonds that were vulnerable to the recessionary pres-
sures. The 1990-91 default rates, by contrast, reflected
a very speculative high yield market in the late 1980s.
What does our investigation tell us about the likeli-
hood of a sharp rise in default rates in the current
period? Given the conditions in the high yield market at
present, the default rate should not reach double digits
in the near future. High yield investors have become
more conservative since the late 1980s, often passing
up offerings of B3 or lower rated bonds. Moreover,
since 1991, many high yield firms have raised their
ratings by issuing equity and lowering their debt burdens.
This lower leverage further reduces the riskiness of the
market. Thus, even if the economy were to slow, the
effect on default rates should be moderate.
Notes
1. These bonds, pejoratively termed junk bonds, are rated BB, B,
or CCC by Standard & Poor’s (S&P) or Ba, B, or Caa by
Moody’s. The rating agencies further refine their assessments
with indicators that move a bond’s grade up or down a notch. For
example, S&P B-rated bonds comprise those rated B, B-, and B+,
where B+ is more creditworthy than B-, and Moody’s B category
comprises B1, B2, and B3 bonds, where B1 bonds are safer than
B3 bonds.
2. We calculated the Fons model over the period 1981-94 and
obtained the following results: actual default rate = -5.95 + 2.70 x
expected default rate - 0.65 x Blue Chip GDP forecast. Only the
coefficient for the the expected default rate was significant. The
model’s adjusted R-squared was 39 percent.
3. We calculated the Jonsson-Fridson model over the period 1981-94
and obtained the following results: actual default rate = 5.41 + 8.41 x
lagged B- or lower issuance + 0.004 x current liabilities of failed
business - 75.93 x corporate profits. All coefficients were signifi-
cant with at least 90 percent confidence. The model’s adjusted
R-squared was 84 percent.
4. See Fons, Carty, and Kaufman (1994).
5. In theory, we could calculate the expected default rate using
CCC+, CCC, and CCC- categories, but there are few such bonds.
6. We define slow growth as GDP growth of 1.5 percent or less. The
results hardly change if the figure is increased or decreased by
0.5 percentage point.
References
Altman, Edward I., and Vellore Kishore. 1995. “Report on Defaults
and Returns on High Yield Bonds: Analysis through 1994.”
New York University Salomon Center.
Brand, Leo, Thomas Kitto, and Reza Bahar. 1995. “Corporate
Defaults Level Off in 1994.” Standard & Poor’s CreditWeek,
May 1.
Fons, Jerome S. 1991. “An Approach to Forecasting Default Rates.”
Moody’s Special Report, August.
Fons, Jerome S., Lea Carty, and Jeremy Kaufman. 1994.
“Corporate Bond Defaults and Default Rates, 1970-1993.”
Moody’s Special Report, January.
Jonsson, Jon G., and Martin Fridson. 1996. “Forecasting Default
Rates on High Yield Bonds.” Journal of Fixed Income.
Forthcoming.
Salomon Brothers. 1992. High Yield Default Study.
About the Authors
Jean Helwege is an economist and Paul Kleiman a financial analyst in the Capital Markets Function of the
Research and Market Analysis Group.
Current Issues in Economics and Finance is published by the Research and Market Analysis Group of the Federal
Reserve Bank of New York. Dorothy Meadow Sobol is the editor.
Editorial Staff: Valerie LaPorte, Mike De Mott, Elizabeth Miranda
Production: Graphics and Publications Staff
Subscriptions to Current Issues are free. Write to the Public Information Department, Federal Reserve Bank of
New York, 33 Liberty Street, New York, N.Y. 10045-0001, or call 212-720-6134. Back issues are also available.
The views expressed in this article are those of the authors and do not necessarily reflect the position of
the Federal Reserve Bank of New York or the Federal Reserve System.