THE EURO AREA BANK LENDING SURVEY - JANUARY 2012 - docx
Bạn đang xem bản rút gọn của tài liệu. Xem và tải ngay bản đầy đủ của tài liệu tại đây (385.95 KB, 41 trang )
1 February 2012
THE EURO AREA BANK LENDING SURVEY
- JANUARY 2012 -
1. Overview of the results
The results reported in the January 2012 bank lending survey relate to changes during the last
quarter of 2011 and expectations of changes in the first quarter of 2012. The survey was conducted
between 19 December 2011 and 9 January 2012 on a sample of 124 euro area banks. The response
rate was 100%.
Three ad hoc questions were added to the questionnaire for the January 2012 survey round. The ad
hoc question dealing with the impact of the financial turmoil on access to wholesale funding was
amended to also include retail funding. In addition, a question on the impact of the sovereign debt
crisis and a question on the likely impact of ongoing regulatory changes on credit standards were
added.
According to the January 2012 bank lending survey (BLS), the net tightening of credit standards by euro
area banks surged in the fourth quarter of 2011 for credit standards on both loans to non-financial
corporations (35% in net terms, up from 16% in the preceding quarter) and loans to households for
house purchase (29%, up from 18% in the preceding quarter), and to a lesser extent on consumer credit
(13%, up from 10% in the preceding quarter). Looking ahead, euro area banks expect a further net
tightening of credit standards, albeit at a slower pace than in the fourth quarter of 2011.
Participating banks explained the surge in the net tightening of credit standards by the adverse
combination of a weakening economic outlook and the euro area sovereign debt crisis, which continued
to undermine the banking sector’s financial position. Increased market scrutiny of bank solvency risks in
the fourth quarter of 2011 is likely to have exacerbated banks’ funding difficulties. As a result, euro area
banks significantly tightened credit terms and conditions and raised interest rates on loans to non-
financial corporations (NFCs) and households.
Turning to indicators of credit demand, euro area banks reported a net decline in the demand for loans
to NFCs in the last quarter of 2011, albeit at a slower pace than in the previous quarter (-5% in net
terms, compared with -8% in the third quarter of 2011) and above expectations at the time of the previous
survey round. In particular, banks indicated a sharp fall in the financing needs of firms for their fixed
2
investment. The net demand for loans to households declined further in the fourth quarter of 2011,
broadly in line with previous expectations and with actual figures quoted in the previous survey round (-
27% in the last quarter of 2011, compared with -24% in the preceding quarter for loans for house
purchase, and -16% in the last quarter of 2011, compared with -15% in the third quarter for consumer
credit).
For the first quarter of 2012 banks expect a sizeable drop in the net demand for housing loans, while the
decline in net demand for consumer credit is expected to remain in the same range.
The January 2012 BLS round included three additional ad hoc questions. The replies to these are
summarised below:
• Regarding bank access to market funding, euro area banks reported a slight easing of access to
wholesale funding in the last quarter of 2011, compared with replies from the previous survey,
although still a large number of euro area banks (in net terms) continued to report significant
difficulties. This relative improvement was more visible for access to debt securities markets and
securitisation activity than for access to money markets. Looking ahead, banks across the euro area
overall expect some improvement in access to wholesale market funding in the next quarter,
potentially reflecting the anticipated effectiveness of non-standard measures taken by the ECB. The
access to retail funding was also seen as a challenging issue at the end of 2011, albeit less so, on
average, than access to wholesale funding. For the next quarter banks anticipate a mild improvement.
• On the impact of the sovereign debt crisis, banks indicated that sovereign market tensions led to a
substantial deterioration of their funding conditions through balance sheet and liquidity management
constraints, as well as through other, more indirect, channels. Banks also reported that
vulnerabilities to risks stemming from the sovereign crisis have significantly contributed to the
tightening of credit standards, although some parts of the banking system were in a position to shield
their lending policies from the impact of the crisis.
• Finally, on the impact of new regulatory requirements on banks’ lending policies, banks’ replies point
to a further adjustment of risk-weighted assets and capital positions during the second half of 2011, to
a larger extent than in the first half of the year and more than envisaged in July 2011. The same
applies for the impact of regulation on the net tightening of credit standards. In the coming months
banks indicate a further intensification of balance sheet adjustments and related constraints on the
bank lending channel.
3
General notes
The bank lending survey is addressed to senior loan officer
s of a representative sample of euro area
banks.
1
Its main purpose is to enhance the understanding of bank lending behaviour in the euro area.
2
The questions distinguish between three categories of loan: loans or credit lines to enterprises; loans to
hous
eholds for house purchase; and consumer credit and other lending to households. For all three
categories, questions are posed on credit standards for approving loans; credit terms and conditions; and
credit demand and the factors affecting it.
The response
s to questions related to credit standards are analysed in this report by focusing on the
difference (“net percentage”) between the share of banks reporting that credit standards have been
tightened and the share of banks reporting that they have been eased. A positive net percentage indicates
that a larger proportion of banks have tightened credit standards (“net tightening”), whereas a negative net
percentage indicates that a larger proportion of banks have eased credit standards (“net easing”).
Likewise,
the term “net demand” refers to the difference between the share of banks reporting an increase
in loan demand and the share of banks reporting a decline. Net demand will therefore be positive if a
larger proportion of banks have reported an increase in l
oan demand, whereas negative net demand
indicates that a larger proportion of banks have reported a decline in loan demand.
In addition, an alternative measure of the responses to questions related to changes in credit standards and
net demand is included.
This measure is the weighted difference (“diffusion index”) between the share of
banks reporting that credit standards have been tightened and the share of banks reporting that they have
been eased. Likewise, regarding the demand for loans, the diffusion
index refers to the weighted
difference between the share of banks reporting an increase in loan demand and the share of banks
reporting a decline. The diffusion index is constructed in the following way: l
enders who have answered
“considerably” are given
a weight twice as high (score of 1) as lenders having answered “somewhat”
(score of 0.5). The interpretation of the diffusion indices follows the same logic as
the interpretation of
net percentages.
The survey questions are phrased in terms of changes over the past three months (in this case in the last
quarter of 2011) or expectations of changes over the next three months (i.e. in the first quarter of 2012).
Detailed tables and charts on the responses are provided in Annex 1 for the individual questions and in
Annex 2 for the ad hoc questions.
A copy of the questionnaire can be found at:
1
The sample group of banks participating in the survey comprises 124 banks, representing all of the euro area countries, and
takes into account the characteristics of their respective national banking structures. Since the banks in the sample group differ
considerably in size, the survey results are weighted according to the national shares in total outstanding euro area lending to
euro area residents.
2
For more detailed information on the bank lending survey, see the ECB press release of 21 November 2002 entitled “Bank
lending survey for the euro area”, the article entitled “A bank lending survey for the euro area” in the April 2003 issue of the
ECB’s Monthly Bulletin and J. Berg et al. (2005), “The bank lending survey for the euro area”, ECB Occasional Paper No 23.
4
2. Developments in credit standards and net demand for loans
2.1 Enterprises
Surge in the tightening of credit standards on loans to enterprises
According to the January 2012 BLS, the net tightening of banks’ credit standards on loans to non-
financial corporations surged in the last quarter of 2011, to 35% from 16% in the preceding quarter (see
Chart 1). This is higher than anticipated by survey participants at the time of the previous survey round
(when it stood at 22%). In net terms, the tightening of credit standards appears to have been applied more
to large firms than to small and medium-sized enterprises (SMEs). The net tightening of credit standards
on loans to SMEs rose from 14% in the third quarter of 2011 to 28% in the last quarter of the year, and
that of credit standards on loans to large firms increased from 19% to 44%. Compared with the previous
survey round, the net tightening of credit standards increased for both long-term and short-term loans.
However, the tightening of credit conditions was still reported to be applied more often on long-term
loans (42% in the last quarter of 2011, compared with 20% in the preceding quarter) than on short-term
ones (24% in the last quarter of 2011, compared with 11% in the preceding quarter).
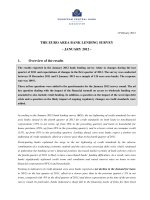
Chart 1. Changes in credit standards applied to the approval of loans
or credit lines to enterprises
(net percentages of banks contributing to tightening standards)
-10
0
10
20
30
40
50
10Q1
10Q4
11Q3
10Q1
10Q4
11Q3
10Q2
11Q1
11Q4
10Q3
11Q2
10Q1
10Q4
11Q3
-10
0
10
20
30
40
50
actual expected
FACTORS CONTRIBUTING TO
TIGHTENING CREDIT STANDARDS
Access to
market
financing
Costs
related to
bank's
capital
position
Expectat.
general
economic
activity
Bank's
liquidity
position
Notes: “Realised” values refer to changes that have occurred, while “expected” values are changes anticipated by banks. Net
percentages are defined as the difference between the sum of the percentages of banks responding “tightened considerably”
and “tightened somewhat” and the sum of the percentages of banks responding “eased somewhat” and “eased considerably”.
The net percentages for responses to questions related to the factors are defined as the difference between the percentage of
banks reporting that the given factor contributed to a tightening and the percentage reporting that it contributed to an easing.
Turning to the factors explaining the developments in credit standards, the net percentage of euro area
banks reporting that cost of funds and balance sheet constraints had a bearing on their credit standards
5
policy increased markedly. Specifically, in the last quarter of 2011, 28% of euro area banks reported
difficulties in accessing market financing, compared with 20% in the previous survey round (see Chart
1). This situation led to challenging liquidity positions: in net terms, 27% of euro area banks reported
their liquidity position to have a role in explaining tightened credit standards in the last quarter of 2011,
compared with 14% in the previous quarter. Recapitalisation pressures also increased as 20% of euro area
banks in net terms suggested that their capital position required credit standards to be tightened in the last
quarter of 2011 (compared with 12% in the previous quarter).
Balance sheet and funding constraints were compounded by a deteriorating economic environment.
Weaker expectations concerning the economic outlook contributed to tighter credit standards for 40% of
euro area banks in net terms, after 16% in the previous survey round. The contribution of collateral risk to
the tightening of credit standards, which had been mildly positive during most of 2011, increased
substantially in the last quarter of the year, surging to 19% in net terms, compared with 8% in the
previous quarter. Finally, counterbalancing factors, like competitive pressure, which generally works in
the direction of an easing of credit standards, were reported to stay broadly neutral in the last quarter of
2011, as in the previous quarter.
Chart 2. Changes in terms and conditions for approving loans or credit lines to enterprises
(net percentages of banks reporting tightening terms and conditions)
-10
0
10
20
30
40
50
10Q1
10Q3
11Q1
11Q3
10Q1
10Q3
11Q1
11Q3
10Q1
10Q3
11Q1
11Q3
10Q1
10Q3
11Q1
11Q3
Collateral
requirements
Margins on
average loans
Non-interest
rate charges
Margins on
riskier loans
Note: See the notes to Chart 1.
In line with the net percentage change in credit standards, all terms and conditions reported by euro area
banks were tightened in the last quarter of 2011, by even more than in the previous quarter. In particular,
44% of euro area banks – in net terms – revised up their margins on average loans (compared with 18% in
the preceding quarter) and 49% of the banks did so on riskier loans (compared with 31% in the third
quarter of 2011). The increase in the net tightening of other terms and conditions (i.e. non-interest rate
charges, collateral requirements, and loan size and maturity) was also significant for the first time in the
6
year, possibly indicating that quantitative credit restrictions may come into play. For example, 18% of
euro area banks reported having increased their non-interest rate charges in the last quarter of 2011
(compared with 4% in the third quarter) and 25% of euro area banks reported having reduced the size of
their loans (after 8% in the third quarter).
Looking forward, on balance, euro area banks expect a further increase in the tightening of credit
standards on loans to NFCs in the first quarter of 2012 (to 25% in net terms). This expected further
tightening is seen as affecting more large firms (34%) than SMEs (19%) as well as primarily long-term
loans.
Continued decrease in the demand for loans to non-financial corporations
In the last quarter of 2011 net demand for loans to NFCs was reported to have declined further, albeit to a
lesser extent than in the previous quarter (-5%, compared with -8% in the third quarter of 2011; see Chart
3).
Chart 3. Changes in demand for loans or credit lines to enterprises
(net percentages of banks reporting a positive contribution to demand)
-50
-30
-10
10
30
50
70
10Q1
10Q4
11Q3
10Q1
10Q4
11Q3
10Q2
11Q1
11Q4
10Q3
11Q2
10Q1
10Q4
11Q3
-50
-30
-10
10
30
50
70
actual expected
FACTORS CONTRIBUTING TO INCREASING DEMAND
Inventories
and working
capital
Fixed
investm.
Issuance of
debt
securities
Internal
financing
Notes: “Realised” values refer to changes that have occurred, while “expected” values are changes anticipated by banks. Net
percentages for the questions on demand for loans are defined as the difference between the sum of the percentages of banks
responding “increased considerably” and “increased somewhat” and the sum of the percentages of banks responding
“decreased somewhat” and “decreased considerably”. The net percentages for responses to questions related to the factors are
defined as the difference between the percentage of banks reporting that the given factor contributed to increasing demand
and the percentage reporting that it contributed to decreasing demand.
This decline was driven by a moderation in the pace of economic activity, as reflected by the slightly
negative contribution of financing needs linked to inventories and working capital. More importantly, the
need to finance fixed investment fell sharply (-20% in net terms, compared with -6% in the previous
quarter). The decline in net demand for loans was more pronounced for SMEs in the last quarter of 2011
(-7% in net terms, compared with -3% in the previous survey round), while net loan demand was broadly
7
unchanged for large firms (at -2% in net terms, compared with -3% in the previous quarter). Euro area
banks also reported that NFCs may have turned more towards alternative sources of finance, which could
explain the decline in demand for loans. In particular, 9% of euro area banks, in net terms, reported that
the use of internal financing dampened demand for loans, compared with 3% in the previous survey
round.
2.2 Households
Further net tightening of credit standards on loans to households for house purchase
Euro area banks also reported a significant increase in the net tightening of credit standards on loans to
households for house purchase. The net percentage of banks reporting a tightening of credit standards on
mortgage loans stood at 29% in the last quarter of 2011, up from 18% in the preceding quarter and higher
than expected. Similarly to corporate loans, increased cost of market funding and balance sheet
constraints were put forward as key driving factors behind these developments (see Chart 4).
Chart 4. Changes in credit standards applied to the approval of loans
to households for house purchase
(net percentages of banks reporting a contribution to tightening credit standards)
-10
0
10
20
30
40
10Q1
10Q4
11Q3
10Q1
10Q4
11Q3
10Q2
11Q1
11Q4
10Q3
11Q2
10Q1
10Q4
11Q3
-10
0
10
20
30
40
actual
expected
FACTORS CONTRIBUTING TO TIGHTENING CREDIT
STANDARDS
Competitio
n from
other banks
Costs of
funds and
balance
sheet
constraints
Housing
market
prospects
Expectat.
General
economic
activity
Note: See the notes to Chart 1.
In addition, the deterioration in economic prospects was reported to contribute significantly to the
increase in the net tightening of credit standards on mortgage loans, albeit less so than pure supply-side
factors. More importantly, the increase in the perception of risk at the euro area level appears to be driven
by the deterioration in the general economic outlook. Competitive pressures, either from banks or
alternative sources of finance, were reported to remain broadly neutral.
Unlike in the last survey round, the reported increase in the tightening of overall credit standards on loans
to households for house purchase did translate into a substantial further tightening of price terms and
conditions. The net percentage of euro area banks reporting an increase in margins on average loans
8
increased from 10% in the third quarter of 2011 to 29% in the fourth quarter of 2011. Similarly, the net
percentage of euro area banks reporting having raised their margins on riskier loans in the fourth quarter
of 2011 stood at 33%, up from 14% in the third quarter of 2011. In addition, most non-price terms and
conditions were generally reported to have been tightened.
Looking ahead, 24% of euro area banks (in net terms) expect a tightening of credit standards on loans to
households for house purchase in the first quarter of 2012, somewhat lower than currently reported for the
last quarter of the year.
Substantial contraction of housing loan demand
Euro area banks also reported a strong further contraction in the demand for mortgage loans in the last
quarter of the year (-27% in net terms, from -24% in the preceding quarter; see Chart 5). This was mainly
on account of a clear deterioration of housing market prospects (-27%, compared with -22% in the
previous survey round) and weakening consumer confidence (-34%, compared with -24% in the
preceding quarter). Financing needs for non-housing consumption, household savings and competitive
pressures were also reported to contribute negatively to the demand for mortgage loans, although in
proportions similar to in the previous survey round. Looking ahead, 44% of euro area banks (in net terms)
expect demand for loans for house purchase to decline further in the first quarter of 2012.
Chart 5. Changes in demand for loans to households
(net percentages of banks reporting a positive contribution to demand)
-50
-30
-10
10
30
50
10Q1
10Q2
10Q3
10Q4
11Q1
11Q2
11Q3
11Q4
12Q1
10Q1
10Q2
10Q3
10Q4
11Q1
11Q2
11Q3
11Q4
12Q1
-50
-30
-10
10
30
50
actual expected
Consumer credit
House purchase
Note: See the notes to Chart 3.
9
Tightening of credit standards also applied to consumer loans
The net tightening of credit standards for consumer credit increased marginally, to 13% in the last quarter
of the year from 10% in the previous survey round, which was slightly above expectations (see Chart 6).
This tightening was mainly driven by a deterioration of supply-side concerns (i.e. cost of funding and
balance sheet constraints), while there was little change in the assessment of the risk environment (i.e. the
creditworthiness of loan applicants and, more generally, the economic outlook) between the third and
fourth quarters of 2011. The renewed tightening of credit standards on consumer credit translated into a
clear increase in price terms and conditions, as seen for housing loans. The net percentage of banks
reporting an increase in their margins rose between the third and fourth quarters of 2011, while the
contribution of non-price terms and conditions hardly changed.
Looking ahead, 11% of euro area banks (in net terms) expect a tightening of credit standards on consumer
credit in the first quarter of 2012.
Chart 6. Changes in credit standards applied to the approval of consumer credit
and other lending to households
(net percentages of banks contributing to tightening credit standards)
-10
0
10
20
30
10Q1
10Q4
11Q3
10Q1
10Q4
11Q3
10Q2
11Q1
11Q4
10Q3
11Q2
10Q1
10Q4
11Q3
-10
0
10
20
30
actual expected
FACTORS CONTRIBUTING TO TIGHTENING CREDIT
STANDARDS
Competit
from other
banks
Costs of
funds and
balance
sheet
constraints
Creditworthi
ness of
consumer
Expectat.
General
economic
activity
Note: See the notes to Chart 1.
Net demand for consumer credit still declining
Net demand for consumer credit fell to -16% in the fourth quarter of 2011, from -15% in the previous
survey round. This fall was mainly explained by lower household spending on durable goods (-20% in the
last quarter of 2011, compared with -14% in the preceding survey) and a decrease in consumer confidence
(to -20% in the last quarter of 2011, from -18% in the third quarter).
Looking forward, in the last quarter of the year, euro area banks continued to expect negative
developments in net demand for consumer credit (-18%).
10
3. Ad hoc questions
Slight easing of access to money and debt securities markets
As in previous surveys, the January 2012 survey questionnaire included a question which aimed at
assessing the extent to which financial market tensions affected banks’ credit standards for loans and
credit lines to enterprises and households and the extent to which they were expected to affect them in the
next three months. For the first time, the question also aimed to assess access to retail funding.
3
Chart 7. Banks’ assessment of funding conditions and the ability to transfer risk
(net percentages of banks reporting deteriorated market access)
-10
0
10
20
30
40
50
60
70
80
Short-term deposit
Long-term deposits and
other retail funding
instruments
Very short-term money
market
Short-term money market
Short-term debt securities
Medium to long-term debt
securities
Securitisation of corporate
loans
Securitisation of loans for
house purchase
Ability to transfer credit risk
off balance sheet
Q2 2011 Q3 2011 Q4 2011
Q1 2012 expected
Retail funding
Wholesale funding
Note: The net percentages are defined as the difference between the sum of the percentages for “deteriorated considerably”
and “deteriorated somewhat” and the sum of the percentages for “eased somewhat” and “eased considerably".
Euro area banks reported a slight easing of access to wholesale funding in the fourth quarter of 2011,
compared with replies from the previous survey round (see Chart 7). This was particularly true for
security issuance conditions, securitisation and banks’ ability to transfer risk off their balance sheets.
However, despite the slight easing of access to money markets, between 40% and 50% of euro area banks
in net terms continued to report difficulties. With the intensification of the sovereign debt crisis, money
market financing has become more difficult in all euro area countries.
3
The results shown are calculated as a percentage of the number of banks which did not reply “not applicable”.
11
Looking ahead, euro area banks expect a stabilisation in the conditions of access to wholesale market
funding and less of a deterioration in securitisation conditions in the first quarter of 2012. The
exacerbation of bank funding problems against the background of challenging sovereign debt markets led
the ECB to take a number of non-standard measures to alleviate funding constraints and ensure an
adequate functioning of the bank lending channel. This may partly explain banks’ expectations regarding
their access to funding for the first quarter of 2012.
A new feature of this ad hoc question is to also consider access to retail funding, both short and long-
term. In this regard, euro area banks also pointed to a challenging environment in the last quarter of 2011,
albeit less so, on average, than for access to wholesale funding.
Evidence of sovereign debt crisis spillover to the banking sector
One of the most immediate effects of the euro area sovereign debt crisis has clearly been on the banking
sector. In principle, bank funding conditions can be primarily affected through two direct channels:
• First, the lower quality of government debt weakens bank balance sheets, increasing their riskiness
as counterparties and, in turn, making funding more costly and more difficult to obtain.
• Second, higher sovereign debt risk reduces the value of collateral that banks can use to raise
wholesale funding.
Beyond this, other factors may relate sovereign market tensions to bank funding conditions. Notably, the
weaker financial positions of governments have lowered the funding benefits that banks derive from
implicit or explicit government guarantees. Financial contagion from sovereign to sovereign or from
sovereign to banks may also be at play.
Replies from the January survey show that all channels have operated to a broadly similar extent. About
30% of euro area banks (in net terms) attributed the deterioration of funding conditions to the sovereign
debt crisis through one channel or the other, with the effect of reduced collateral value being the reason
most often quoted. Interestingly, when asked how the sovereign debt crisis translated into credit standards
policy, a smaller number of banks (in net terms) acknowledged an impact on the tightening of their credit
standards (about 23% on average for loans to NFCs and about 15% for loans to households; see Chart 8).
This suggests that banks have managed to shield somewhat their lending policy from the liquidity
constraints associated with the sovereign debt crisis. However, these constraints have not been the only
source of tightening for lending policies.
12
Chart 8. Impact of the sovereign debt crisis on banks’ funding conditions and credit standards
(net percentages of banks reporting an impact on funding conditions or on the tightening of credit standards)
0
5
10
15
20
25
30
35
Direct
exposure to
sovereign
Value of
sovereign
collateral
Other effects
Direct
exposure to
sovereign
Value of
sovereign
collateral
Other effects
Direct
exposure to
sovereign
Value of
sovereign
collateral
Other effects
Direct
exposure to
sovereign
Value of
sovereign
collateral
Other effects
Loans or credi t l i nes to
enterpri s es
Loans to households for
house purchase
Loans to households for
consumer credit and other
lending
Impact on your bank's
funding conditions
Impact on your bank's credit standards
Note: The net percentages are defined as the difference between the sum of the percentages for “contributed to a
deterioration of funding conditions/tightening of credit standards considerably” and “somewhat
” and the sum of the
percentages for “contributed to an easing of funding conditions/easing of credit standards somewhat” and “considerably".
Evidence of gradual adjustment to new regulations and requirements
Finally, the January 2012 survey questionnaire included in addition two ad hoc questions which aimed at
assessing the extent to which new regulatory requirements affected banks’ lending policies via the
potential impact on their capital position and the credit standards that they apply to loans. These new
requirements cover the regulations set out in “Basel III” agreements
4
, the recent measures of the
European Banking Authority
5
or any other specific national regulations concerning banks’ capital ratios
that have recently been approved or are expected to be approved in the near future.
According to banks’ replies,
6
34% of respondents (in net terms) reported a decline in their risk-weighted
assets during the past six months and 43% expect a further decline during the next six months in order to
comply with new regulatory requirements (see Chart 9). This adjustment process was and is expected to
concern more specifically riskier (as opposed to average) loans. As regards the effect of regulation on
4
See Basel III: A global regulatory framework for more resilient banks and banking systems, Basel Committee on Banking
Supervision, Bank for International Settlements, 16 December 2010 (
5
The EBA set capital targets for 70 European banks, consisting of two parts to be implemented by June 2012. The first part is
a temporary capital buffer against sovereign exposures at market prices as of September 2011. The second part consists in
raising core Tier 1 capital ratios to 9%, while avoiding excessive deleveraging.
6
The results shown are calculated as a percentage of the number of banks which did not reply “not applicable”.
13
their capital position, on balance, 42% of the banks noted an increase in their capital position during the
past six months and 34% expect some increase in the first half of 2012. In the last six months the rise in
banks’ capital positions was achieved more by the issuance of new shares than via retained earnings.
Compared with survey replies to the same question in the July 2011 BLS, it is clear that the process of
adjusting to new regulatory requirements via the reduction of risk-weighted assets accelerated somewhat
during the second half of 2011 and is expected to accelerate further in the first half of 2012, while the
adjustment of capital positions is ongoing. It is interesting to compare what is reported to have been
implemented in the second half of 2011 with what was expected in July. Euro area banks actually had to
implement more risk-weighted asset shedding and strengthen their capital position more than initially
expected.
Chart 9. Impact of Basel III and other regulatory requirements on banks’ risk-weighted assets and capital
position (net percentages of banks)
-50
-40
-30
-20
-10
0
10
20
30
40
50
average
loans
riskier
loans
Retained
earnings
Share
issuance
average
loans
riskier
loans
Retained
earnings
Share
issuance
average
loans
riskier
loans
Retained
earnings
Share
issuance
Ri s k-wei ghted
assets, of which
Capital position,
of which
Ri s k-wei ghted
assets, of which
Capital position,
of which
Ri s k-wei ghted
assets, of which
Capital position,
of which
2011H1 2011H2 2012H1
July 2011 BLS
Jan 2012 BLS
Note: The net percentages are defined as the difference between the sum of the percentages for “increased considerably” and
“increased somewhat” and the sum of the percentages for “decreased somewhat” and “decreased considerably". July 2011
BLS replies for the second half of 2011 correspond to expectations.
Looking ahead, a higher net percentage of euro area banks plan on reducing their risk-weighted assets in
2012 than did in 2011. They also expect to continue to reinforce their capital base, although less so (in net
terms) than in 2011.
Chart 10 shows euro area banks’ replies regarding the impact of new regulatory requirements on their
lending policies and the tightening of their credit standards. In net terms, a third of euro area banks
acknowledged that they have tightened their credit standards on loans to large enterprises as a result of
adjustments to new regulations and capital requirements. This is more than the net percentage of banks
tightening their credit standards on loans to SMEs (21% on average) or on loans to households (11% on
14
average). It is also significantly higher than what was expected in the July 2011 BLS round (respectively
18%, 10% and 5%).
For the first half of 2012 banks expect an increase in the net tightening of credit standards due to
regulatory pressures. Compared with the second half of 2011 the exacerbated effects on bank lending
policy are anticipated to primarily affect large firms and house purchase financing. Since the first half of
2011 an acceleration in the pace of tightening implemented by euro area banks has also been noticeable.
Chart 10. Contribution of Basel III and other regulatory requirements to the tightening of credit standards
(net percentages of banks)
0
5
10
15
20
25
30
35
40
45
SMEs
Large
Firms
House
Purchase
Consumer
credit
SMEs
Large
Firms
House
Purchase
Consumer
credit
SMEs
Large
Firms
House
Purchase
Consumer
credit
2011H1 2011H2 2012H1
Jul 2011 BLS Jan 2012 BLS
Note: The net perce
ntages are defined as the difference between the sum of the percentages for contributing “considerably” or
“somewhat” to tightening credit standards and the sum of the percentages for contributing “somewhat” and “considerably" to
an easing of credit standards.
15
ANNEX I: RESULTS FOR THE INDIVIDUAL QUESTIONS
I. Loans or credit lines to enterprises
1. Over the past three months, how have your bank’s credit standards as applied to the approval of
loans or credit lines to enterprises changed?
Oct Jan Oct Jan Oct Jan Oct Jan Oct Jan
Tightened considerably 5% 6% 4% 4% 6% 8% 4% 5% 5% 10%
Tightened somewhat 12% 31% 10% 25% 13% 37% 7% 21% 15% 33%
Remained basically unchanged 84% 62% 86% 70% 81% 53% 89% 72% 80% 56%
Eased somewhat 0% 2% 0% 1% 0% 2% 0% 2% 0% 1%
Eased considerably 0% 0% 0% 0% 0% 0% 0% 0% 0% 0%
Total 100% 100% 100% 100% 100% 100% 100% 100% 100% 100%
Net percentage 16% 35% 14% 28% 19% 44% 11% 24% 20% 42%
Diffusion index 10% 20% 9% 16% 12% 26% 8% 15% 12% 26%
Mean 2.79 2.60 2.82 2.68 2.75 2.48 2.85 2.71 2.75 2.47
Standard deviation 0.52 0.64 0.50 0.60 0.58 0.69 0.48 0.61 0.56 0.71
Number of banks responding 117 118 115 115 112 113 117 118 116 117
Long-term loans
Overall
Loans to small
and medium-
sized enterprises
Loans to large
enterprises
Short-term loans
Notes: Net percentage is defined as the difference between the sum of the percentages for “tightened considerably” and “tightened somewhat”
and the sum of the percentages for “eased somewhat” and “eased considerably”. The diffusion index is defined as the net percentage weighted
according to the intensity of the response, giving lenders who have answered “considerably” a weight twice as high (score of 1) as lenders
having answered “somewhat” (score of 0.5).
The mean and standard deviation are calculated by attributing the values 1 to 5 starting with the first possible answer and consequently for the
other answers. These values are then multiplied with the corresponding (weighted) percentages.
Chart 1. Changes in credit standards applied to the approval of loans or credit lines to enterprises
(net percentages of banks contributing to tightening standards)
-10
0
10
20
30
40
50
09Q4
10Q3
11Q2
12Q1
10Q2
11Q1
11Q4
10Q1
10Q4
11Q3
09Q4
10Q3
11Q2
12Q1
10Q2
11Q1
11Q4
-10
0
10
20
30
40
50
actual
expected
Overall
Large
enterprises
Small and
medium-sized
enterprises
Long-term
loans
Short-term
loans
16
2. Over the past three months, how have the following factors affected your bank’s credit standards
as applied to the approval of loans or credit lines to enterprises?
OVERALL SME LARGE
- ° + ++ NA - ° + ++ NA - ° + ++ NA
A) Cost of funds and balance sheet constraints
Costs related to your bank's capital position 4% 17% 70% 2% 0% 7% 4% 10% 74% 2% 0% 11% 6% 20% 57% 2% 0% 15%
Your bank's ability to access market financing 8% 20% 61% 0% 0% 11% 8% 10% 67% 1% 0% 15% 9% 23% 51% 0% 0% 18%
Your bank's liquidity position 8% 20% 65% 0% 0% 8% 8% 14% 67% 0% 0% 12% 8% 22% 55% 0% 0% 16%
B) Pressure from competition
Competition from other banks 1% 5% 81% 5% 0% 8% 1% 1% 83% 4% 0% 11% 1% 3% 74% 5% 0% 16%
Competition from non-banks 1% 0% 84% 2% 0% 13% 1% 0% 79% 2% 0% 18% 1% 0% 79% 2% 0% 18%
Competition from market financing 1% 0% 83% 2% 0% 14% 1% 0% 79% 2% 0% 18% 1% 2% 77% 2% 0% 18%
C) Perception of risk
Expectations regarding general economic activity 3% 39% 51% 2% 0% 6% 3% 34% 54% 1% 0% 8% 4% 36% 44% 2% 0% 14%
Industry or firm-specific outook 4% 30% 57% 4% 0% 6% 7% 24% 59% 2% 0% 8% 7% 28% 49% 3% 0% 14%
Risk on collateral demanded 1% 19% 72% 2% 0% 6% 1% 19% 71% 1% 0% 8% 2% 18% 65% 2% 0% 14%
Summary statistics OVERALL SME LARGE
Oct Jan Oct Jan Oct Jan Oct Jan Oct Jan Oct Jan Oct Jan Oct Jan Oct Jan Oct Jan Oct Jan Oct Jan
A) Cost of funds and balance sheet constraints
Costs related to your bank's capital position 12% 20% 7% 12% 2.85 2.74 0.42 0.59 5% 12% 3% 8% 2.93 2.82 0.37 0.54 12% 24% 8% 15% 2.83 2.64 0.52 0.67
Your bank's ability to access market financing 20% 28% 12% 18% 2.75 2.62 0.52 0.66 9% 16% 6% 12% 2.88 2.74 0.44 0.67 16% 31% 11% 20% 2.77 2.55 0.59 0.69
Your bank's liquidity position 14% 27% 8% 17% 2.83 2.62 0.49 0.66 7% 21% 4% 14% 2.92 2.68 0.36 0.65 13% 30% 9% 19% 2.79 2.56 0.62 0.67
B) Pressure from competition
Competition from other banks -3% 1% -2% 1% 3.04 2.97 0.33 0.43 -2% -1% -1% 0% 3.03 2.99 0.26 0.37 -3% -1% -1% 0% 3.03 2.99 0.20 0.44
Competition from non-banks 1% -1% 1% 0% 2.99 2.98 0.13 0.33 -1% -1% -1% 0% 3.02 2.97 0.14 0.36 -1% -1% -1% 0% 3.02 2.98 0.14 0.33
Competition from market financing 1% -1% 0% 0% 2.99 2.98 0.09 0.33 -1% -1% 0% 0% 3.01 2.98 0.17 0.34 -1% 1% 0% 1% 3.01 2.96 0.16 0.36
C) Perception of risk
Expectations regarding general economic activity 16% 40% 9% 21% 2.81 2.55 0.50 0.61 12% 36% 7% 19% 2.86 2.59 0.45 0.60 12% 38% 8% 21% 2.83 2.53 0.54 0.64
Industry or firm-specific outook 22% 30% 12% 17% 2.74 2.64 0.56 0.66 17% 29% 9% 18% 2.80 2.61 0.49 0.70 21% 32% 12% 19% 2.73 2.56 0.61 0.71
Risk on collateral demanded 8% 19% 4% 10% 2.91 2.79 0.33 0.50 6% 19% 3% 10% 2.92 2.78 0.36 0.48 8% 17% 5% 9% 2.89 2.79 0.38 0.52
NetP
DI
M
SD
NetP
DI
M
SD
NetP
DI
M
SD
NA = Not available; NetP = Net percentage; DI = Diffusion index; M = Mean; SD = Standard deviation
Notes: Column “Net percentage” is defined as the difference between the sum of “- -“ (contributed considerably to tightening) and “-“
(contributed somewhat to tightening) and the sum of “+” (contributed somewhat to easing) and “+ +” (contributed considerably to easing).”°”
means contributed to basically unchanged. The diffusion index is defined as the net percentage weighted according to the intensity of the
response, giving lenders who have answered “considerably” a weight twice as high (score of 1) as lenders having answered “somewhat” (score
of 0.5).
17
Chart 2a. Factors affecting credit standards applied to the approval of loans or credit lines to enterprises
(net percentages of banks contributing to tightening standards)
OVERALL
-10
0
10
20
30
40
10Q4
11Q1
11Q2
11Q3
11Q4
10Q4
11Q1
11Q2
11Q3
11Q4
10Q4
11Q1
11Q2
11Q3
11Q4
10Q4
11Q1
11Q2
11Q3
11Q4
10Q4
11Q1
11Q2
11Q3
11Q4
10Q4
11Q1
11Q2
11Q3
11Q4
-10
0
10
20
30
40
Costs related
to bank's
capital
position
Bank's ability
to access
market
financing
Bank's
liquidity
position
Expectations
regarding
general
economic
activity
Industry
or firm-
specific
Risk on
collateral
demanded
Chart 2b. Factors affecting credit standards applied to the approval of loans or credit lines to enterprises
(net percentages of banks contributing to tightening standards)
OVERALL
-10
-5
0
5
10Q4
11Q1
11Q2
11Q3
11Q4
10Q4
11Q1
11Q2
11Q3
11Q4
10Q4
11Q1
11Q2
11Q3
11Q4
-10
-5
0
5
Competition from
other banks
Competition
from non-banks
Competition from
market financing
18
3. Over the past three months, how have your bank’s conditions and terms for approving loans or
credit lines to enterprises changed?
OVERALL SME LARGE
- ° + ++ NA - ° + ++ NA - ° + ++ NA
A) Price
Your bank's margin on average loans 13% 34% 45% 3% 0% 6% 13% 30% 44% 5% 0% 8% 15% 34% 36% 3% 0% 13%
Your bank's margin on riskier loans 12% 38% 42% 2% 0% 6% 11% 34% 43% 4% 0% 8% 17% 34% 34% 3% 0% 13%
B) Other conditions and terms
Non-interest rate charges 2% 17% 75% 0% 0% 6% 0% 16% 74% 2% 0% 9% 2% 18% 66% 1% 0% 13%
Size of the loan or credit line 5% 21% 67% 1% 0% 6% 3% 14% 72% 3% 0% 8% 8% 22% 56% 1% 0% 13%
Collateral requirements 2% 16% 77% 0% 0% 6% 2% 15% 73% 3% 0% 8% 3% 17% 68% 0% 0% 13%
Loan covenants 1% 17% 75% 1% 0% 6% 1% 12% 76% 3% 0% 9% 2% 18% 64% 2% 0% 13%
Maturity 3% 23% 69% 0% 0% 6% 3% 21% 67% 2% 0% 8% 2% 27% 57% 0% 1% 13%
Summary statistics OVERALL SME LARGE
Oct Jan Oct Jan Oct Jan Oct Jan Oct Jan Oct Jan Oct Jan Oct Jan Oct Jan Oct Jan Oct Jan Oct Jan
A) Price
Your bank's margin on average loans 18% 44% 9% 28% 2.81 2.41 0.66 0.78 12% 37% 6% 25% 2.89 2.48 0.61 0.82 20% 45% 12% 30% 2.74 2.33 0.75 0.82
Your bank's margin on riskier loans 31% 49% 17% 31% 2.64 2.36 0.70 0.75 23% 41% 12% 26% 2.75 2.45 0.66 0.79 34% 49% 20% 33% 2.55 2.26 0.79 0.83
B) Other conditions and terms
Non-interest rate charges 5% 18% 2% 10% 2.96 2.79 0.31 0.47 4% 14% 2% 7% 2.96 2.85 0.33 0.43 2% 19% 1% 10% 2.97 2.77 0.39 0.52
Size of the loan or credit line 8% 25% 5% 15% 2.90 2.68 0.47 0.61 1% 15% 1% 9% 2.98 2.81 0.37 0.56 9% 29% 6% 19% 2.87 2.60 0.57 0.69
Collateral requirements 6% 18% 4% 10% 2.92 2.81 0.41 0.45 2% 14% 2% 8% 2.98 2.85 0.38 0.49 8% 20% 5% 11% 2.90 2.76 0.46 0.51
Loans covenants 8% 17% 5% 9% 2.89 2.80 0.43 0.48 3% 9% 2% 5% 2.97 2.89 0.33 0.44 8% 18% 5% 10% 2.89 2.77 0.46 0.56
Maturity 10% 26% 6% 14% 2.88 2.70 0.39 0.54 5% 22% 3% 12% 2.94 2.74 0.36 0.56 14% 28% 8% 14% 2.83 2.69 0.46 0.62
NetP
DI
M
SD
NetP
DI
M
SD
NetP
DI
M
SD
NA = Not available; NetP = Net percentage; DI = Diffusion index; M = Mean; SD = Standard deviation
Notes: Column “Net percentage” is defined as the difference between the sum of “- -“ (tightened considerably) and “-“ (tightened somewhat)
and the sum of “+” (eased somewhat) and “+ +” (eased considerably). ”°” means remained basically unchanged. The diffusion index is
defined as the net percentage weighted according to the intensity of the response, giving lenders who have answered “considerably” a weight
twice as high (score of 1) as lenders having answered “somewhat” (score of 0.5).
Chart 3. Changes in terms and conditions for approving loans or credit lines to enterprises
(net percentages of banks reporting tightening terms and conditions)
OVERALL
-5
5
15
25
35
45
55
10Q4
11Q2
11Q4
11Q1
11Q3
10Q4
11Q2
11Q4
11Q1
11Q3
10Q4
11Q2
11Q4
11Q1
11Q3
10Q4
11Q2
11Q4
Size of loan
or credit
line
Collateral
requirements
Loan
covenants
Non-
interest rate
charges
Maturity
Margins on
average
loans
Margins on
riskier
loans
19
20
4. Over the past three months, how has the demand for loans or credit lines to enterprises changed at
your bank, apart from normal seasonal fluctuations?
Oct Jan Oct Jan Oct Jan Oct Jan Oct Jan
Decreased considerably 1% 4% 0% 2% 1% 4% 0% 2% 1% 7%
Decreased somewhat 18% 18% 17% 22% 14% 16% 17% 18% 17% 17%
Remained basically unchanged 72% 63% 69% 60% 73% 63% 71% 65% 68% 53%
Increased somewhat 9% 16% 14% 17% 10% 16% 11% 14% 13% 21%
Increased considerably 1% 0% 0% 0% 2% 1% 1% 1% 1% 3%
Total 100% 100% 100% 100% 100% 100% 100% 100% 100% 100%
Net percentage -8% -5% -3% -7% -3% -2% -4% -4% -4% 0%
Diffusion index -4% -4% -2% -5% -1% -3% -2% -3% -2% -2%
Mean 2.92 2.92 2.97 2.91 2.99 2.95 2.97 2.95 2.96 2.96
Standard deviation 0.59 0.72 0.58 0.71 0.63 0.77 0.60 0.70 0.65 0.92
Number of banks responding 117 118 115 115 112 113 117 118 116 117
Overall
Loans to small
and medium-
sized enterprises
Loans to large
enterprises
Short-term loans
Long-term loans
Notes: Net percentage is defined as the difference between the sum of the percentages for “increased considerably” and “increased somewhat”
and the sum of the percentages for “decreased somewhat” and “decreased considerably”. The diffusion index is defined as the net percentage
weighted according to the intensity of the response, giving lenders who have answered “considerably” a weight twice as high (score of 1) as
lenders having answered “somewhat” (score of 0.5).
The mean and standard deviation are calculated by attributing the values 1 to 5 starting with the first possible answer and consequently for the
other answers. These values are then multiplied with the corresponding (weighted) percentages.
Chart 4. Changes in demand for loans or credit lines to enterprises
(net percentages of banks reporting a positive contribution to demand)
-40
-20
0
20
40
60
09Q4
10Q3
11Q2
12Q1
10Q2
11Q1
11Q4
10Q1
10Q4
11Q3
09Q4
10Q3
11Q2
12Q1
10Q2
11Q1
11Q4
-40
-20
0
20
40
60
actual
expected
Overall
Large
enterprises
Small and
medium-sized
enterprises
Short-term
loans
Long-term
loans
(a)
(e)
(d)
(c)
(b)
21
5. Over the past three months, how have the following factors affected the demand for loans or
credit lines to enterprises?
- ° + ++ NA
A) Financing needs
Fixed investment 5% 23% 55% 9% 0% 7%
Inventories and working capital 1% 14% 62% 14% 0% 10%
Mergers/acquisitions and corporate restructuring 5% 16% 62% 3% 0% 13%
Debt restructuring 1% 1% 69% 21% 1% 7%
B) Use of alternative finance
Internal financing 1% 10% 77% 2% 0% 10%
Loans from other banks 1% 5% 72% 10% 3% 9%
Loans from non-banks 1% 2% 80% 3% 0% 14%
Issuance of debt securities 0% 4% 76% 2% 0% 18%
Issuance of equity
0% 4% 77% 0% 0% 19%
Summary statistics
Oct Jan Oct Jan Oct Jan Oct Jan
A) Financing needs
Fixed investment -6% -20% -4% -13% 2.90 2.72 0.68 0.74
Inventories and working capital 4% -2% 2% -1% 3.04 2.95 0.54 0.64
Mergers/acquisitions and corporate restructuring -4% -18% -3% -11% 2.92 2.74 0.53 0.67
Debt restructuring 17% 20% 8% 10% 3.18 3.19 0.48 0.55
B) Use of alternative finance
Internal financing -3% -9% -2% -5% 2.96 2.89 0.41 0.46
Loans from other banks 7% 8% 4% 5% 3.09 3.08 0.49 0.62
Loans from non-banks 0% -1% 0% -1% 3.00 2.95 0.20 0.40
Issuance of debt securities 2% -2% 1% -1% 3.03 2.97 0.39 0.32
Issuance of equity
1% -4% 1% -2% 3.01 2.95 0.21 0.22
NetP
DI
M
SD
NA = Not available; NetP = Net percentage; DI = Diffusion index; M = Mean; SD = Standard deviation
Notes: Column “Net percentage” is defined as the difference between the sum of “+ + “ (contributed considerably to higher demand) and “+“
(contributed somewhat to higher demand) and the sum of “-” (contributed somewhat to lower demand) and “- -” (contributed considerably to
lower demand). ”°” means contributed to basically unchanged demand. The diffusion index is defined as the net percentage weighted according
to the intensity of the response, giving lenders who have answered “considerably” a weight twice as high (score of 1) as lenders having
answered “somewhat” (score of 0.5).
Chart 5a. Factors affecting demand for loans and credit lines to enterprises
(net percentages of banks reporting a positive contribution to demand)
-20
0
20
40
10Q4
11Q1
11Q2
11Q3
11Q4
10Q4
11Q1
11Q2
11Q3
11Q4
10Q4
11Q1
11Q2
11Q3
11Q4
10Q4
11Q1
11Q2
11Q3
11Q4
-20
0
20
40
Fixed investment
Inventories and
working capital
M&As and corporate
restructuring
Debt restructuring
22
Chart 5b. Factors affecting demand for loans and credit lines to enterprises
(net percentages of banks reporting a positive contribution to demand)
-20
-10
0
10
20
10Q4
11Q1
11Q2
11Q3
11Q4
10Q4
11Q1
11Q2
11Q3
11Q4
10Q4
11Q1
11Q2
11Q3
11Q4
10Q4
11Q1
11Q2
11Q3
11Q4
10Q4
11Q1
11Q2
11Q3
11Q4
-20
-10
0
10
20
Internal
financing
Loans from
other banks
Loans from
non-banks
Issuance
of debt
securities
Issuance of
equity
23
6. Please indicate how you expect your bank’s credit standards as applied to the approval of loans or
credit lines to enterprises to change over the next three months.
Oct Jan Oct Jan Oct Jan Oct Jan Oct Jan
Tighten considerably 2% 1% 2% 2% 7% 2% 2% 1% 3% 2%
Tighten somewhat 21% 27% 15% 22% 16% 33% 11% 20% 24% 29%
Remain basically unchanged 76% 69% 80% 72% 76% 64% 86% 76% 73% 66%
Ease somewhat 1% 3% 3% 5% 1% 1% 1% 2% 1% 3%
Ease considerably 0% 0% 0% 0% 0% 0% 0% 0% 0% 0%
Total 100% 100% 100% 100% 100% 100% 100% 100% 100% 100%
Net percentage 22% 25% 14% 19% 22% 35% 12% 20% 26% 28%
Diffusion index 12% 13% 8% 10% 14% 19% 7% 10% 14% 15%
Mean 2.76 2.73 2.84 2.80 2.71 2.63 2.86 2.79 2.71 2.70
Standard deviation 0.51 0.56 0.50 0.56 0.64 0.58 0.45 0.51 0.56 0.58
Number of banks responding 117 118 115 115 112 112 117 118 116 117
Long-term loans
Overall
Loans to small
and medium-
sized enterprises
Loans to large
enterprises
Short-term loans
Notes: Net percentage is defined as the difference between the sum of the percentages for “tighten considerably” and “tighten somewhat” and
the sum of the percentages for “ease somewhat” and “ease considerably”. The diffusion index is defined as the net percentage weighted
according to the intensity of the response, giving lenders who have answered “considerably” a weight twice as high (score of 1) as lenders
having answered “somewhat” (score of 0.5).
The mean and standard deviation are calculated by attributing the values 1 to 5 starting with the first possible answer and consequently for the
other answers. These values are then multiplied with the corresponding (weighted) percentages.
Chart 6. Expected credit standards for the approval of loans or credit lines to enterprises
(net percentages of banks contributing to tightening standards)
-5
0
5
10
15
20
25
30
35
40
11Q1
11Q2
11Q3
11Q4
12Q1
11Q1
11Q2
11Q3
11Q4
12Q1
11Q1
11Q2
11Q3
11Q4
12Q1
11Q1
11Q2
11Q3
11Q4
12Q1
11Q1
11Q2
11Q3
11Q4
12Q1
-5
0
5
10
15
20
25
30
Overall
Small and
medium-sized
enterprises
Large
enterprises
Short-
term loans
Long-term
loans
24
7. Please indicate how you expect demand for loans or credit lines to enterprises to change at your
bank over the next three months (apart from normal seasonal fluctuations)
Oct Jan Oct Jan Oct Jan Oct Jan Oct Jan
Decrease considerably 2% 1% 2% 1% 2% 0% 2% 1% 2% 3%
Decrease somewhat 23% 26% 21% 25% 22% 27% 15% 19% 27% 33%
Remain basically unchanged 69% 66% 71% 62% 71% 67% 78% 71% 63% 57%
Increase somewhat 5% 6% 6% 12% 5% 6% 6% 10% 7% 8%
Increase considerably 1% 0% 1% 0% 0% 0% 0% 0% 1% 0%
Total 100% 100% 100% 100% 100% 100% 100% 100% 100% 100%
Net percentage -19% -21% -16% -14% -19% -21% -11% -10% -22% -27%
Diffusion index -10% -11% -8% -8% -11% -10% -6% -5% -11% -15%
Mean 2.79 2.78 2.84 2.85 2.79 2.79 2.87 2.89 2.77 2.70
Standard deviation 0.62 0.59 0.61 0.65 0.59 0.56 0.53 0.58 0.66 0.68
Number of banks responding 116 118 115 115 112 112 117 118 116 117
Overall
Loans to small
and medium-
sized enterprises
Loans to large
enterprises
Short-term loans
Long-term loans
Notes: Net percentage is defined as the difference between the sum of the percentages for “increase considerably” and “increase somewhat” and
the sum of the percentages for “decrease somewhat” and “decrease considerably”. The diffusion index is defined as the net percentage weighted
according to the intensity of the response, giving lenders who have answered “considerably” a weight twice as high (score of 1) as lenders
having answered “somewhat” (score of 0.5).
The mean and standard deviation are calculated by attributing the values 1 to 5 starting with the first possible answer and consequently for the
other answers. These values are then multiplied with the corresponding (weighted) percentages.
Chart 7. Expected demand for loans and credit lines to enterprises
(net percentages of banks reporting a positive contribution to demand)
-40
-30
-20
-10
0
10
20
30
40
50
11Q1
11Q2
11Q3
11Q4
12Q1
11Q1
11Q2
11Q3
11Q4
12Q1
11Q1
11Q2
11Q3
11Q4
12Q1
11Q1
11Q2
11Q3
11Q4
12Q1
11Q1
11Q2
11Q3
11Q4
12Q1
-40
-30
-20
-10
0
10
20
30
40
50
Overall
Small and
medium-sized
enterprises
Large
enterprises
Short-term
loans
Long-term
loans
25
II. Loans to households
8. Over the past three months, how have your bank’s credit standards as applied to the approval of
loans to households changed?
Oct Jan Oct Jan
Tightened considerably 2% 1% 2% 1%
Tightened somewhat 16% 30% 9% 13%
Remained basically unchanged 82% 69% 89% 85%
Eased somewhat 0% 1% 1% 1%
Eased considerably 0% 0% 0% 0%
Total 100% 100% 100% 100%
Net percentage 18% 29% 10% 13%
Diffusion index 10% 15% 6% 7%
Mean 2.79 2.71 2.89 2.86
Standard deviation 0.48 0.51 0.40 0.42
Number of banks responding 111 111 113 114
Loans for house
purchase
Consumer credit
and other
lending
Notes: Net percentage is defined as the difference between the sum of the percentages for “tightened considerably” and “tightened somewhat”
and the sum of the percentages for “eased somewhat” and “eased considerably”. The diffusion index is defined as the net percentage weighted
according to the intensity of the response, giving lenders who have answered “considerably” a weight twice as high (score of 1) as lenders
having answered “somewhat” (score of 0.5).
The mean and standard deviation are calculated by attributing the values 1 to 5 starting with the first possible answer and consequently for the
other answers. These values are then multiplied with the corresponding (weighted) percentages.
Chart 8. Credit standards applied to the approval of loans to households
(net percentages of banks reporting tightening credit standards)
0
5
10
15
20
25
30
35
10Q4
11Q1
11Q2
11Q3
11Q4
10Q4
11Q1
11Q2
11Q3
11Q4
0
5
10
15
20
Loans for house
purchase
Consumer credit and
other lending