Báo cáo khoa học: Prevalence of intrinsic disorder in the hepatitis C virus ARFP/Core+1/S protein doc
Bạn đang xem bản rút gọn của tài liệu. Xem và tải ngay bản đầy đủ của tài liệu tại đây (2.17 MB, 16 trang )
Prevalence of intrinsic disorder in the hepatitis C virus
ARFP/Core+1/S protein
Anissa Boumlic
1,2,
*, Yves Nomine
´
1,
*, Sebastian Charbonnier
1
, Georgia Dalagiorgou
2
, Niki
Vassilaki
2
, Bruno Kieffer
3
, Gilles Trave
´
1
, Penelope Mavromara
2
and Georges Orfanoudakis
1
1 Oncoproteins Group, Universite
´
de Strasbourg, CNRS FRE 3211, Ecole Supe
´
rieure de Biotechnologie de Strasbourg, Illkirch, France
2 Molecular Virology Laboratory, Hellenic Pasteur Institute, Athens, Greece
3 Biomolecular NMR Group, UMR CNRS 7104, Institut de Ge
´
ne
´
tique et de Biologie Mole
´
culaire et Cellulaire, Illkirch, France
Introduction
Hepatitis C virus (HCV) is the major etiological agent
of chronic hepatitis, with more than 170 million people
being infected worldwide [1,2]. Persistent HCV infec-
tion progresses, in 20% of cases, to liver cirrhosis
within 20 years of infection, with the possible develop-
ment of hepatocellular carcinoma (HCC) in 1–4% of
cases [3]. No prophylactic vaccine against HCV exists,
and the efficiency of therapies is hindered by the
extreme heterogeneity of the HCV genome [4,5]. HCV,
a Hepacivirus genus member of the Flaviviridae family,
is a small, enveloped RNA virus [6]. Its genome is a
positive, single-stranded 9.6 kb RNA containing
5¢-UTRs and 3¢-UTRs involved in viral protein trans-
lation and viral replication [7–9]. The genome encodes
a large precursor polyprotein that undergoes proteoly-
sis, generating HCV structural proteins (Core, E1, and
E2) and nonstructural proteins (p7, NS2, NS3, NS4A,
NS4B, NS5A, and NS5B). An alternative reading
frame (Core+1 ORF) overlapping the Core protein
gene in the +1 frame was recently reported [10–13].
Keywords
ARFP/Core+1/S; hepatitis C virus (HCV);
intrinsic disorder; IUP/IDP; NMR
Correspondence
G. Orfanoudakis, Oncoproteins Group,
Universite
´
de Strasbourg, CNRS FRE 3211,
Ecole Supe
´
rieure de Biotechnologie de
Strasbourg, Illkirch, France
Fax: +33 3 68 85 47 70
Tel: +33 3 68 85 47 65
E-mail:
*These authors contributed equally to this
work
(Received 25 October 2009, revised 30
November 2009, accepted 1 December
2009)
doi:10.1111/j.1742-4658.2009.07527.x
The hepatitis C virus (HCV) Core+1/S polypeptide, also known as alter-
native reading frame protein (ARFP)/S, is an ARFP expressed from the
Core coding region of the viral genome. Core+1/S is expressed as a result
of internal initiation at AUG codons (85–87) located downstream of the
polyprotein initiator codon, and corresponds to the C-terminal part of
most ARFPs. Core+1/S is a highly basic polypeptide, and its function still
remains unclear. In this work, untagged recombinant Core+1/S was
expressed and purified from Escherichia coli in native conditions, and was
shown to react with sera of HCV-positive patients. We subsequently under-
took the biochemical and biophysical characterization of Core+1/S. The
conformation and oligomeric state of Core+1/S were investigated using
size exclusion chromatography, dynamic light scattering, fluorescence, CD,
and NMR. Consistent with sequence-based disorder predictions, Core+1/S
lacks significant secondary structure in vitro, which might be relevant for
the recognition of diverse molecular partners and/or for the assembly of
Core+1/S. This study is the first reported structural characterization of an
HCV ARFP/Core+1 protein, and provides evidence that ARFP/Core+1/
S is highly disordered under native conditions, with a tendency for self-
association.
Abbreviations
ARFP, alternative reading frame protein; DLS, dynamic light scattering; HCC, hepatocellular carcinoma; HCV, hepatitis C virus; HSQC,
heteronuclear single quantum coherence; IDP, intrinsically disordered protein; IMAC, immobilized metal ion affinity chromatography; MBP,
maltose-binding protein; OG, n-octyl-b-
D-glucoside; SSP, secondary structure propensity; TEV, tobacco etch virus.
774 FEBS Journal 277 (2010) 774–789 ª 2010 The Authors Journal compilation ª 2010 FEBS
This ORF is responsible for the expression of various
alternative reading frame proteins (ARFPs), also
named Core+1 proteins, resulting from mechanisms
such as ribosomal frame shifting and internal initiation
at alternative AUG or non-AUG codons [10–12,14–
17]. Core+1 proteins were recently shown not to be
required for HCV replication [18,19]. However, the
presence of specific antibodies and T-cell-mediated
immune responses in serum from HCV-infected
patients suggests the expression of the Core+1 ORF
during HCV infection [10–12,20,21]. Furthermore,
Core+1 proteins were found to interfere with apopto-
sis and cell cycle regulation [22,23], suggesting a possi-
ble role of these proteins in HCV pathogenesis.
One remarkable ARFP is Core+1/S, a small poly-
peptide with a length varying from 38 to 76 residues
among HCV genotypes. Core+1/S corresponds to the
C-terminal fragment of the Core+1 ORF, and to date
is the shortest ARFP form described. Its translation
results from internal initiation at alternative AUG
codons (85–87) located downstream of the polyprotein
codon initiator. Recently, two different groups
observed that Core+1/S is the predominant alternative
form when the Core+1 ORF is introduced into mam-
malian expression systems [16,24]. In addition,
Core+1/S was found to be downregulated by the Core
protein and degraded in a proteasome-dependent man-
ner [25,26].
In order to further our understanding of these pro-
teins, we undertook biochemical and biophysical stud-
ies of the Core+1/S proteins derived from HCV-1a
and HCV-1b isolates. The Core+1/S proteins were
produced in bacteria and purified in native conditions.
ELISA experiments using the purified recombinant
Core+1/S of HCV-1b demonstrated the ability of the
protein to react with sera from HCV-infected patients.
We subsequently investigated the biophysical features
of HCV-1a and HCV-1b Core+1/S proteins using
sequence analysis and complementary biophysical
approaches [fluorescence, CD, dynamic light scattering
(DLS), and NMR]. We provide evidence that ARFP/
Core+1/S is highly disordered under native condi-
tions, with a tendency for self-association.
Results
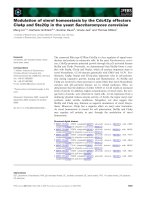
Sequence analysis of Core+1/S predicts the
largely disordered character of the protein
Sequence alignments were performed to analyze the
degree of Core+1/S amino acid conservation among
reference sequences of different HCV genotypes
(Fig. 1A) [5]. The N-terminal sequence is well conserved
and exhibits hydrophobic patches, encompassing resi-
dues 1–6, 14–25, and 32–35. In contrast, considerable
variability was observed in the location of the stop
codon on the RNA sequence (data not shown), leading
to variation in the lengths of protein sequences. Amino
acid sequences were analyzed using the disorder predic-
tion tools globplot and pondr. globplot evaluates
the sum of the disorder propensity for each amino acid
among the sequence, and pondr analyzes the mean net
charge and hydrophobicity of the polypeptide chain.
This combination of properties seems to be a prerequi-
site for the absence of compact structure in native con-
ditions [27]. globplot predicted disordered regions
encompassing amino acids 6–28 and 42–52 for HCV-1a
Core+1/S, and amino acids 6–28 and 42–58 for HCV-
1b Core+1/S, whereas pondr suggested that most of
the Core+1/S sequence is disordered.
In order to assess whether the disorder prediction is
also confirmed by the absence of secondary structure,
four algorithms (phd, gor4, simpa 96, and sopma) were
used to predict the secondary structure contents of both
HCV-1a and HCV-1b Core+1/S proteins (Fig. 1B).
A consensus is drawn for residues with at least three
out of four identical secondary structure predictions.
Such a consensus suggested that the majority of resi-
dues are not embedded in secondary structure elements,
with the exception of short residue stretches mainly
located in the second and third hydrophobic patches.
The combination of secondary structure and disordered
region predictions strongly suggests that the N-terminal
and C-terminal regions of HCV Core+1 proteins are
largely unstructured and highly disordered (Fig. 1A).
These predictions are supported by the high degree of
conservation of several disorder-promoting residues,
such as alanines, arginines, glycines, and serines
(Fig. 1B) [28].
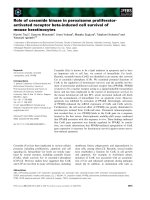
Expression and purification of Core+1/S proteins
in native conditions
We cloned and expressed the HCV-1a and HCV-1b
Core+1/S proteins encompassing residues 85–160 and
85–142 of the full Core+1 ORF, respectively. These
constructs were fused to the C-terminus of either His6,
His6–maltose-binding protein (MBP) (Fig. S1), or
His6–NusA (Fig. 2A). Screenings of optimal yield and
solubility conditions were first performed on the three
constructs of HCV-1a Core+1/S by varying the induc-
tion temperatures between 37 and 22 °C. Analysis on
Tris/Tricine SDS gels showed expression of proteins at
the expected molecular mass (Fig. 2B; Fig. S1), with
an optimum induction temperature at 22 °C. However,
both His-tagged and MBP-tagged HCV-1a Core+1/S
A. Boumlic et al. Biophysical characterization of HCV ARFP/Core+1/S
FEBS Journal 277 (2010) 774–789 ª 2010 The Authors Journal compilation ª 2010 FEBS 775
proteins were found largely in the insoluble fractions
after cell lysis (Fig. S1), even after incubation at low
temperatures. In contrast, NusA-tagged HCV-1a
Core+1/S was largely soluble even after tobacco etch
virus (TEV) protease cleavage (Fig. 2C). The solubiliz-
ing properties of NusA have already been described in
the literature [29]. However, it was surprising to
observe MBP fusion proteins in the insoluble fractions,
as the MBP carrier is also a well-known protein solu-
bilizer. Despite its small size, Core+1/S seems, there-
fore, to promote aggregation of the fusion protein
when fused to the MBP carrier. As NusA solubilized
HCV-1a Core+1/S, we fused the same carrier protein
to the HCV-1b Core+1/S. After TEV protease-medi-
ated proteolysis, both HCV Core+1/S proteins
remained soluble (Fig. 2C).
When Core+1/S production was scaled up, the use
of the optimal expression and purification conditions
as described above led to protein aggregation. In order
to prevent this, we lowered the expression temperature
to 15 °C and systematically supplemented the purifica-
tion buffer with l-arginine and l-glutamic acid at a
final concentration of 50 mm each. These additives are
known to prevent protein aggregation [30]. Finally,
A
B
Fig. 1. Sequence analysis of Core+1/S proteins. (A) Alignment of 17 Core+1/S amino acid reference sequences for different HCV genotypes.
Protein sequences were obtained after translation of the Core+1 ORF nucleotide sequences retrieved from the GenBank database (acces-
sion numbers are given in parentheses). Core+1/S amino acid sequences were aligned using
CLUSTALW. Similarity percentages are indicated
on the right, according to
CLUSTALW calculations. Hydrophobic residues are boxed. (B) Disorder and structure predictions. Disorder predictions
were made using
GLOBPLOT and PONDR. Disordered and ordered regions are indicated by ‘D’ and ‘.’, respectively. Secondary structure predic-
tions were performed with
GOR4, SOPMA, SIMPA96 and PHD, using both HCV-1a and HCV-1b Core+1/S amino acid sequences as inputs (see
Experimental procedures). Structure predictions for each residue position are indicated as a-helix (H), extended strand (E), b-turn (T), or ran-
dom coil (C). Uppercase letters indicate a prediction rate higher than 80%. A consensus was reported when three or more predictions over
the four algorithms provide identical secondary structure prediction. Residues are numbered from the start of Core+1/S and correspond to
residues 85–161 and 85–144 of the Core+1 ORF, and nucleotides 599–827 and 599–776 of the Core/Core+1 RNA sequence, for HCV-1a
and HCV-1b, respectively.
Biophysical characterization of HCV ARFP/Core+1/S A. Boumlic et al.
776 FEBS Journal 277 (2010) 774–789 ª 2010 The Authors Journal compilation ª 2010 FEBS
buffers were routinely supplemented with dithiothreitol
and argon to reduce protein oxidation [31]. Final
yields were approximately 1 mg of expressed protein
per liter of bacterial culture.
Upon size exclusion chromatography, both HCV
Core+1/S proteins eluted as monomers, according to
column calibration (Fig. 3A). MS analysis of the puri-
fied proteins gave experimental masses of 7630.7 ± 0.8
and 6076.0 ± 0.1 Da for HCV-1a and HCV-1b
Core+1/S, respectively. The mass of HCV-1b Core+1/
S corresponds to the calculated value (6075.9 Da),
whereas that of HCV-1a Core+1/S showed loss of the
GA sequence that is usually left after TEV protease pro-
teolysis and the N-terminal methionine. Purified recom-
binant Core+/1S proteins were also verified through
SDS/PAGE (Fig. 3B), and were specifically recognized
by polyclonal antibodies against the Core+1 ORF in
western blot experiments (Fig. 3C).
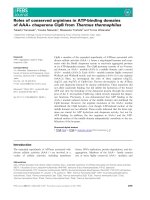
Sera from HCV-1-infected patients are reactive
against native HCV-1b Core+1/S
HCV-1b Core+1/S was used in ELISA to test the
reactivity of sera from patients positive for HCV
genotype 1. Figure 4 shows a high prevalence ( 60%)
of Core+1 antibodies in patient sera as compared with
the cutoff value, defined as the average of the negative
controls plus two standard deviations. The presence of
antibodies against Core+1/S indicates that the purified
recombinant untagged protein remains immunoreac-
tive, and suggests that the protein is present in patients
infected with HCV of genotype 1.
Intrinsic fluorescence of Core+1/S proteins
HCV-1a and HCV-1b Core+1/S proteins contain
tryptophans at positions 34, 49, 66, and 74, and posi-
tions 6, 34, and 49, respectively. Intrinsic fluorescence
spectroscopy was therefore used to evaluate the solvent
accessibility of these residues. As all tryptophans are
simultaneously excited, the emission spectrum results
from the sum of the signals of individual emitters. The
maxima of fluorescence emission for HCV-1a and
HCV-1b Core+1/S proteins were observed at wave-
length of 354 and 353 nm, respectively (Fig. 5A).
These values are close to that of soluble tryptophan in
aqueous solution (355 nm) [32], indicating that all try-
ptophans of Core+1/S proteins are exposed to the sol-
A
B
kDa
17
28
11
55
72
C
17
28
11
55
72
PS PS PS
37 T (°C)
2228
kDa kDa
TEV
TEV
NusA
NusA
HCV-1a
Core+1/S
Core+1/S
NusA
T7
6xHis
TEV
37 T (°C)
17
28
11
55
72
NusA-
HCV-1a
Core+1/S
17
28
11
55
72
kDa
PS PS PS
2228
143265
NusA-
HCV-1a
Core+1/S
NusA-
HCV-1b
Core+1/S
NusA-
HCV-1b
Core+1/S
HCV-1b
Core+1/S
Fig. 2. Expression and purification screenings of native NusA–HCV Core+1/S proteins. (A) Cloning strategy for expression of Core+1/S. The
sequence His6–NusA is fused at the 5¢-terminus of the Core+1/S DNA sequence. (B) Pellet/supernatant assays. After transformation,
expression of recombinant proteins was monitored for 2, 4 h or overnight at 37, 28 or 22 °C, respectively. Fifty microliters of bacterial cul-
ture was sonicated and centrifuged for 15 min at 16 000 g. Supernatants (S) and pellets (P) were analyzed by Tris/Tricine SDS/PAGE. (C)
IMAC purification of NusA–Core+1/S proteins followed by TEV protease digestion. Labeled or unlabeled His6-NusA–Core+1/S proteins were
expressed under optimized conditions, and purified on Ni
2+
–nitrilotriacetic acid resin in the presence of arginine and glutamic acid (50 mM
each). After IMAC purification, fusion proteins were desalted and subjected to TEV protease cleavage to release Core+1/S proteins. Lane 1:
bacterial lysate. Lane 2: IMAC elution at 250 m
M imidazole. Lane 3: desalted NusA–HCV-1a Core+1/S before TEV protease cleavage. Lane 4:
NusA–HCV-1a Core+1/S after TEV protease cleavage. Lane 5: desalted NusA–HCV-1b Core+1/S before TEV protease cleavage. Lane 6:
NusA–HCV-1b Core+1/S after TEV protease cleavage. Arrows on the right indicate the bands for soluble NusA-HCV-Core+1/S, NusA, TEV
and Core+1/S proteins.
A. Boumlic et al. Biophysical characterization of HCV ARFP/Core+1/S
FEBS Journal 277 (2010) 774–789 ª 2010 The Authors Journal compilation ª 2010 FEBS 777
vent. In a second step, an HCV-1b Core+1/S sample
was subjected to a 20 min heat pulse 16 h prior to flu-
orescence analysis (Fig. 5B). No change in either the
wavelength or the intensity of the maximum fluores-
cence emission was observed. This observation indi-
cates an absence of precipitation, suggesting resistance
of the protein to heat treatment, a feature that is often
associated with disordered proteins [33].
Self-assembly of HCV Core+1/S proteins
DLS allows the oligomeric status of proteins in solu-
tion to be evaluated. Hydrodynamic radius distribu-
tions were derived from DLS data recorded for each
protein sample under various conditions, assuming a
coil model as implemented in dynals (Fig. 6). In the
absence of any treatment or additive (Fig. 6, upper
panels), the average hydrodynamic radii (R
h
) were
4.5 ± 2.4 and 2.5 ± 1.2 nm for purified HCV-1a and
HCV-1b Core+1/S proteins, respectively. Assuming a
coil model, these radii are equivalent to particles of
nearly 15 and five monomers for HCV-1a and HCV-
1b, respectively. The radius distribution indicates the
polydisperse character of both isoforms. As the
proteins eluted as monomers in a size exclusion chro-
matography column, it appears that multimerization
occurs during and/or after concentration.
We previously showed that HCV-1a Core+1/S
is localized in the endoplasmic reticulum membranes
[24]. Under the hypothesis that HCV-1b Core+1/S
contains membrane localization determinants, we
added octyl glucoside [n-octyl-b-d-glucoside (OG)], a
nonionic detergent that is frequently used to solubilize
integral membrane proteins. The presence of OG in
Core+1/S proteins sharpened the size distributions as
observed with DLS, and thus lowered the polydisper-
sity in particle sizes, although the average hydrody-
namic radii were not significantly altered (Fig. 6,
middle panels).
When the proteins were subjected to a heat pulse,
the average hydrodynamic radii shifted from 4.5 ± 2.4
to 1.8 ± 0.6 nm for HCV-1a Core+1/S, and from
2.5 ± 1.2 to 1.6 ± 0.6 nm for HCV-1b Core+1/S
(Fig. 6, lower panels), suggesting a transition to
lower-size oligomers. In addition, the polydispersity
significantly decreased. Thus, high temperature is able
to disrupt Core+1/S multimers without leading to
protein precipitation.
12
8
4
20 40 60 80
0
Elution volume (mL)
6.513.7
294367
100
28
55
11
a
b
c
Absorbance at 280 nm (a.u.)
kDa
kDa
A
C
B
(a)
(b)
(c)
HCV-1b
Core+1/S
NusA
HCV-1a
Core+1/S
28
55
11
28
55
11
11
kDa
17
28
HCV-1b Core+1/S
HPV E6
HCV-1a Core+1/S
HCV-1b Core+1/S
HPV E6
HCV-1a Core+1/S
HCV-1b Core+1/S
Ponceau Red
HPV E6
Anti-Core+1
HCV-1a
Anti-Core+1
HCV-1b
Fig. 3. Biochemical analysis of purified
native HCV Core+1/S proteins. (A) Size
exclusion chromatography of HCV Core+1/S
proteins. After TEV protease proteolysis,
proteins were injected onto a Hiload 16/60
Superdex 75 column in the presence of argi-
nine and glutamic acid (50 m
M each). The
mass distribution in the eluant is indicated
at the top. Both HCV-1a Core+1/S (dotted
line) and HCV-1b Core+1/S (bold line) eluted
as monomers, according to the column cali-
bration. (B) Coomassie blue staining of puri-
fied proteins by Tris/Tricine SDS/PAGE.
Molecular masses are given on the left, and
arrows indicate the expected expression
products. (C) Western blot analysis of puri-
fied Core+1/S proteins. After purification
and concentration, Core+1/S proteins were
analysed by western blotting using anti-
HCV-1a Core+1 or anti-HCV-1b serum. Left
panel: Ponceau staining of HCV Core+1/S
proteins and HPV16 E6. Middle panel: HCV-
1a Core+1/S revealed by anti-HCV-1a
Core+1 serum. Right panel: HCV-1b
Core+1/S revealed by anti-HCV-1b Core+1
serum. Molecular masses are indicated on
the left.
Biophysical characterization of HCV ARFP/Core+1/S A. Boumlic et al.
778 FEBS Journal 277 (2010) 774–789 ª 2010 The Authors Journal compilation ª 2010 FEBS
CD analysis of potential secondary structure of
Core+1/S proteins
CD spectra were recorded for both proteins in the
far-UV region. Globally, CD spectra for HCV-1a
(Fig. 7A) and HCV-1b (Fig. 7B) Core+1/S proteins
did not show the characteristics of a full random coil
conformation (a strong negative minimum at 195–
198 nm, and a weak negative signal at 220 nm) [34].
Instead, we observed a maximum at 195 nm and a
minimum at 220 nm, suggesting the existence of b-
sheet secondary structure. Deconvolution of the CD
data was performed using three sets of reference pro-
teins and the algorithms provided by the cdpro suite
[35]. As selcon
3 failed several times to fit the
CD data, this program was not used for data
analysis. However, both cdsstr and contin/ll gave
consistent results, and allowed the contributions of
structural elements to be estimated. The percentages
of a-helix (a), b-sheet (b) and unordered (U) struc-
tures were 5%, 30% and 65%, respectively,
with a typical range of variation of 10–20%
(Fig. 7C). Although the high content of unordered
structure is consistent with disorder prediction, a sig-
nificant amount of b-sheet content seems to be pres-
ent. The presence of such a signal might be due to
the presence of intrinsic b-sheet structure in Core+1/
S protein. Alternatively, it might also correspond to
b-sheet structure formed at the interface of Core+1/
S monomers upon multimerization, as it has been
shown that b-sheet structure is predominant in aggre-
gates and is often associated with intrinsically disor-
dered proteins [36].
Finally, the CD spectrum recorded for an HCV-1b
Core+1/S sample subjected to a heat pulse was
slightly different from that of an unheated sample
(Fig. 7D). In contrast, the addition of OG induced
drastic changes in the CD spectrum as compared with
the untreated sample spectrum for both Core+1/S
proteins (Fig. 7A,B), suggesting an effect of OG on
the conformation of HCV-1b Core+1/S. However, the
addition of OG prevented the recording of data at
wavelengths below 206 nm, hindering the deconvolu-
tion of data.
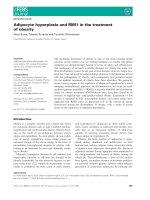
NMR analysis of HCV-1b Core+1/S
In order to further investigate the structural properties
of Core+1/S proteins, NMR
1
H–
15
N heteronuclear
single quantum coherence (HSQC) experiments were
performed for both HCV-1b Core+1/S (Fig. 8A) and
HCV-1a Core+1/S (Fig. S2). Both spectra exhibit a
rather narrow amide proton chemical shift dispersion,
limited to 0.7 p.p.m. Such a range is characteristic of a
lack of structural organization of the backbone [37].
The spectrum recorded for HCV-1a Core+1/S showed
a high number of overlapping peaks, impeding the
accurate counting of peaks. In contrast, the HSQC
spectrum of HCV-1b Core+1/S allows the counting of
a number of peaks consistent with that expected from
the protein sequence.
In order to assign backbone frequencies of the poly-
peptide, three-dimensional NMR experiments were
performed on a
15
N,
13
C-labeled HCV-1b Core+1/S
0.4
0.0
0.3
0.2
0.1
1b 1a 1
HCV/HCC
Controls
OD (450 nm)
Fig. 4. Reactivity of sera from genotype 1 HCV-infected patients
against HCV-1b Core+1/S. The sera from HCV-infected patients
were tested by enzyme immunoassay, using the native HCV-1b
Core+1/S. Controls correspond to HCV-negative patient sera.
A
450 nm
values of the different sera are represented. The cutoff
was determined as the average of HCV-negative sera absorbance
plus two standard deviations.
305 325 345 365 400385
Wavelength (nm)
Heated
HCV-1a Core+1/S
Fluorescence intensity
(normalized)
0
6
AB
3
Unheated
HCV-1b Core+1/S
HCV-1b Core+1/S
305 325 345 365 400385
Wavelength (nm)
Fluorescence intensity
(normalized)
0
6
3
Fig. 5. Intrinsic fluorescence of Core+1/S
proteins. UV fluorescence emission spectra
of Core+1/S proteins were recorded in
20 m
M sodium phosphate buffer (pH 6.8,
2m
M). (A) Fluorescence emission spectra of
HCV-1a and HCV-1b Core+1/S proteins in
buffer. (B) Fluorescence emission spectra of
HCV-1b Core+1/S proteins were recorded
after boiling the protein for 20 min and cool-
ing to room temperature.
A. Boumlic et al. Biophysical characterization of HCV ARFP/Core+1/S
FEBS Journal 277 (2010) 774–789 ª 2010 The Authors Journal compilation ª 2010 FEBS 779
sample. Near-complete
1
H
N
,
15
N-backbone and
13
C-res-
onance assignment could be achieved for HCV-1b
Core+1/S (Fig. 8A), with the exception of His14 and
Ser38, as well as the first two residues (Gly-Ala)
remaining from the TEV protease site. The lack of
His14 resonances might be due to protonation–depro-
tonation equilibrium of the imidazole ring [38]. The
absence of Ser38 resonances needs to be further inves-
tigated. We used experimental carbon chemical shifts
to probe the presence of helical or b-sheet secondary
structures. For all residues of HCV-1b Core+1/S, C
a
secondary chemical shifts were below 1.0 p.p.m. (posi-
tive or negative) (Fig. 8B), confirming the absence of
stable secondary structure elements in HCV-1b
Core+1/S. However, a consensus was observed for
residues encompassing the region between residues 32
and 35, suggesting that this region might have a ten-
dency to b-sheet character. Interestingly, the same
region was predicted to contain b-sheet elements by
the majority of the secondary structure prediction
methods, and also corresponds to a nondisordered
region according to globplot analysis (Fig. 1B).
Methods based on chemical shifts are often used to
depict secondary structure elements, but quantitative
interpretation of secondary chemical shifts alone
remains difficult, because the expected values for fully
formed secondary structures vary for different amino
acids [39]. In order to quickly visualize the fractional
deviation of the experimental chemical shifts from pure
a-helix or b-sheet secondary shifts, residue-specific sec-
ondary structure propensity (SSP) scores of HCV-1b
Core+1/S were calculated on the basis of ssp software
recommendations [40]. ssp combines chemical shifts
from different nuclei weighted by their sensitivity to
a-helix or b-sheet structures into a single SSP score
varying between 0 and 1, or 0 and )1, for a-helix and
b-sheet structures, respectively. These scores represent
the expected fraction of a-helix or b-sheet secondary
structure for each residue. Calculated scores of HCV-
1b Core+1/S are very close to zero values, indicating
an overall low SSP. In particular, the SSP profile
shows almost no propensity to adopt a helical confor-
mation along the protein sequence. Although a mild
propensity to adopt a b-sheet conformation is visible
for residues encompassing the regions between 3 and
8, 32 and 35, and 41 and 44, it is very limited as
compared to the maximal amplitude expected for a full
b-sheet conformation.
Finally, the
1
H–
15
N-HSQC NMR spectrum recorded
for HCV-1b Core+1/S in the presence of 6% OG
(Fig. 8D) showed a few notable changes for Val21,
Ile33, Trp34, Val35, Thr47, and five glycines distrib-
uted all over the sequence (Gly7, Gly8, Gly22, Gly30,
and Gly50). These results suggest a possible weak
interaction of HCV-1b Core+1/S with OG.
Discussion
HCV Core+1/S proteins are intrinsically disordered
Core+1/S proteins correspond to the C-terminal parts
of most of the described HCV ARFPS. To date, nei-
ther biochemical nor biophysical data have been
described for ARFPs. Here, we succeeded in producing
the Core+1/S proteins from HCV-1a and HCV-1b
genotypes, using the standard Escherichia coli BL21
Hydrodynamic radius (nm)
Hydrodynamic radius (nm)
Mass distribution (%)
0.0
0.8
0.4
0.0
0.4
0.2
0.8
0.4
R
ave
: 2.5 nm
s: 1.2 nm
R
ave
: 2.6 nm
s: n/a
R
ave
: 1.6 nm
s: 0.6 nm
R
ave
: 4.5 nm
s: 2.4 nm
R
ave
: 4.0 nm
s: n/a
R
ave
: 1.8 nm
s: 0.6 nm
0.0
10.08.06.04.02.00.0
0.0
0.4
0.2
10.08.06.04.02.00.0
0.0
0.8
0.4
0.0
0.8
0.4
HCV-1a Core+1/S
HCV-1b Core+1/S
control
OG
Heat
pulse
Fig. 6. Size distribution histograms of HCV-
1a and HCV-1b Core+1/S proteins deter-
mined by DLS. Twenty microliters of
80–100 l
M protein samples in 20 mM
sodium phosphate buffer (pH 6.8, 400 mM
NaCl) were directly analyzed, incubated with
OG, or subjected to a heat pulse prior to
analysis. Samples were analyzed by DLS,
and the hydrodynamic radius distributions of
Core+1 proteins were determined using
DYNALS, assuming a coil model. Solid lines
are the three-parameter nonlinear least
squares fits of the size distribution profiles
using a Gaussian model, yielding average
radii (R
ave
) and widths at the half-height (s).
When the profile exhibits only two values,
an average radius was determined by
weight averaging of the intensities.
Biophysical characterization of HCV ARFP/Core+1/S A. Boumlic et al.
780 FEBS Journal 277 (2010) 774–789 ª 2010 The Authors Journal compilation ª 2010 FEBS
bacterial system. We optimized the expression and
purification processes under native conditions, and
obtained substantial amount of native, highly pure,
untagged proteins. We detected antibodies against
recombinant HCV-1b Core+1/S in the sera of HCV-
infected patients, suggesting that the protein might be
expressed during HCV infection, either alone or as a
part of a larger ARFP.
Combining the results of complementary biophysical
techniques, our study showed that Core+1/S proteins
lack secondary and tertiary structure.
1
H–
15
N-HSQC
NMR experiments performed on both HCV-1a and
HCV-1b Core+1/S constructs showed a limited chemi-
cal shift dispersion of amide proton resonances into a
narrow range (0.7 p.p.m). This is indicative of a disor-
dered state, as inherent flexibility and rapid intercon-
version between multiple conformations generally lead
to a poor chemical shift dispersion. Exceptions are the
15
N-backbone resonances in
1
H–
15
N-HSQC spectra of
Core+1/S proteins. These resonances are influenced
both by residue type and by the local amino acid
sequence, and therefore remain well dispersed, even in
fully unfolded states [41]. In addition, the distribution
of correlation peaks around 10 p.p.m. in the HSQC
spectrum, which are assigned to tryptophan side
chains, indicates that these residues lie in a very similar
environment, in agreement with fluorescence data
indicative of solvent-exposed tryptophans. Together
with the absence of consensus in the backbone carbon
chemical shift differences, these observations suggest a
lack of secondary structure for HCV-1b Core+1/S.
This conclusion is further reinforced by the high con-
tent of unordered conformation ( 65%) determined
by CD spectroscopy. Finally, the HSQC spectrum
recorded for HCV-1a Core+1/S also displays a poor
proton chemical shift distribution, suggesting that this
protein is also disordered.
When subjected to a heat pulse, folded proteins
commonly unfold and precipitate, owing to solvent
exposure of hydrophobic residues, whereas nonfolded
peptides may remain in solution [33]. We demonstrated
that HCV-1b Core+1/S remains soluble after heat
pulse treatment, as observed on fluorescence spectra.
Moreover, DLS shows that the mass distribution shifts
to lower molecular masses. This is confirmed by the
observation in NMR spectra of more intense peaks
following a heat pulse (data not shown). No significant
change was observed in CD spectra after such treat-
ment, indicating that this treatment does not influence
the global conformation of the polypeptide.
Intrinsically disordered proteins (IDPs) are defined
as proteins containing at least one disordered region,
and were recently recognized as a new protein class
[42]. Disordered proteins are gaining considerable
attention, owing to their capacity to perform numer-
ous biological functions despite their lack of defined
Wavelength (nm)
Wavelength (nm)
190 210 230 250
buffer
OG
10
15
buffer
OG
HCV-1a Core+1/S
HCV-1b Core+1/S
0
50
100
HCV-1a
Core+1/S
HCV-1b
Core+1/S
Secondary structure
contents (%)
C
U
0
–5
–10
–15
–25
5
–20
A
B
190 210 230 250
10
15
0
–5
–10
–15
–25
5
–20
α
β
θ
[MRW]
× 10
–3
(deg·cm
2
·dmol
–1
) θ
[MRW]
× 10
–3
(deg·cm
2
·dmol
–1
)
Fig. 7. Far-UV CD analysis of HCV Core+1/S proteins. Data are rep-
resented as molar ellipticity per residue. Core+1/S proteins (4 l
M)
in 20 m
M sodium phosphate buffer, 50 mM NaCl, and 0.15 mM dith-
iothreitol. (A, B) CD spectra of HCV-1a and HCV-1b Core+1/S pro-
teins in buffer (solid line), after incubation with 6% OG. (C) Far-UV
data were analyzed with the
CDPro package, using two algorithms
(
CONTINLL, and CDSSR) and three protein databases (SP43, SMP56,
and SDP48). a, a-helix; b, b-sheet; U, turns and unordered second-
ary structure.
A. Boumlic et al. Biophysical characterization of HCV ARFP/Core+1/S
FEBS Journal 277 (2010) 774–789 ª 2010 The Authors Journal compilation ª 2010 FEBS 781
structure [42–47]. Under native conditions, Core+1/S
proteins remain unstructured, and should therefore be
classed as IDPs. This character is also confirmed by
disorder and structure predictions based on protein
sequences. This is not the first time that an HCV
protein has been reported to be at least partially
disordered. Indeed, the first 82 amino acids of the
N-terminal part of Core protein and domain 2
of NS5A protein have already been classed as IDPs
[48–50]. Domain 3 of NS5A is also natively unfolded
[51]. More generally, intrinsic disorder is commonly
found in viruses. For instance, among Flaviviridae,
Dengue virus, West Nile virus and bovine viral diar-
rhea virus capsid proteins contain flexible, basic
regions [52–54]. Proteins from other virus families
were also identified as being partially or completely
disordered, such as the Nef protein of simian immu-
nodeficiency virus [55], HIV tat protein [56], and the
nucleoprotein and phosphoprotein of the measles virus
[57,58]. As virus genomes are restricted in molecular
size, the flexible nature of disordered regions of pro-
teins may allow efficient interaction with several tar-
gets [59].
HCV Core+1/S proteins tend to self-associate
The deconvolution of Core+1/S CD spectra suggested
the presence of a significant proportion of b-sheet sec-
ondary structures (30%), in disagreement with the
NMR-derived SSP. A first hypothesis to explain this
is the difference in concentration range used to
obtain CD and NMR data. However, the position and
C
α
C
β
C
0
1 1121314151
Amino acid sequence
B
–1
0
1
2
–2
–1
0
1
2
–2
–1
0
1
2
–2
Δδ (p.p.m.)
Without OG
With OG 6%
AD
V21
I33
V35
W34
A17
G30
G22
G7
T47
G50
G8
8.08.28.4 7.8
10.0
130
114
118
122
126
110
130
A17
A56
W34
I33
A2
A5
R36
A43
R42
R4
A44
R53
I39
V32
F52
W49
V35
A23
C13
S3
L20
R31
W6
V21
V29
V16
M3
Q9
T26
S55
D10
M25
M1
S48
S54
S45
S12
S41
G22
T51
T47
G50
G28
G19
G11
G7
G30
G8
1
H (p.p.m.)
15
N (p.p.m.)
8.08.28.4 7.8
10.0
130
1 1121314151
Amino acid se
q
uence
–0.5
0.5
1.0
–1.0
0.0
C
SSP score
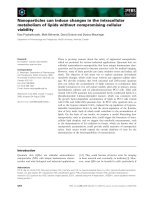
Fig. 8. NMR results for HCV-1b Core+1/S.
(A) Standard 2D
1
H–
15
N-HSQC spectrum
recorded at 600 MHz and 22 °Cona
100 l
M sample of HCV-1b Core+1/S. Each
cross-peak corresponds to a correlation
between an amide hydrogen atom and a
nitrogen atom. Assignments have been
deposited in the BMRB (Ref. 16487). (B)
Differences between experimental carbon
chemical shifts and random coil values as a
function of sequence number. (C) SSP of
HCV-1b Core+1/S. Carbon chemical shifts
were used to calculate the residue-specific
SSP scores of HCV-1b Core+1/S by follow-
ing the
SSP software recommendations.
Positive values ranging from 0 to 1 and neg-
ative values ranging from 0 to )1 represent
the propensities to form pure a-helix and
b-sheet structures, respectively. (D) Effects
of the nonionic detergent OG on HCV-1b
Core+1/S. The superimposition of 2D
1
H–
15
N-HSQC spectra of HCV-1b Core+1/S
in the absence (blue) or presence (green) of
6% OG is shown.
Biophysical characterization of HCV ARFP/Core+1/S A. Boumlic et al.
782 FEBS Journal 277 (2010) 774–789 ª 2010 The Authors Journal compilation ª 2010 FEBS
bandwidth of peaks from HSQC spectra recorded with
30 or 400 lm HCV-1b Core+1/S samples are strictly
identical (data not shown), suggesting the absence of a
concentration effect, at least in this concentration
range. On the other hand, the fact that the NMR tech-
nique is a very powerful method, allowing recording of
data at an atomic level, raises the question of potential
problems with experimental CD data collection and/or
inappropriate reference databases used to fit the CD
data. First, CD data were collected and analyzed fol-
lowing the key considerations well described by Green-
field [60], allowing us to reasonably rule out data
collection issues, although they are not fully excluded.
Second, the reference databases are derived from glob-
ular soluble proteins, and include only a few disor-
dered proteins. For instance, the SDP48 reference
database employed in the present study contains only
five denaturated proteins in a total of 48 proteins.
Therefore, the use of these databases for nonglobular
proteins is not really appropriate, as peptides or disor-
dered proteins tend to adopt multiple conformations in
equilibrium rather than a single structure.
Although the CD results might overestimate the
b-sheet content, both CD and NMR data qualitatively
indicate a b-sheet secondary structure propensity. This
observation suggests that the detected b-sheet signal
could be due to partial oligomerization of the natively
disordered HCV Core+1/S proteins. This hypothesis
is also supported by the DLS results, which reveal the
existence of relatively high molecular mass particles in
protein samples, although previously purified in a
monomeric form by size exclusion chormatography.
The residues involved in such oligomerization might be
located in the core of the protein between Ile33 and
Val35, as suggested by the chemical shift deviations
from random coil values. Despite their lack of
folded and globular structure, intrinsically disordered
states of proteins often possess significant amounts of
transient structure [47].
Biological roles of Core+1/S proteins
Most HCV proteins contain membrane anchor
domains [61]. The presence of hydrophobic patches on
Core+1/S protein sequences supports the hypothesis
that the proteins might contain membrane association
determinants, which may partially explain the polydis-
perse behavior of the protein in aqueous solution.
Interestingly, confocal microscopy and Triton X-100
cell fractionation have previously demonstrated that
HCV-1a Core+1/S localizes in internal membranes
and the endoplasmic reticulum of transiently transfect-
ed Huh7 cells [25]. Furthermore, the Core protein itself
has been found to be associated with membranes [48].
The influence on Core+1/S behavior of OG, a non-
ionic detergent known to solubilize integral membrane
proteins, was therefore investigated further. DLS
showed that OG micelles reduce Core+1/S dispersity.
Moreover, the CD spectrum showed a change on the
addition of the detergent. Finally, HSQC experiments
showed that only a few residues are affected by the
presence of OG. Taken together, these results are
indicative of a possible weak interaction with the
detergent, as is often observed for IDPs. However,
further experimental data on the structural character-
ization of a putative interaction between Core+1/S
proteins and membranes and comparison with the
membrane association properties of the Core protein
would be required.
The presence of circulating antibodies against the
HCV Core+1/S proteins suggests that their expression
might occur at a certain stage of HCV infection.
Furthermore, the facts that Core+1/S proteins are
disordered under native conditions, and that their
ORFs are well conserved among HCV genotypes,
support the hypothesis that the disordered nature of
Core+1/S proteins might have some roles during
HCV infection. The disordered nature of the Core+1/
S proteins, which confers conformational and recogni-
tion plasticity to the proteins, may be required for the
binding of different partners through the same region,
as is typical for natively disordered proteins [59]. This
feature is often found for proteins involved in cell
signaling and regulation [44]. Our study contributes to
the characterization of the Core+1/S proteins, provid-
ing new insights into their biophysical properties.
Further studies will be required to identify the cellular
targets of Core+1/S proteins, enabling the characteri-
zation of the role of Core+1/S proteins in HCV
pathogenicity.
Experimental procedures
Protein sequence analysis
To analyze the degree of conservation of the Core+1/S
amino acid sequence among HCV genotypes, Core+1/S
amino acid sequences were deduced from the Core+1
ORFs of different HCV genotypes retrieved from the NCBI
website () [5] and aligned using
clustalw [62]. Prediction of intrinsic disorder in proteins
was performed using globplot [63] and pondr [64]. Sec-
ondary structure predictions were performed on HCV-1a
and HCV-1b Core+1/S, using four algorithms (sopma,
gor4, simpa96, and phd [65–68]) available on the IBCP
website ( />A. Boumlic et al. Biophysical characterization of HCV ARFP/Core+1/S
FEBS Journal 277 (2010) 774–789 ª 2010 The Authors Journal compilation ª 2010 FEBS 783
Plasmid construction
Cloning was performed following standard methods, and
plasmids were verified by sequencing. For the cloning of
Core+1/S proteins, the fragments corresponding to resi-
dues 85–161 of the HCV-1a Core+1 ORF and residues
85–144 of the HCV-1b Core+1 ORF were obtained by
PCR, using as templates plasmid path 10/17-38 and pRSV/
AT (kindly provided by M. J. Beach, CDC, Atlanta, GA,
USA, and C. Bre
´
chot, INSERM U785, Paris, France,
respectively) [69], respectively. Primers used were as follows:
HCV-1a Core+1/S sense, 5¢-ATC CGG GGT CTC
CCA-
TG GCA ATG AGG GCT GCG GGT G-3¢; HCV-1b
Core+1/S sense, 5¢-ATC CGG GGT CTC
CCATG GCA
ATG AGG GCC TGG GGT G-3¢; HCV-1a Core+1/S
antisense, 5¢-AT CCG GGT CTC
GGTACC TTA TCA
CGC CGT C TT CCA GAA C-3¢; and HCV-1b Core+1/S
antisense, 5¢-AT CCG GGT CTC
GGTACC CTA GGG
GGG CGCC G A CG-3¢ (italic indicates BsaIsites;
underlined sequences correspond to Nco I sites for sense
primers, and Acc65I sites for antisense primers). PCR
fragments were diges ted with BsaI, and cloned into the
NcoIandAcc65I sites of pETm-60 (a g ift from G. Stier,
EMBL, Heidelberg, Germany). This vector is a modified
pET24d expression vector (Novagen, Darmstadt, Ger-
many) containing an N-terminal His6-NusA tag, followed
by a TEV-protease sensitive linker.
For HCV-1b Core+1 antigen preparation, the cDNA
fragment corresponding to residues 42–142 of the HCV-1b
Core+1 ORF was amplified using a template plasmid
pRSV/BNT (kindly provided by C. Bre
´
chot) [69] and the
following primers: sense, 5¢-CAT G
CC ATG GCA CCA ACC
GCC GCC CAC A-3¢; and antisense, 5¢-CCC
AAG CTT
GGG GGG CGC CGA CAA GC-3¢ (underlined sequences
indicate NcoI and HindIII sites, respectively). The PCR
product was inserted into the NcoI –HindIII sites of the pET-
20b(+) expression vector (Novagen) fused to a His6 tag.
Production of unlabeled and
15
N–
13
C-labeled
Core+1/S proteins in native conditions
E. coli BL21(DE3) bacteria were transformed with the con-
structs corresponding to His6-NusA–Core+1/S of HCV-1a
and HCV-1b. Overnight cultures of freshly transformed cells
were diluted 40-fold in 1 L of LB or M9 medium containing
antibiotics, and incubated at 37 °C until D
600 nm
reached 0.7.
Expression was induced by the addition of 0.5 mm isopropyl
thio-b-d-galactoside, and cells were incubated at 15 °C over-
night. Bacteria were harvested by centrifugation for 15 min
at 3000 g, and resuspended in buffer A (20 mm sodium phos-
phate, pH 6.8, 400 mm NaCl, 50 mm arginine, and 50 mm
glutamic acid [30]) containing 2.5 lg ÆmL
)1
DNase I,
2.5 lgÆmL
)1
RNase, and antiproteases. All purification steps
were performed at 4 °C. To minimize oxidation effects, all
buffers were degassed using a vacuum pump, and then
bubbled extensively with argon. Cells were sonicated on ice,
and lysates were then centrifuged at 16 000 g and 4 °C for
45 min. For purification by immobilized metal ion affinity
chromatography (IMAC), the supernatants were filtered and
loaded onto a column containing Ni
2+
–nitrilotriacetic acid
resin (Qiagen, Courtaboeuf, France) pre-equilibrated with
buffer A supplemented with 10 m m imidazole and one tenth
of the antiprotease concentration recommended by the
manufacturer. The column was washed with buffer A sup-
plemented with 10 mm imidazole, and then with buffer A
supplemented with 20 mm imidazole. The proteins were
eluted with buffer A containing 250 mm imidazole. After
desalting, the protein was mixed with recombinant TEV pro-
tease at a ratio of 10
)2
mol of TEV protease per mol of
NusA fusion. Incubation was performed at 20 °C for 3 h to
achieve cleavage of Core+1/S protein from NusA, leading
to the addition of glycine and alanine residues upstream of
the regular Core+1/S sequence. To eliminate protein aggre-
gates, protein solutions were centrifuged for 16 h at
160 000 g and 10 °C [70]. Supernatants corresponding to sol-
uble species were concentrated and loaded onto a Hiload 16/
60 Superdex 75 size exclusion chromatography resin (GE
Healthcare, Orsay, France) pre-equilibrated with buffer A.
Samples were concentrated using 5 kDa cutoff concentrators
(Sartorius, Goettingen, Germany), and protein concentra-
tions were measured by absorbance at 280 nm using extinc-
tion coefficients of 23 500 and 16 500 m
)1
Æcm
)1
for HCV-1a
and HCV-1b Core+1/S, respectively. Core+1/S samples
were stored in buffer A supplemented with sodium azide
(Sigma, Saint-Quentin Fallavier, France) and antiproteases.
All biophysical analyses were performed on freshly purified
proteins. When required, HCV-1a and HCV-1b Core+1/S
proteins were incubated in the presence of OG (Sigma). The
OG was used at a concentration 10 times higher than the
critical micellar concentration, corresponding to a final con-
centration of 6%. For chaotropic assays, samples were either
incubated at 100 °C for 20 min and then allowed to cool to
room temperature overnight, or incubated in 5 or 10 m urea
prior to analysis.
Antisera
The rabbit polyclonal antibody that specifically recognizes the
C-terminal part of HCV-1a Core+1 was described previously
[24]. Similarly, rabbit polyclonal antibody directed against
HCV-1b Core+1 was produced in rabbits, using HCV-1b
Core+1 antigen conjugated to complete Freund’s adjuvant
(Sigma), and used to immunize rabbits according to a classic
immunization protocol [71]. Antisera were collected 2 weeks
after the last booster, and used in western blot analysis.
SDS/PAGE and western blotting
Proteins were separated on Tricine SDS gels [72] and
stained with Coomassie blue. For western immunoblotting,
Biophysical characterization of HCV ARFP/Core+1/S A. Boumlic et al.
784 FEBS Journal 277 (2010) 774–789 ª 2010 The Authors Journal compilation ª 2010 FEBS
purified proteins were subjected to Tricine SDS/PAGE and
electrotransferred onto nitrocellulose membranes (What-
man, Maldstorm, UK). The membranes were incubated
with blocking solution (7% nonfat dry milk and 0.05%
Tween-20 in NaCl/P
i
) for 2 h at room temperature. Subse-
quently, the membrane was incubated overnight at 4 °C
with the antibody against Core+1 (HCV-1a or HCV-1b)
(1 : 500) in 1% semiskimmed dry milk and 0.05% Tween-
20 in 1 · NaCl/P
i
. After three washes with NaCl/P
i
/Tween,
the membranes were incubated for 2 h at room temperature
with an enhanced chemiluminescence peroxidase-conjugated
anti-rabbit secondary antibody (1 : 20 000; GE Healthcare)
diluted in 1% nonfat dry milk and 1% NP40 in 1 · NaCl/
P
i
. After three washes with NaCl/P
i
/NP40 and three washes
with NaCl/P
i
, bound antibodies were detected using the
enhanced chemiluminescence kit (GE Healthcare) according
to the manufacturer’s protocol.
MS analysis
Samples were diafiltered against 100 mm ammonium acetate
at pH 7.0, and subsequently diluted in a 1 : 1 water/aceto-
nitrile (v/v) mixture acidified with 1% formic acid to
achieve a concentration of 5 pmolÆmL
)1
. MS studies were
performed on an ESI-TOF mass spectrometer fitted with a
standard Z-spray source (LCT, Waters, MA, USA). Sample
solutions were introduced into the mass spectrometer
source with a syringe pump (Harvard Type 55 1111; Har-
vard Apparatus, South Natick, MA, USA) at a flow rate of
5 lLÆmin
)1
. Calibration was achieved in the positive ion
mode, using denaturated horse heart myoglobin (Sigma).
Human sera and ELISA
Microplate wells were coated with 5 lgÆmL
)1
HCV-1b Core
+1/S and incubated with 100 lL of diluted human serum
(10 HCV-1-infected patient and 10 HCV-negative serum
samples) at 37 °C for 1 h. The plates were washed and subse-
quently incubated with 100 lL of peroxidase-conjugated
affinity-purified goat anti-human IgG (Dako Cytomation) at
37 °C for 1 h. The wells were washed again, and allowed
to react with tetramethyl benzidine buffer (ThermoFisher,
Illkirch, France). The reaction was then analyzed at 450 nm.
Intrinsic fluorescence spectroscopy
Measurements were made using a SPEX Fluorolog-2 spec-
trofluorimeter (SPEX Industries, Inc., Edison, NJ, USA)
equipped with a 450 W xenon lamp, a double-grating
excitation monochromator, and a single-grating emission
monochromator. Data were acquired with a photon-
counting photomultiplier (linear up to 10
7
counts per s),
with high voltages fixed at 800 V. Slit widths were adjusted
to 4 mm for both excitation and emission. Samples of 1 lm
were placed in a quartz cuvette maintained at 20 °C. Fluo-
rescence was measured by exciting the sample at 280 nm
and recording the emission spectrum from 300 to 400 nm.
Spectra were systematically corrected for fluctuations in
lamp intensity and for background contributions (buffer
without or with detergent).
DLS
DLS experiments were performed at 20 °C using a
DynaPro instrument (Protein Solutions; Wyatt Technology
Corporation, Santa Barbara, CA, USA). Solutions of puri-
fied HCV-1a and HCV-1b Core+1/S proteins were concen-
trated up to 1 mgÆmL
)1
by ultrafiltration (5 kDa cutoff).
Aliquots were incubated with OG for 2 h at 25 °C, or sub-
jected to chaotropic agents. Prior to measurement, samples
were centrifuged for 15 min at 16 000 g in a benchtop cen-
trifuge. At least 10 measurements, each of 10 s duration,
were made for each sample. Extreme care was taken to
reduce contamination of samples by dust, and buffer alone
was systematically measured to check the presence of dust.
To calculate hydrodynamic radii of particles, scattering
data were analyzed using dynals, provided by the manu-
facturer. The contribution of low molecular mass particles
was filtered out. Finally, the size distributions were fitted
with a three-parameter Gaussian model, using matlab (The
Mathworks Inc., Natick, MA, USA), in order to determine
average hydrodynamic radii and polydispersities (defined as
the ratio of the standard deviation to the average hydro-
dynamic radius). When dynals yielded only two particle
sizes in the distribution, the fit was not performed, owing
to the reduced number of populations. In such a case, the
weighted average only was calculated.
CD
Far-UV CD measurements were performed with a Jobin-
Yvon spectropolarimeter, equipped with a temperature-
controlled water bath and calibrated with ammonium
d-10-camphorsulfonate. Spectra were acquired at 20 °C,
with a constant bandwidth of 2 nm and a 3–5 s integra-
tion time. Spectra were recorded using a quartz cell of
path length 0.2 mm. Protein concentrations were 4 lm in
20 mm sodium phosphate (pH 6.8), 50 mm NaCl, and
0.15 mm dithiothreitol. Spectra were averaged over three
to six scans, and corrected for buffer contributions. When
possible, quantitative estimations of the secondary struc-
ture contents were performed using the cdpro program
suite [35], which includes three methods (contin/ll,
cdsstr, and selcon3). Three reference protein sets were
used: SP43 (43 globular proteins), SMP56 (SP43 plus 13
membrane proteins), and SDP48 (SP43 plus five dena-
tured proteins). In order to determine the variability of
secondary structure content, several CD experiments were
performed in duplicate or triplicate, and the data were
A. Boumlic et al. Biophysical characterization of HCV ARFP/Core+1/S
FEBS Journal 277 (2010) 774–789 ª 2010 The Authors Journal compilation ª 2010 FEBS 785
then deconvoluted. The typical range of variation was
± 10–20%.
NMR spectroscopy
Samples for NMR spectroscopy were prepared in buffer A
supplemented with 7% D
2
O. Spectra were acquired at
600 MHz and 25 °C on a Bruker DRX600 spectrometer
equipped with a z-gradient triple resonance cryoprobe.
Data were processed using nmrpipe, [73] and analyzed with
cara [74]. A
15
N-labeled Core+1/S sample was used to
record 2D
1
H–
15
N-HSQC correlation spectra. Core+1/S
backbone and b-carbon resonances were assigned by using
a 400 lm
15
N,
13
C-labeled Core+1/S sample and recording
2D
1
H–
15
N-HSQC and triple-resonance 3D HNCO,
HN(CA)CO, HNCA, HNCACB and HN(CO)CA spectra.
The assignment has been deposited at the BMRB [75]
under accession code 16487. Secondary shift values were
calculated as the differences between measured carbon
chemical shifts and the empirical random coil value taken
from Wishart and Sykes [76]. ssp was used to estimate the
SSP for each assigned residue [40].
Acknowledgements
This work was supported by a grant of the Agence
Nationale de la Recherche contre le SIDA et les He
´
pa-
tites Virales (ANRS). A. Boumlic was recipient of
doctoral grants from the ANRS and the European
Doctoral College of the University of Strasbourg.
We thank H. Nierengarten (CEBGS, IGBMC) for
performing MS analysis, A. Kakkanas and E. Asla-
noglou for their help in raising during antibodies, and
A. Chappelle for technical support. We are grateful to
A. Atkinson and M A. Delsuc for critical reading of
the manuscript.
References
1 Choo QL, Kuo G, Weiner AJ, Overby LR, Bradley
DW & Houghton M (1989) Isolation of a cDNA clone
derived from a blood-borne non-A, non-B viral hepati-
tis genome. Science 244, 359–362.
2 Giannini C & Brechot C (2003) Hepatitis C virus
biology. Cell Death Differ 10(Suppl. 1), S27–S38.
3 Bartenschlager R, Frese M & Pietschmann T (2004)
Novel insights into hepatitis C virus replication and
persistence. Adv Virus Res 63, 71–180.
4 Simmonds P, Holmes EC, Cha TA, Chan SW,
McOmish F, Irvine B, Beall E, Yap PL, Kolberg J &
Urdea MS (1993) Classification of hepatitis C virus into
six major genotypes and a series of subtypes by
phylogenetic analysis of the NS-5 region. J Gen Virol
74(Pt 11), 2391–2399.
5 Simmonds P, Bukh J, Combet C, Deleage G, Enomoto
N, Feinstone S, Halfon P, Inchauspe G, Kuiken C,
Maertens G et al. (2005) Consensus proposals for a uni-
fied system of nomenclature of hepatitis C virus geno-
types. Hepatology 42, 962–973.
6 van Regenmortel M (2004) The International Universal
Virus Database. Version 4. Colombia University,
New York.
7 Tsukiyama-Kohara K, Iizuka N, Kohara M & Nomoto
A (1992) Internal ribosome entry site within hepatitis C
virus RNA. J Virol 66, 1476–1483.
8 Wang C, Sarnow P & Siddiqui A (1994) A conserved
helical element is essential for internal initiation of
translation of hepatitis C virus RNA. J Virol 68,
7301–7307.
9 Kolykhalov AA, Feinstone SM & Rice CM (1996)
Identification of a highly conserved sequence element at
the 3¢-terminus of hepatitis C virus genome RNA.
J Virol 70, 3363–3371.
10 Xu Z, Choi J, Yen TS, Lu W, Strohecker A, Govind-
arajan S, Chien D, Selby MJ & Ou J (2001) Synthesis
of a novel hepatitis C virus protein by ribosomal frame-
shift. EMBO J 20, 3840–3848.
11 Varaklioti A, Vassilaki N, Georgopoulou U & Mavro-
mara P (2002) Alternate translation occurs within the
Core coding region of the hepatitis C viral genome.
J Biol Chem 277, 17713–17721.
12 Walewski JL, Keller TR, Stump DD & Branch AD
(2001) Evidence for a new hepatitis C virus antigen
encoded in an overlapping reading frame. RNA 7,
710–721.
13 Branch AD, Stump DD, Gutierrez JA, Eng F &
Walewski JL (2005) The hepatitis C virus alternate
reading frame (ARF) and its family of novel products:
the alternate reading frame protein/F-protein, the dou-
ble-frameshift protein, and others. Semin Liver Dis 25,
105–117.
14 Vassilaki N & Mavromara P (2003) Two alternative
translation mechanisms are responsible for the expres-
sion of the HCV ARFP/F/Core+1 coding open reading
frame. J Biol Chem 278, 40503–40513.
15 Boulant S, Becchi M, Penin F & Lavergne JP (2003)
Unusual multiple recoding events leading to alternative
forms of hepatitis C virus Core protein from geno-
type 1b. J Biol Chem 278 , 45785–45792.
16 Wolf M, Dimitrova M, Baumert TF & Schuster C
(2008) The major form of hepatitis C virus alternate
reading frame protein is suppressed by Core protein
expression. Nucleic Acids Res 36, 3054–3064.
17 Baril M & Brakier-Gingras L (2005) Translation of the
F protein of hepatitis C virus is initiated at a non-AUG
codon in a +1 reading frame relative to the polypro-
tein. Nucleic Acids Res 33, 1474–1486.
18 McMullan LK, Grakoui A, Evans MJ, Mihalik K, Puig
M, Branch AD, Feinstone SM & Rice CM (2007)
Biophysical characterization of HCV ARFP/Core+1/S A. Boumlic et al.
786 FEBS Journal 277 (2010) 774–789 ª 2010 The Authors Journal compilation ª 2010 FEBS
Evidence for a functional RNA element in the hepati-
tis C virus Core gene. Proc Natl Acad Sci USA 104,
2879–2884.
19 Vassilaki N, Friebe P, Meuleman P, Kallis S, Kaul A,
Paranhos-Baccala G, Leroux-Roels G, Mavromara P &
Bartenschlager R (2008) Role of hepatitis C virus
Core+1 open reading frame and Core cis-acting RNA
elements in viral RNA translation and replication.
J Virol 82, 11503–11515.
20 Troesch M, Jalbert E, Canobio S, Boulassel MR, Routy
JP, Bernard NF, Bruneau J, Lapointe N, Boucher M &
Soudeyns H (2005) Characterization of humoral and
cell-mediated immune responses directed against hepati-
tis C virus F protein in subjects co-infected with hepati-
tis C virus and HIV-1. Aids 19, 775–784.
21 Bain C, Parroche P, Lavergne JP, Duverger B, Vieux C,
Dubois V, Komurian-Pradel F, Trepo C, Gebuhrer L,
Paranhos-Baccala G et al. (2004) Memory T-cell-medi-
ated immune responses specific to an alternative
Core protein in hepatitis C virus infection. J Virol 78,
10460–10469.
22 Wu WB, Shao SW, Zhao LJ, Luan J, Cao J, Gao J,
Zhu SY & Qi ZT (2007) Hepatitis C virus F protein
up-regulates c-myc and down-regulates p53 in human
hepatoma HepG2 cells. Intervirology 50, 341–346.
23 Shao SW, Wu WB, Bian ZQ, Yu JG, Zhao P, Zhao LJ,
Zhu SY & Qi ZT (2008) Hepatitis C virus F protein
inhibits cell apoptosis by activation of intracellular
NF-kappaB pathway. Hepatol Res 39, 282–289.
24 Vassilaki N, Boleti H & Mavromara P (2007) Expres-
sion studies of the Core+1 protein of the hepatitis C
virus 1a in mammalian cells. The influence of the Core
protein and proteasomes on the intracellular levels of
Core+1. FEBS J 274, 4057–4074.
25 Vassilaki N, Boleti H & Mavromara P (2008) Expres-
sion studies of the HCV-1a Core+1 open reading frame
in mammalian cells. Virus Res 133, 123–125.
26 Vassilaki N, Kalliampakou KI & Mavromara P (2008)
Differences in the expression of the hepatitis C virus
Core+1 open reading frame between a nuclear and a
cytoplasmic expression system. J Gen Virol 89, 222–231.
27 Uversky VN (2002) What does it mean to be natively
unfolded? Eur J Biochem 269, 2–12.
28 Dunker AK, Lawson JD, Brown CJ, Williams RM,
Romero P, Oh JS, Oldfield CJ, Campen AM, Ratliff
CM, Hipps KW et al. (2001) Intrinsically disordered
protein. J Mol Graph Model 19 , 26–59.
29 De Marco V, Stier G, Blandin S & de Marco A (2004)
The solubility and stability of recombinant proteins are
increased by their fusion to NusA. Biochem Biophys Res
Commun 322, 766–771.
30 Golovanov AP, Hautbergue GM, Wilson SA & Lian
LY (2004) A simple method for improving protein
solubility and long-term stability. J Am Chem Soc 126,
8933–8939.
31 Nomine Y, Charbonnier S, Ristriani T, Stier G,
Masson M, Cavusoglu N, Van Dorsselaer A, Weiss E,
Kieffer B & Trave G (2003) Domain substructure of
HPV E6 oncoprotein: biophysical characterization of
the E6 C-terminal DNA-binding domain. Biochemistry
42, 4909–4917.
32 Lakovicz JR (1983) Principle of Fluorescence Spectros-
copy. Wiley, New York.
33 Uversky VN (2009) Intrinsically disordered proteins
and their environment: effects of strong denaturants,
temperature, pH, counter ions, membranes, binding
partners, osmolytes, and macromolecular crowding.
Protein J 28, 305–325.
34 Kelly SM, Jess TJ & Price NC (2005) How to study
proteins by circular dichroism. Biochim Biophys Acta
1751, 119–139.
35 Sreerama N & Woody RW (2000) Estimation of protein
secondary structure from circular dichroism spectra:
comparison of CONTIN, SELCON, and CDSSTR
methods with an expanded reference set. Anal Biochem
287, 252–260.
36 Uversky VN (2009) Intrinsic disorder in proteins associ-
ated with neurodegenerative diseases. Front Biosci 14,
5188–5238.
37 Wu
¨
thrich K (1986) NMR of Proteins and Nucleic Acids.
Wiley, New York, NY.
38 Hass M, Thuesen M, Christensen H & Led J (2004)
Characterization of us-ms dynamics of proteins using a
combined analysis of 15N NMR relaxation and chemi-
cal shift: conformational exchange in plastocyanin
induced by histidine protonations. J Am Chem Soc 126,
753–765.
39 Wang Y & Jardetzky O (2002) Probability-based pro-
tein secondary structure identification using combined
NMR chemical shift data. Protein Sci 11, 852–861.
40 Marsh J, Singh V, Jia Z & Forman-Kay J (2006)
Sensitivity of secondary structure propensity to
sequence differences between alpha and beta-synuclein:
implications for fibrillation. Protein Sci 15, 2795–2804.
41 Yao J, Dyson HJ & Wright PE (1997) Chemical shift
dispersion and secondary structure prediction in
unfolded and partly folded proteins. FEBS Lett 419,
285–289.
42 Uversky VN, Gillespie JR & Fink AL (2000) Why are
‘natively unfolded’ proteins unstructured under physio-
logic conditions? Proteins 41, 415–427.
43 Wright PE & Dyson HJ (1999) Intrinsically unstruc-
tured proteins: re-assessing the protein structure–
function paradigm. J Mol Biol 293, 321–331.
44 Uversky VN, Oldfield CJ & Dunker AK (2005) Showing
your ID: intrinsic disorder as an ID for recognition, regu-
lation and cell signaling. J Mol Recognit 18, 343–384.
45 Dunker AK & Obradovic Z (2001) The protein
trinity – linking function and disorder. Nat Biotechnol
19, 805–806.
A. Boumlic et al. Biophysical characterization of HCV ARFP/Core+1/S
FEBS Journal 277 (2010) 774–789 ª 2010 The Authors Journal compilation ª 2010 FEBS 787
46 Dunker AK, Brown CJ, Lawson JD, Iakoucheva LM &
Obradovic Z (2002) Intrinsic disorder and protein func-
tion. Biochemistry 41, 6573–6582.
47 Tompa P, Szasz C & Buday L (2005) Structural disor-
der throws new light on moonlighting. Trends Biochem
Sci 30, 484–489.
48 Boulant S, Vanbelle C, Ebel C, Penin F & Lavergne JP
(2005) Hepatitis C virus Core protein is a dimeric
alpha-helical protein exhibiting membrane protein
features. J Virol 79, 11353–11365.
49 Duvignaud JB, Savard C, Fromentin R, Majeau N,
Leclerc D & Gagne SM (2009) Structure and dynamics
of the N-terminal half of hepatitis C virus Core protein:
an intrinsically unstructured protein. Biochem Biophys
Res Commun 378, 27–31.
50 Liang Y, Kang CB & Yoon HS (2006) Molecular and
structural characterization of the domain 2 of
hepatitis C virus non-structural protein 5A. Mol Cells
22, 13–20.
51 Hanoulle X, Verdegem D, Badillo A, Wieruszeski JM,
Penin F & Lippens G (2009) Domain 3 of
non-structural protein 5A from hepatitis C virus is
natively unfolded. Biochem Biophys Res Commun 381,
634–638.
52 Dokland T, Walsh M, Mackenzie JM, Khromykh AA,
Ee KH & Wang S (2004) West Nile virus Core protein;
tetramer structure and ribbon formation. Structure 12,
1157–1163.
53 Ma L, Jones CT, Groesch TD, Kuhn RJ & Post CB
(2004) Solution structure of dengue virus capsid protein
reveals another fold. Proc Natl Acad Sci USA 101,
3414–3419.
54 Murray CL, Marcotrigiano J & Rice CM (2008) Bovine
viral diarrhea virus Core is an intrinsically disordered
protein that binds RNA. J Virol 82, 1294–1304.
55 Sigalov AB, Kim WM, Saline M & Stern LJ (2008) The
intrinsically disordered cytoplasmic domain of the T-cell
receptor zeta chain binds to the Nef protein of simian
immunodeficiency virus without a disorder-to-order
transition. Biochemistry 47, 12942–12944.
56 Shojania S & O’Neil JD (2006) HIV-1 Tat is a natively
unfolded protein: the solution conformation and
dynamics of reduced HIV-1 Tat-(1–72) by NMR
spectroscopy. J Biol Chem 281, 8347–8356.
57 Bourhis JM, Johansson K, Receveur-Brechot V,
Oldfield CJ, Dunker KA, Canard B & Longhi S (2004)
The C-terminal domain of measles virus nucleoprotein
belongs to the class of intrinsically disordered proteins
that fold upon binding to their physiological partner.
Virus Res 99, 157–167.
58 Bourhis JM, Receveur-Brechot V, Oglesbee M, Zhang
X, Buccellato M, Darbon H, Canard B, Finet S &
Longhi S (2005) The intrinsically disordered C-terminal
domain of the measles virus nucleoprotein interacts with
the C-terminal domain of the phosphoprotein via two
distinct sites and remains predominantly unfolded.
Protein Sci 14, 1975–1992.
59 Fink AL (2005) Natively unfolded proteins. Curr Opin
Struct Biol 15, 35–41.
60 Greenfield NJ (2006) Using circular dichroism spectra
to estimate protein secondary structure. Nat Protoc 1,
2876–2890.
61 Penin F, Dubuisson J, Rey FA, Moradpour D &
Pawlotsky JM (2004) Structural biology of hepatitis C
virus. Hepatology 39, 5–19.
62 Thompson JD, Higgins DG & Gibson TJ (1994)
ClustalW: improving the sensitivity of progressive
multiple sequence alignment through sequence
weighting, position-specific gap penalties and weight
matrix choice. Nucleic Acids Res 22, 4673–4680.
63 Linding R, Russell RB, Neduva V & Gibson TJ (2003)
GlobPlot: exploring protein sequences for globularity
and disorder. Nucleic Acids Res 31, 3701–3708.
64 Romero P, Obradovic Z & Dunker AK (2004) Natively
disordered proteins: functions and predictions.
Appl
Bioinformatics 3, 105–113.
65 Geourjon C & Deleage G (1995) SOPMA: significant
improvements in protein secondary structure prediction
by consensus prediction from multiple alignments.
Comput Appl Biosci 11, 681–684.
66 Garnier J, Gibrat JF & Robson B (1996) GOR method
for predicting protein secondary structure from amino
acid sequence. Methods Enzymol 266, 540–553.
67 Levin JM (1997) Exploring the limits of nearest
neighbour secondary structure prediction. Protein Eng
10, 771–776.
68 Rost B, Sander C & Schneider R (1994) PHD –
an automatic mail server for protein secondary
structure prediction. Comput Appl Biosci 10, 53–60.
69 Delhem N, Sabile A, Gajardo R, Podevin P, Abadie A,
Blaton MA, Kremsdorf D, Beretta L & Brechot C
(2001) Activation of the interferon-inducible
protein kinase PKR by hepatocellular carcinoma
derived hepatitis C virus Core protein. Oncogene 20,
5836–5845.
70 Zanier K, Nomine Y, Charbonnier S, Ruhlmann C,
Schultz P, Schweizer J & Trave G (2007) Formation of
well-defined soluble aggregates upon fusion to MBP is a
generic property of E6 proteins from various human
papillomavirus species. Protein Expr Purif 51, 59–70.
71 Harlow E (1988) Antibodies, a Laboratory Manual. Cold
Spring Harbor Laboratory Press, New York.
72 Schagger H & von Jagow G (1987) Tricine–sodium
dodecyl sulfate–polyacrylamide gel electrophoresis for
the separation of proteins in the range from 1 to
100 kDa. Anal Biochem 166, 368–379.
73 Delaglio F, Grzesiek S, Vuister GW, Zhu G, Pfeifer J
& Bax A (1995) NMRPipe: a multidimensional spectral
processing system based on UNIX pipes. J Biomol
NMR 6, 277–293.
Biophysical characterization of HCV ARFP/Core+1/S A. Boumlic et al.
788 FEBS Journal 277 (2010) 774–789 ª 2010 The Authors Journal compilation ª 2010 FEBS
74 Keller R (2004) The Computer Aided Resonance Assign-
ment Tutorial, CANTINA Verlag, Goldau.
75 Ulrich EL, Akutsu H, Doreleijers JF, Harano Y, Ioan-
nidis YE, Lin J, Livny M, Mading S, Maziuk D, Miller
Z et al. (2008) BioMagResBank. Nucleic Acids Res 36,
D402–D408.
76 Wishart DS & Sykes BD (1994) The 13C chemical-shift
index: a simple method for the identification of protein
secondary structure using 13C chemical-shift data.
J Biomol NMR 4, 171–180.
Supporting information
The following supplementary material is available:
Fig. S1. Expression and purification screenings of
native NusA-HCV-1a Core+1/S proteins.
Fig. S2. 2D NMR spectra of HCV-1a Core+1/S pro-
tein.
This supplementary material can be found in the
online version of this article.
Please note: As a service to our authors and readers,
this journal provides supporting information supplied
by the authors. Such materials are peer-reviewed and
may be re-organized for online delivery, but are not
copy-edited or typeset. Technical support issues arising
from supporting information (other than missing files)
should be addressed to the authors.
A. Boumlic et al. Biophysical characterization of HCV ARFP/Core+1/S
FEBS Journal 277 (2010) 774–789 ª 2010 The Authors Journal compilation ª 2010 FEBS 789