Bank Capital Adequacy in Australia Byung Kyoon Jang and Niamh Sheridan pdf
Bạn đang xem bản rút gọn của tài liệu. Xem và tải ngay bản đầy đủ của tài liệu tại đây (1.02 MB, 20 trang )
Bank Capital Adequacy in Australia
Byung Kyoon Jang and Niamh Sheridan
WP/12/25
© International Monetary Fund
:3
IMF Working Paper
Asia and Pacific Department
Bank Capital Adequacy in Australia
Prepared by Byung Kyoon Jang and Niamh Sheridan
1
Authorized for distribution by Ray Brooks
January 2012
Abstract
The paper finds that, given Australia’s conservative approach in implementing the Basel II
framework, Australian banks’ headline capital ratios underestimate their capital strengths.
Given their high capital quality and the progress in their funding profiles since the global
financial crisis, the Australian banks are making good progress toward meeting the Basel III
requirements, including the new liquidity standards. Stress tests calibrated on the Irish crisis
experience show that the banks could withstand sizable shocks to their exposure to residential
mortgages. However, combining residential mortgage shocks with corporate losses expected
at the peak of the global financial crisis would put more pressure on Australian banks’ capital.
Therefore, it would be useful to consider the merits of higher capital requirements for
systemically important domestic banks.
JEL Classification Numbers: G20, G21, G28, F32
Keywords: Australia, Canada, Basel II, Basel III, capital, loss given default, probability of
default, stress tests
Author’s E-Mail Address:
,
1
The authors would like to thank the Reserve Bank of Australia, the Australian Prudential Regulation Authority,
and the Australian Treasury for their valuable comments on earlier drafts of this paper. We benefited greatly
from comments and suggestions from Ray Brooks, Nancy Rawlings, Kate Seal, Liliana Schumacher, and
Nicolas Blancher. Kessia De Leo and Solomon Stavis provided excellent assistance.
This Working Paper should not be reported as representing the views of the IMF.
The views expressed in this Working Paper are those of the authors and do not necessarily
represent those of the IMF or IMF policy. Working Papers describe research in progress by the
author(s) and are published to elicit comments and to further debate.
2
Contents Page
I. Introduction 3
II. Features of the Australian Banking System 3
III. Basel II Implementation and Capital Ratios 6
IV. Basel III and Australian Banks 11
V. How Vulnerable are Australian Banks to Shocks to Residential Mortgages? 13
Figures
1. Assets of Four Major Banks for Selected Countries, 2010 4
2. Banking Sector Assets for Selected Countries 4
3. Bank Nonperforming Loans to Total Loans 6
4. Bank Nonperforming Loans to Total Loans 6
5. Indebted Households, 2009 6
6. Total Short-Term External Debt 6
7. Loss Given Default on Residential Mortgages 6
8. Total Regulatory Capital Ratio, 2010 7
9. Tier 1 Regulatory Capital Ratio, 2010 7
10. Tangible Common Equity to Risk Weighted Assets, 2010 7
11. Tangible Common Equity to Tangible Assets, 2010 7
12. Nonperforming Housing Loans 8
13. Loss Given Default on Residential Mortgages 8
14. Probability of Default on Residential Mortgages 9
15. PD Range and Composition of Residential Mortgages 9
16. Canada: PD Range and Composition of Residential Mortgages, October 2010 10
17. Australia: PD Range and Composition of Residential Mortgages, September 2010 10
18. Average Risk Weights for Residential Mortgages 10
19. Capital Ratios: Comparison with Canada 10
20. Funding Composition of Banks in Australia 12
21. Where the Four Major Australian Banks Stand vis-à-vis the NSFR 13
22. Net Stable Funding Ratio, 2010 13
23. Ireland: Loan-to-Value Ratios at Origination 14
24. Capital Ratio Change 15
25. Ireland: Stress-Test Assumptions vs. Recent Developments 16
Tables
1. Australia’s Four Major Banks: Selected Financial Soundness Indicators 5
2. Australia’s Four Largest Banks: LGD for Residential Mortgages and Impact on
Capital Adequacy Ratios 9
3. Westpac: Credit Risk Exposure 13
4. Ireland: Four Large Banks’ Residential Mortgages 14
5. Australian Four Large Banks: Impact on Capital 15
6. Banking System Stress Tests’ Assumptions 17
References 18
3
I. INTRODUCTION
The Australian banking system was resilient during the global financial crisis, attributed in
part to intensive supervision and sound regulation. The banking sector is profitable with
capital above regulatory minimums and is dominated by four major banks (all Australian-
owned). They are individually and collectively large relative to the size of the banking system
and their combined assets are large relative to GDP.
Banks’ main vulnerabilities are their exposure to highly indebted households through
residential mortgage lending, together with their sizable short-term offshore borrowing.
Household debt is high at about 150 percent of disposable income but is held mainly by
higher income households. Moreover, exposure to high-risk mortgages is small. The potential
risks associated with household lending are mitigated by a number of factors, including
banks’ prudent lending practices and Australian Prudential Regulation Authority (APRA)’s
conservative approach in implementing the Basel II framework. Banks also have reduced their
use of short-term offshore wholesale funding by increasing deposits and lengthening the tenor
of their funding, but short-term external debt remains sizable.
The paper finds that the four major Australian banks have capital well about the regulatory
requirements with high quality capital. While their headline capital ratios are below the global
average for large banks in a sample of advanced and emerging market economies, Australia’s
more conservative approach in implementing the Basel II framework implies that Australian
banks’ headline capital ratios underestimate their capital strength. For example, a comparison
with Canadian banks highlights the impact of Australia’s more conservative approach. The
four major Australian banks are well-positioned to meet the higher capital requirements under
Basel III, and with the improvements in their funding profiles since the global financial crisis
they are making good progress toward meeting the Basel III liquidity standards.
Stress tests calibrated on the Irish crisis experience show that the banks are largely able to
withstand sizable shocks to their exposure to residential mortgages. However, combining
residential mortgage shocks with corporate losses expected at the peak of the global financial
crisis would bring down the banks’ average total capital ratio below the regulatory minimum.
Given high bank concentration and market uncertainty, therefore, the merits of higher capital
requirements need to be considered for systemically important domestic banks, taking into
account the currently evolving international standards.
II. F
EATURES OF THE AUSTRALIAN BANKING SYSTEM
The Australian banking system is dominated by the four major banks and banking
concentration increased in the wake of the global financial crisis. The assets of the four major
banks are around 75 percent of total banking sector assets and 80 percent of the residential
mortgage market. The increase in concentration was due to the slower growth of smaller
4
banks normally reliant on securitization, constrained by reduced access to funding; reduced
lending by foreign-owned banks in the wake of the crisis; and acquisitions of two medium-
sized banks by the larger banks in 2008 (St. George by Westpac and BankWest by
Commonwealth Bank of Australia, the latter purchase being of a foreign-owned bank).
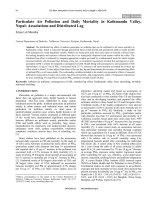
For international comparison of the dominance of the four major banks, the combined assets
of the four largest banks in a sample of advanced and emerging market countries are
compared to total banking sector assets and to GDP. Relative to the size of the total banking
sector, Australia lies in the middle of the distribution (Figure 1). The combined assets of the
four major banks in Australia are about 180 percent of GDP. This is towards the center of the
distribution for the sample of countries and in the middle of similar countries (Figure 2).
The large size of the four banks relative to GDP and the banking system behooves careful
attention to their vulnerabilities and resilience to shocks.
2
Any distress among these banks
could have a sizable impact on the financial sector and the real economy in Australia and
New Zealand.
3
Moreover, they may be perceived by the markets as too big to fail, which
implies they could pose a potential fiscal liability. Against this backdrop and in the context of
the ongoing discussion for systemically important global banks, the merits of higher capital
requirements, complemented by intensive supervision, need to be considered for
systematically important domestic banks.
4
2
APRA takes a graduated risk-based approach to supervision through its Probability and Impact Rating System
(PAIRS) and Supervisory Oversight and Response System (SOARS), whereby banks are assessed and assigned
an undisclosed overall risk of failure (PAIRS) which is then combined with an assessment of impact of such a
failure. The outcome of this is to place an institution into a supervisory category (SOARS). The four categories
which are not publically disclosed are normal; oversight; mandated improvement; and restructure. See APRA
(2010b) and APRA (2010c).
3
Subsidiaries and branches of the four major Australian banks control 90 percent of the assets of New Zealand’s
banking sector.
4
See BCBC (2011) for capital requirements for global systemically important banks, and Financial Stability
Board (2010) for recommendations on enhancing the effectiveness and intensity of SIFI supervision.
0
20
40
60
80
100
120
140
BEL
SGP
SWI
NLD
FRA
SWE
NZL
ESP
UK
CAN
AUS
JPN
MEX
BRA
CHN
HK
AUT
DEU
US
TUR
KOR
ITL
IRL
IND
RUS
Figure 1. Assets of Four Major Banks for Selected
Countries, 2010
(In percent of these banks' home country banking sector assets)
Sources: Bankscope; Banks' Annual Reports; and IMF staff calculations.
0
50
100
150
200
250
300
350
400
450
500
0
50
100
150
200
250
300
350
400
450
500
HK
SWZ
BEL
UK
IRL
SGP
ESP
SWE
AUT
NLD
AUS
NZL
CAN
JPN
CHN
KOR
DEU
ITA
BRA
US
FRA
TUR
IND
MEX
RUS
Figure 2. Banking Sector Assets for Selected Countries 1/
(Four largest banks as a percentage of these banks' home-country GDP, end 2010)
1/ AUS represents the four large Australian banks (Australia and New Zealand
Bank, Commonwealth Bank, National Australia Bank, and Westpac).
Sources: Bankscope; Banks' Annual Reports; and IMF staff calculations.
5
The four major banks’ key financial soundness indicators are summarized in Table 1, which
highlights some of their strengths. All the four banks are profitable with capital above
regulatory minimums. Capital adequacy has improved, driven both by increases in capital and
declines in risk-weighted assets, and the quality of bank capital is high, as it is mainly
common equity.
Australian banks’ conservative lending practices, together with robust supervision by APRA
and the Australian economy’s strong performance since the global crisis, have contributed to
a low nonperforming loan ratio compared to other advanced countries (Figures 3 and 4).
5
Despite banks’ high exposure to residential mortgages (56 percent of total loans at end-2010),
exposure to high-risk mortgages is small, as less than 10 percent of owner-occupiers had
mortgages with loan-to-value ratios higher than 80 percent and debt service ratios greater than
30 percent.
6
Moreover, debt is mainly held by higher income households, with households in
the top two income quintiles holding almost three quarters of household debt (Figure 5). The
full recourse nature of mortgage lending also helps limit strategic loan defaults.
5
Australia was one of the few advanced economies to avoid a recession in recent years, reflecting its strong
position at the onset of the global financial crisis and a supportive macroeconomic policy response.
6
See Reserve Bank of Australia (2010a).
Sep-11 Sep-10 Sep-11 Sep-10 Jun-11 Jun-10 Sep-11 Sep-10
Profitability
Return on assets 1.0 0.9 0.8 0.7 1.0 1.0 1.1 1.1
Return on equity 16.2 15.5 15.2 13.5 19.5 18.7 16.0 16.4
Net interest margin 2.5 2.5 2.2 2.2 2.2 2.1 2.2 2.2
Capital adequacy
Tier one capital ratio (Basel II) 10.9 10.1 9.7 8.9 10.0 9.1 9.7 9.1
Total capital ratio (Basel II) 12.1 11.9 11.3 11.4 11.7 11.5 11.0 11.0
TCE/Tota
l
Assets 2
/
5.2 5.2 4.6 4.6 4.5 4.3 4.8 4.6
TCE/Tangible Assets 3
/
5.3 5.2 4.7 4.7 4.5 4.4 4.9 4.7
Assets quality and provisioning
Past due 90 days plus/total loans
0.5 0.4 0.4 0.5 0.8 0.7 0.4 0.5
Gross impaired to total assets 0.8 1.1 0.8 0.9 0.8 0.8 0.7 0.7
Net impaired assets to equity 1.2 1.7 11.6 11.9 8.5 9.1 7.2 7.4
Specific provision to gross impaired assets 7.8 12.3 23.1 23.3 40.1 38.2 31.7 35.4
Total provision to gross impaired assets 36.5 30.9 62.3 70.7 97.2 104.1 87.6 102.7
Liquidity
Cash to total assets 4.2 4.0 3.6 3.8 2.0 1.6 2.4 0.7
Cash and due from banks to total assets 5.7 5.1 9.8 9.3 3.5 3.1 3.7 2.8
Sources: Banks' disclosure statements, and Fund staff calculations.
1/ Includes St. George.
2/ TCE = tangible common equity = total equity minus intangible assets (including goodwill).
3/ Tangible assets = total assets minus intangible assets (including goodwill).
ANZ NAB CBA Westpac 1/
Table 1. Australia's Four Major Banks: Selected Financial Soundness Indicators
(In percent)
6
Australian banks’ use of short-term offshore funding creates an additional vulnerability as the
banks are exposed to potential disruptions in global capital markets. Short-term debt (mostly
held by banks) has declined from its pre-crisis peak but remains sizable at 45 percent of GDP
at end-September 2011 (Figure 6). In a favorable development, the maturity profile of short-
term debt has also been extended, with a greater share maturing in the six-month to one year
window.
III. B
ASEL II IMPLEMENTATION AND CAPITAL RATIOS
A conservative approach to bank regulation
and supervision helped maintain financial
sector stability in Australia. In implementing
the Basel II framework, APRA required banks
to adopt a more conservative approach in
several cases than required by the Basel II
framework, as noted in the IMF’s Basel II
Implementation Assessment in 2009. Most
importantly, a 20 percent loss given default
(LGD) floor was adopted for residential
mortgages, above the Basel II floor of
0
2
4
6
8
10
12
0
2
4
6
8
10
12
2005 2006 2007 2008 2009 2010
Australia
Canada
Greece
United States
Figure 3. Bank Nonperforming Loans to Total Loans
(In percent)
Source: GFSR.
0
2
4
6
8
10
12
14
0
2
4
6
8
10
12
14
2005 2006 2007 2008 2009 2010
Ireland
New Zealand
Portugal
Spain
United Kingdom
Figure 4. Bank Nonperforming Loans to Total Loans
(In percent)
Source: GFSR
3%
7%
18%
28%
44%
First
Second
Third
Fourth
Fifth
Quintiles*
Figure 5. Indebted Households, 2009
(Share of household debt held by income quintiles)
* Income quintiles include all households.
Sources: RBA; and Hilda Release 9.0.
150
200
250
300
350
400
450
500
20
30
40
50
60
70
80
Sep-05 Jun-06 Mar-07 Dec-07 Sep-08 Jun-09 Mar-10 Dec-10 Sep-11
AUS NZL SPN IRL (RHS) UK (RHS)
Figure 6. Total Short-Term External Debt 1/
(In percent of GDP)
1/ Short-term debt is on a residual maturity basis for Australia and New
Zealand and on an original maturity basis for other countries.
Source: WB-IMF-RES-OECD; Joint External Debt Hub; and IMF staff calculations
10
12
14
16
18
20
22
24
10
12
14
16
18
20
22
24
Q1 2009 Q3 2009 Q3 2010
CAN 1/ AUS 2/ ESP 3/ GBR 4/ NZL 5/
Figure 7. Loss Given Default on Residential Mortgages
(In percent)
1/ Four largest banks.
2/ Four largest banks.
3/ Two largest banks. Reporting dates Q4 2008 and Q4 2009.
4/ Three banks. Reporting dates Q4 2008 and Q4 2009.
5/ Four largest banks.
Sources: Banks' disclosure statements and IMF staff estimates.
7
10 percent. As a result, Australian banks’ loss-given-default rates are higher than those of
many other countries’ banks (Figure 7). In addition, higher risk weights were required for
certain residential mortgages under the standardized approach. Moreover, reduced risk
weights, which are permissible in the Basel II framework’s standardized approach, were not
introduced for retail lending. Until June 2011 banks’ capital requirements under the advanced
approaches remained subject to the 90 percent floor of the Basel I capital requirement, instead
of the 80 percent floor applicable in the second year. APRA has also exercised caution in
other choices regarding the framework, such as requiring banks using the advanced
approaches to hold capital against interest rate risk in the banking book.
The headline regulatory ratios for the four major Australian banks are lower than for other
countries (Figures 8 and 9). However, differences in regulatory rules relating to the calculation
of required capital suggest that different jurisdictions’ capital ratios should be interpreted with
caution. In particular, the risk weighted assets numbers are not directly comparable across
countries. APRA’s requirements for computing risk-weighted assets likely imply that risk-
weighted assets in Australia are higher than for comparable banks in other countries, resulting in
lower headline capital ratios for the same amount of capital. Moreover, due to APRA’s
conservative capital eligibility and deduction rules Australian banks tend to hold higher quality
capital and this is reflected in their higher rankings in tangible common equity ratios compared
with their rankings in total and Tier 1 capital ratios (Figures 10 and 11).
0
5
10
15
20
25
0
5
10
15
20
25
Figure 8. Total Regulatory Capital Ratio, 2010
(Four largest banks, in selected countries)
Sources: Bankscope; and IMF staff calculations.
0
5
10
15
20
25
0
5
10
15
20
25
Figure 9. Tier 1 Regulatory Capital Ratio, 2010
(Four largest banks, in selected countries)
Sources: Bankscope; and IMF staff calculations.
0
5
10
15
20
25
0
5
10
15
20
25
Figure 10. Tangible Common Equity to Risk Weighted
Assets, 2010
(Four largest banks, in selected countries)
Sources: Bankscope; and IMF staff calculations.
0
2
4
6
8
10
12
14
16
18
20
0
2
4
6
8
10
12
14
16
18
20
Figure 11. Tangible Common Equity to Tangible Assets,
2010
(Four largest banks, in selected countries)
Sources: Bankscope; and IMF staff calculations.
8
Although regulatory differences relating to the calculation of required capital ratios imply that
comparisons of banks across jurisdictions should be interpreted with caution, the Pillar 3
disclosure statements facilitate comparisons of banks, both within and across jurisdictions.
This paper uses information from these statements to compare the capital ratios of the four
major banks in Australia with those in Canada, providing a detailed analysis of the impact of
APRA’s conservative approach in
implementing the Basel II framework
relating to residential mortgages. Canada
was chosen as a comparator country because
nonperforming housing loan ratios in
Australia and Canada have been broadly
similar in recent years (Figure 12).
7
All the
eight banks in the two countries studied in
this paper are rated by Fitch AA or AA- and
adopted the advanced internal ratings based
approach under Basel II.
Australian banks’ high LGD rates required
by APRA result in higher Pillar 1 risk
weighted assets for the same amount of
residential mortgages, compared with most
other countries’ banks (Figure 13).
8
This in
turn leads to lower capital ratios for the same
amount of capital. For example, if Australian
banks’ LGD rates are reduced to the Basel II
10 percent floor, which is the rate for one of
the four Canadian banks,
9
the four major
Australian banks’ weighted average Tier 1
and total capital ratios are estimated to increase by almost 100 basis points, respectively
7
Canadian banks weathered the global financial crisis well without big increases in nonperforming housing
loans. To address housing market concerns and rising household debt levels, however, the Canadian authorities
introduced the following amendments to mortgage lending regulations in 2010-11: (i) require that all borrowers
meet the standards for a five-year fixed rate mortgage even if they choose a mortgage with a lower interest rate
and a shorter term; (ii) lower the maximum amount Canadians can withdraw in refinancing their mortgages from
95 percent of the value of their homes to 90 percent in 2010, with a further reduction to 85 percent in 2011;
(iii) require a minimum down payment of 20 percent for government-backed mortgage insurance on non-owner-
occupied properties purchased for speculation; (iv) lower the maximum amortization period for new government
insured mortgages from 35 to 30 years; and (v) eliminate Canadian government backing for homeowner equity
lines of credit.
8
For residential mortgages, capital requirement = LGD × f (PD). See BCBS (2006), p. 70.
9
This bank provides about 40 percent of the total residential mortgages underwritten by the four large banks in
Canada.
5
10
15
20
25
5
10
15
20
25
Q1 2009 Q3 2009 Q1 2010 Q3 2010
AUS weighted average 1/ CAN weighted average 2/
AUS min CAN min
Figure 13. Loss Given Default on Residential Mortgages
(In percent)
1/ Includes ANZ, CBA, NAB, and Westpac.
2/ Includes BMO, CIBC, Scotiabank, and TD Bank.
Sources: Banks' disclosure statements; and IMF staff calculations.
0
1
2
3
4
5
6
7
8
9
0
1
2
3
4
5
6
7
8
9
Jan-90 Jan-92 Jan-94 Jan-96 Jan-98 Jan-00 Jan-02 Jan-04 Jan-06 Jan-08 Jan-10
Australia** US** Canada**+ Spain UK+
Figure 12. Nonperforming Housing Loans
(In percent of loans*)
* Percent of loans by value. Includes 'impaired' loans unless otherwise stated. For
Australia, only includes loans 90+ days in arrears prior to September 2003.
** Banks only.
+ Percent of loans by number that are 90+ days in arrears.
Sources: APRA; Bank of Spain; Canadian Bankers’ Association; Council of Mortage
Lenders; FDIC; and RBA.
9
(Table 2). Even if Australian banks’ LGD rates are lowered to Canada’s four large banks’
average of 13.9 percent, the four major Australian banks’ Tier 1 and total capital ratios are
estimated to increase by about 60 basis points, respectively.
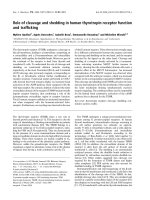
The weighted average of the probabilities of default (PD) on residential mortgages for the
Australian four major banks is 2½ times that of Canada’s three large banks, although
nonperforming housing loan ratios in Australia and Canada have been broadly similar in
recent years (Figure 14).
10
In Canada, mortgages insured by government-owned Canada
Mortgage and Housing Corporation (CMHC) are assigned a zero risk weight for regulatory
capital requirement purposes.
11
Thus, almost 70 percent of the four large Canadian banks’
residential mortgages belong to the lowest risk bucket, compared with just 40 percent of the
four major Australian banks (Figures 15).
10
The Bank of Montreal (BMO)’s disclosure statements don’t report exposure-weighted probabilities of default
for PD ranges so that the BMO is excluded in this comparison.
11
Mortgages covered by approved private insurers are assigned a slightly higher weight. CMHC accounts for
about 70 percent of all outstanding mortgage insurance. Due to the regulatory capital reductions provided by
mortgage insurance, about two thirds of Canadian mortgages are insured. See Kiff (2010).
Tier 1 capital Total capital
Using current LGD (20.2% 1/) 9.4 11.4
Assuming LGD 10% 10.3 12.5
Assuming LGD 15% 9.9 12.0
Assuming average for Canadian 4 large banks' LGD (13.9% 1/) 10.0 12.1
1/ Weighted averages
Sources: Banks' disclosure statements; and IMF staff estimates.
Capital adequacy ratios 1/
Table 2. Australia's Four Largest Banks:
LGD for Residential Mortgages and Impact on Capital Adequacy Ratios
(In percent)
0
0.5
1
1.5
2
2.5
0
0.5
1
1.5
2
2.5
Q1 2009 Q3 2009 Q1 2010 Q3 2010
AUS weighted average 1/ CAN weighted average 2/
AUS min CAN min
Figure 14. Probability of Default on Residential Mortgages
(In percent)
1/ Includes ANZ, CBA, NAB, and Westpac.
2/ Includes BMO, CIBC, Scotiabank, and TD Bank.
Sources: Banks' disclosure statements; and IMF staff estimates.
0
10
20
30
40
50
60
70
80
0
10
20
30
40
50
60
70
80
0.0 to 0.2 0.2 to 0.5 0.5 to 2.0 2.0 to 10.0 10.0 to 99.9 100
Australia (Sept 2010) 1/
Canada (Oct 2010) 2/
Figure 15. PD Range and Composition of Residential
Mortgages
(In percent of total)
PD Range
1/ Includes ANZ, CBA, NAB, and Westpac. For CBA, data for December 2010.
2/ Includes BMO, CIBC, Scotiabank, and TD Bank.
Sources: Banks' disclosure statements; and IMF staff estimates.
10
Reflecting the differences in PD and LGD, the Australian banks’ average risk weight is
almost 2½ times the average of the Canadian banks (Figure 18). If the Canadian banks’ risk
weight is applied to the Australian banks, their total capital ratio is estimated to rise by more
than 120 basis points and the Tier 1 capital ratio by about 100 basis points (Figure 19).
Different jurisdictions apply different approaches to the definitions of eligible capital, Pillar 1
risk-weighted assets, and capital limits, and regulators’ supervisory review process of banks’
own internal capital adequacy assessment could also play an important role in defining the
level of capital held.
12
Given Australian banks’ high exposure to residential mortgages, the
above analysis focuses on factors affecting the calculation of risk weighted assets for
mortgages and their impacts on capital ratios for the banks taking advanced internal rating-
based approach under Basel II.
12
APRA, for example, requires an interest rate risk in the banking book to be a Pillar 1 capital requirement in
addition to credit, market, and operational risks. Other jurisdictions such as Canada and the UK do not require
this. If this requirement is excluded, the four large Australian banks’ average Tier 1 and total capital ratios are
estimated to rise by about 40 and 50 basis points, respectively.
0
10
20
30
40
50
60
70
80
90
0
10
20
30
40
50
60
70
80
90
0.0 to 0.2 0.2 to 0.5 0.5 to 2.0 2.0 to 10.0 10.0 to 99.9 100
CIBC TDB Scotia BMO
Figure 16. Canada: PD Range and Composition of Residential
Mortgages, October 2010
(In percent of total)
PD Range
Sources: Banks' disclosure statements; and IMF staff estimates.
0
10
20
30
40
50
60
0
10
20
30
40
50
60
0.0 to 0.2 0.2 to 0.5 0.5 to 2.0 2.0 to 10.0 10.0 to 99.9 100
NAB Westpac ANZ CBA
Figure 17. Australia: PD Range and Composition of Residential
Mortgages, September 2010 1/
(In percent of total)
PD Range
Sources: Banks' disclosure statements; and IMF staff estimates.
1/ For CBA, data for December 2010.
0
5
10
15
20
25
0
5
10
15
20
25
Q1 2009 Q3 2009 Q1 2010 Q3 2010
AUS weighted average 1/ CAN weighted average 2/
AUS min CAN min
Figure 18. Average Risk Weights for Residential Mortgages
(In percent)
1/ Includes ANZ, CBA, NAB, and Westpac.
2/ Includes BMO, CIBC, Scotiabank, and TD Bank.
Sources: Banks' disclosure statements; and IMF staff calculations.
0
2
4
6
8
10
12
14
16
18
20
22
0
2
4
6
8
10
12
14
16
18
20
22
Tier 1 capital Total capital
Actual
RWA adjusted using LGD=10 for residential mortgages
RWA adjusted using Canadian banks' risk weight for residential mortgages
Figure 19. Capital Ratios: Comparison with Canada
(In percent)
Canada 1
/
Canada 1/
Australia 2/
Australia 2/
1/ Four large Canadian banks (BMO, CIBC, Scotia and TD).
2/ Four large Australian banks (ANZ, Commonwealth, NAB,and Westpac).
Sources: Banks' disclosure statements; and IMF staff calculations.
11
The above analysis does not take into account the differences in the definitions of eligible
capital. A fuller analysis of all the variances would facilitate international comparisons of
headline capital ratios in different countries. For example, analysis by Australia and New
Zealand Bank indicates that its Tier 1 capital ratio would rise from 10.1 percent in September
2010 under Australian rules to 13.5 percent under UK rules.
13
Westpac’s analysis also shows
that its common equity ratio of 8 percent in March 2011 would increase sharply to 13 percent
under Canadian rules. These increases partly relate to less conservative LGD assumptions in
other jurisdictions, but also relate to differences in the definitions of eligible capital.
IV. B
ASEL III AND AUSTRALIAN BANKS
Basel III will require banks to hold more and higher-quality capital. Given the high quality of
bank capital in Australia, as it is mainly common equity, the Australian banks are in a good
position to meet these new requirements.
14
Under Basel II, moreover, APRA adopted several
rules on the definition of capital and the calculation of RWA which are more conservative than
the Basel III rules. Westpac’s analysis, for example, indicates that its common equity ratio of
8 percent in March 2011 would rise to 9.6 percent if APRA’s rules are fully harmonized to
Basel III. APRA proposed in a recent discussion paper that Australian banks will be required to
hold a minimum 4.5 percent Common Equity Tier 1 ratio and a 6 percent Tier 1 capital ratio
from January 2013, ahead of the Basel III timetable. APRA also proposed introducing a capital
conservation buffer of 2.5 percent from January 2016.
Basel III also introduces global liquidity standards—a Liquidity Coverage Ratio (LCR) and a
Net Stable Funding Ratio (NSFR). The objective of the LCR is to ensure that banks have
adequate high-quality liquid assets to survive an acute stress scenario that lasts for one month.
In many jurisdictions, banks will meet this requirement largely through holdings of
government securities. In the case of Australia, the supply of government securities is
somewhat limited due to the fiscal restraint of recent governments so that an alternative
approach will be necessary, as allowed for under the Basel III reforms. APRA and the
Reserve Bank of Australia (RBA) have designed an approach to meet the new liquidity
standard. Banks will be able to establish a committed secured liquidity facility with the RBA.
This will be designed to cover any shortfall between a bank’s holdings of high-quality liquid
assets and the LCR requirement. The collateral for this facility includes all assets normally
13
See the Australian Bankers’ Association (2010) for the differences between the Australian and UK rules. The
main differences in the measurement of eligible Tier 1 capital relate to equity investments, dividends, and
expected loss and eligible provisions, generally resulting in larger Tier 1 capital deductions under APRA rules.
14
In implementing Basel III APRA has proposed to revise some existing requirements that are more
conservative than the Basel III minimum requirements such as alignment of treatment of expected dividends and
of unrealized gains and losses recognized with Basel III. APRA will take a more conservative approach requiring
capitalized expenses and capitalized transaction costs to be deducted from capital and will remove the double
counting of capital in the financial system and on investments in commercial institutions (APRA, 2011a).
12
Figure 20. Funding Composition of Banks in Australia 1/
(In percent of funding)
1/ Adjusted for movements in foreign exchange rates.
2/ Includes deposits and intragroup funding from non-residents.
Sources: APRA; RBA.
Deposits
Short-term debt
Long-term debt
Securitisation
0
10
20
30
40
50
60
2004 2006 2008 2010
Domestic
Short-term
debt 2/
Long-term debt
0
10
20
30
40
50
60
2004 2005 2007 2008 2010
Non-residents
eligible for repurchase transactions with the RBA and banks will be charged an ongoing fee
for access to this facility.
15
The NSFR requirement under Basel III, which remains under development within the BCBS,
requires that banks have sufficient stable sources of funding.
16
Since the global financial crisis
the funding structure of Australian banks
has improved, with an increase in retail
deposits and long-term wholesale funding
and a reduced reliance in short-term
offshore funding (on an original maturity
basis) (Figure 20).
17
Our estimates suggest
that the NSFR has improved for three of
the four major Australian banks over the
past three years (Figure 21). For
international comparison, Figure 22 shows
estimated NSFRs for the Australian banks
against the same sample of banks used for
the capital ratio comparison above. These
ratios are not published by banks so they need to be interpreted cautiously. However, as can
be seen, most banks, including the Australian banks, lie below the 100 percent benchmark,
with the Australian banks at or just below the average level. Revised laws now permit
Australian banks to issue covered bonds, which may help increase the share of long-term
funding further.
18
15
The fee will be 15 basis points per annum. See APRA (2011b and 2011c) and />releases/2011/mr-11-25.html for additional information.
16
This metric compares an estimate of the reliable funding sources to an estimate of the required stable funding
over a 1 year horizon. Differing weights, determined by their behavioral characteristics, are applied to the
components of the banks’ balance sheet and the requirement is that this ratio be above 100 percent.
17
Data for short-term debt on a residual maturity basis are only available for the whole economy, but private
financial institutions comprise about two thirds of Australia’s gross external debt, and banks presumably have a
similar share of short-term debt.
18
Previously, Australian banks were not allowed to issue covered bonds because covered bondholders would
have preferential access to a bank’s assets, thereby subordinating other unsecured creditors such as ordinary
depositors. This conflicted with the Banking Act, which enshrined in law the principle of depositor
preference.
In
October 2011, the Australian Parliament passed legislation permitting banks to issue covered bonds. This may
provide Australian banks with access to cheaper and more stable long-term funding from the wholesale debt
markets.
13
V. HOW VULNERABLE ARE AUSTRALIAN BANKS TO SHOCKS TO RESIDENTIAL
MORTGAGES?
To assess the risks of residential mortgage lending, which comprises more than half of the
four major banks’ loans, this paper uses the September 2011 data published by the banks on
their risk exposure. Following the adoption of the Basel II internal ratings-based approach, the
four major banks publish a breakdown of residential mortgage, corporate, and other retail
lending exposure disaggregated into seven risk categories in the Pillar 3 statements. For each
risk category, the probability of default, loss given default, and risk weights are reported (see
for example, data from Westpac in table 3 below).
The four major banks are exposed to residential mortgages, but the data in the Pillar 3
disclosure statements show that residential mortgage lending is considered by the banks to be
less risky than corporate and other retail lending. The average risk weight for corporate
lending at Westpac, for example, is four times that for residential mortgages (Table 3). Thus,
although the amount of corporate lending is just a quarter of residential mortgages in the case
of Westpac, the required capital for corporate lending is the same as for residential mortgages,
reflecting the assessment that corporate lending is riskier.
60
65
70
75
80
85
90
95
100
60
65
70
75
80
85
90
95
100
2008 2009 2010
Figure 21. Where the Four Major Australian Banks Stand
vis-à-vis the NSFR
(In percent)
Sources: Bankscope; Banks' Annual Reports; and IMF staff estimates.
40
50
60
70
80
90
100
110
120
130
140
40
50
60
70
80
90
100
110
120
130
140
Figure 22. Net Stable Funding Ratio, 2010
(Four largest banks, in selected countries)
Sources: Bankscope; and IMF staff calculations.
Exposure Probability Loss Given Average Risk Risk Weighted
at Default of Default Default Weight Assets
Corporate 92,389 2.3% 45% 61% 56,792
Business lending 60,254 5.8% 32% 72% 43,661
Small business 9,974 3.9% 37% 42% 4,232
Residential mortgages 376,480 1.5% 20% 15% 56,597
Credit cards 17,376 2.3% 78% 28% 4,884
Other retail 9,553 5.3% 66% 84% 8,029
Sovereign 35,034 0.04% 9% 4% 1,492
Bank 26,677 0.08% 54% 25% 6,627
Other 72,829 52,543
Total 700,566 234,857
Source: Westpac's disclosure statement.
Table 3. Westpac: Credit Risk Exposure
(As of September 30, 2011; in millions of Australian dollars)
14
The scenarios considered in the paper apply Irish banks’ residential mortgage developments
during the global financial crisis to Australian banks’ balance sheet. The Irish banks’
residential mortgage quality has deteriorated
sharply, due to the large increases in
unemployment to 13.6 percent in 2010 from
4.6 percent in 2007 and a 46 percent decline in
housing prices from the peak in 2007 through
November 2011, together with high loan-to-
value ratios at origination (Figure 23). With
Australian banks’ prudent lending practices,
including low loan-to-value ratios, Australia
would be unlikely to see such a sharp
deterioration in asset quality. Nevertheless, this
experience is used to calibrate tail-risk
scenarios for the Australian banks in order to see whether they are resilient to such severe
stress scenarios.
To apply the Irish experience to the Australian banks, the paper assumes that the shares of the
three riskiest categories for residential mortgages at the four Australian banks would rise to
those of the Irish banks in 2010 and the share of the next low risk category would decline
accordingly (Table 4).
19
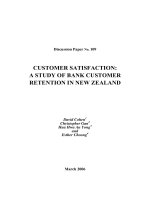
Under this scenario (Scenario 1), the four Australian banks’ probability of default is estimated
to increase sharply to 11 percent from 2 percent and the estimated losses would be larger than
the banks’ total provisions, resulting in a reduction in the banks’ capital. The banks’ Tier 1
19
The data in Table 4 are based on prior disclosure standards for banks. To improve the number and quality of
disclosures the Irish authorities have recently strengthened disclosure standards. See
/>releases/Pages/CentralBankpublishesImpairmentProvisioningandDisclosureGuidelines.aspx
2010 2009 2008 2007
High and Good quality 66.8 69.1 77.9 83.3
Satisfactory quality 15.0 15.8 14.6 11.7
Lower quality 2.92.72.32.1
Past due but not impaired 6.7 6.0 4.2 2.6
Impaired loans 8.56.41.00.2
Total 100.0 100.0 100.0 100.0
Nonperforming loans 11.4 8.7 2.4 0.8
Source: Banks' disclosure statements and IMF staff estimates.
1/ Includes Anglo Irish Bank, Irish Life and Permanent plc, Bank of Ireland, and
Allied Irish Banks. Includes estimates of assets transferred to National Asset
Management agency (NAMA).
Table 4. Ireland: Four Large Banks' Residential Mortgages 1/
(In percent of total)
0%
10%
20%
30%
40%
50%
60%
70%
80%
90%
100%
0%
10%
20%
30%
40%
50%
60%
70%
80%
90%
100%
2004 2005 2006 2007 2008
100% and above 96% to 99% 91% to 95%
81% to 90% 71% to 80% Up to 70%
Source: Department of Environment, Heritage, and Local Government.
Figure 23. Ireland: Loan-to-Value Ratios at Origination
15
capital ratio is estimated to decline by 1½ percentage points (Figure 24 and Table 5). But all
the four banks’ Tier 1 capital ratio would
remain well above the regulatory minimum
ratio of 4 percent. Under a second scenario
that is scenario 1 plus an increase of the LGD
and risk weights by 1½ times (Scenario 2),
one bank’s total capital ratio is projected to
decline to below 6 percent, but the other
banks’ total capital ratios to remain above 8
percent. Such a large increase in the LGD is
unlikely to happen, given Australia’s low
loan-to-value ratios and modest house price
overvaluation estimated at 10–15 percent.
The primary driver for the reductions in
capital ratios under both scenarios is downward internal ratings migration, which pushes up
the measure of risk-weighted assets and, hence, capital requirements.
September 2011 Scenario 1 Scenario 2
Actual 1/
Residential mortgage
exposures: assume the
shares of the 3 highest
risk categories at the
levels of Irish banks
Scenario 1 plus
increases of LGD and
RW by 1½ times
Credit exposure
Residential mortgages 2/ 1,204,001 1,204,001 1,204,001
Total 2,603,910 2,603,910 2,603,910
Residential mortgages
PD (%) 3/ 2.0 11.1 11.1
LGD (%) 3/ 20.2 20.3 30.4
Risk weight (%) 3/ 17.0 30.3 45.4
Risk weighted assets
Residential mortgages 2/ 205,058 364,223 546,334
Total 1,182,705 1,341,870 1,523,981
Capital
Tier 1 119,002 114,863 107,666
Total 136,074 127,796 113,908
Provisions 19,499 19,499 19,499
Estimated loss 4,411 27,777 41,665
Total loss to capital … 8,278 22,166
Capital adequacy ratio
Tier 1 (%) 3/ 10.1 8.6 7.1
Total (%) 3/ 11.5 9.5 7.5
Sources: Banks' disclosure statements and IMF staff estimates.
1/ Includes Australia and New Zealand Bank, Commonwealth Bank, National Australian Bank, and Westpac.
2/ Mortgages subject to an internal ratings-based approach only.
3/ Weighted averages.
Table 5. Australian Four Large Banks: Impact on Capital
(In millions of Australian dollars, unless otherwise indicated)
-4.5
-4
-3.5
-3
-2.5
-2
-1.5
-1
-0.5
0
-4.5
-4
-3.5
-3
-2.5
-2
-1.5
-1
-0.5
0
Tier 1 capital Total capital Tier 1 capital Total capital
Net Tier 1 capital change
RWA driven
Figure 24. Capital Ratio Change
(In percent)
* Assuming the shares of the 3 highest risk categories for residential mortgage
exposures at the levels of Irish banks.
** Scenario 1 plus increases of LGD and RW by 1.5 times.
Sources: Banks' disclosure statements; and IMF staff calculations.
Scenario 1 * Scenario 2 **
16
The above exercise suggests that the major Australian banks could withstand sizable shocks to
residential mortgages. However, this exercise does not consider shocks to corporate and other
lending, which should be considered when banks conduct stress testing. For example, Irish
banks incurred heavy losses from commercial property lending, which amounted to
31 percent of total loans in 2006. The average haircut applied when commercial property
loans were transferred to Ireland’s national asset management agency was about 58 percent.
The four major Australian banks’ corporate exposures, including commercial property
lending, are about one-quarter of total bank exposures, which is sizeable. Their commercial
property exposures are around 10 percent of total loans, which are well below Irish banks’
exposure of 31 percent. Robust supervision by APRA implies that, even in a tail risk scenario,
the Irish experience with the corporate sector and commercial real estate in particular is
unlikely to be replicated in Australia. Takats and Tumbarello (2009) estimated the Australian
banks’ expected losses from corporate sector distress one year ahead at about 6 percent of
their loans to the corporate sector during the peak of the global financial crisis.
20
If these
losses are applied as a tail-risk shock to the banks’ corporate exposures, the four banks’
average total capital ratio will decline by more than 2 percentage points to about 7 percent
under the above Scenario 1 and 5¼ percent under Scenario 2, which are below the regulatory
minimum. Potential losses from other credit exposures such as retail lending and personal
loans are not taken into account in this calculation.
APRA may want to consider a more severe downside scenario together with funding risk and
a longer risk horizon when conducting stress testing next time. In 2010, APRA conducted
stress testing together with the New Zealand authorities (see Laker, 2010). The joint stress test
results suggest banks’ resilience to sizable but plausible shocks. However, a more severe
downside scenario of a sharp fall in commodity and house prices and a jump in global longer-
term interest rates could hurt growth and
raise unemployment for a substantially
longer period than in the recent stress tests.
Given Australian banks’ high exposure to
residential mortgages, a longer time horizon
could be considered to take into account the
impact of sustained high unemployment.
The risk horizons of the recent FSAP stress
tests for United Kingdom, Germany, and
Netherlands are five years (Table 6). The
recent Irish experience also shows severe
shocks for a longer period than the stress
test assumptions of 2006 (Figure 25). Moreover, funding risk also needs to be explicitly
20
The potential losses were calculated using information from Moody’s KMV implied CDS spreads at end-April
2009.
0
20
40
60
80
100
120
140
-10
-5
0
5
10
15
20
25
30
T T+1 T+2 T+3 T+4 T+5
GDP growth GDP growth
Unemployment Unemployment
House Price Index (rhs) House Price Index (rhs)
Figure 25. Ireland: Stress-Test Assumptions vs. Recent
Developments
FSAP Stress-Tests (2006)
Recent Crisis (2007-2012)
2005=100
2007=100
Source: Irish FSAA Update (2006); and WEO.
17
included in future scenarios, encompassing a disruption to bank funding and a large increase
in longer-term real interest rates. The latter could come from a rise in global rates and an
increase in Australian banks’ risk premium.
While continued strong bank supervision plays a significant role in maintaining financial
stability, the merits of higher capital requirements need to be considered for systemically
important domestic banks, taking into account the currently evolving international standards.
The large market share of the four banks in the domestic market implies that they could be
perceived as too big to fail and pose a potential fiscal risk. Analysis of the appropriate capital
requirements could be undertaken over the next year (including using stress tests) in the
context of the 2012 update of the Financial Sector Stability Assessment with the IMF. More
robust capital levels for systemically important banks would be beneficial, particularly in
times of market uncertainty.
Germany Netherlands UK
FSAP stress
tests
(2005/06)
APRA stress
tests (2010) FSAP (2011)
FSAP stress
tests (2006) EBA test (2011) FSAP (2010)
APRA stress tests
(2010) FSAP (2011)
Stress test horizon (years) 3 3 5 3 2 5 3 5
GDP growth 1/ -1 -3
2.6 SD from baseline
(also consider
prolonged slow
growh over five years)
-4.8 -1.6
Two SD from
baseline
-2.3
Two SD from baseline
(also consider
prolonged slow growh
over five years)
(number of SD from
beginning year's outturn) 2/
-2.3 -2.4 -3.3 -3.3 -0.2 -0.1 -2.6
(number of SD from
historical mean) 2/
-2.4 -3.5
-2.3
-3.0 -2.0 -2.3 -3.5
-1 percent in
year 1 then V-
shaped
recovery
-3 percent in
year 1 then V-
shaped
recovery
- 1 percent in year 2
then 2.7 percent in
year 3
-5 percent
cumulatively
over 3 years
-1.6 percent in
year 1 then a 0.3
percent increase
-2.3 percent in
year 1 then V
-
shaped recovery
negative growth (yoy)
for nine quarters
Unemployment 3/ 9 10.8
2.6 SD from baseline
9.7 15.8
T
wo
SD
f
rom
baseline
9.8
12
(number of SD from
beginning year's outturn) 2/
2.4 3.2 1.1 0.4 1.8 1.7
(number of SD from
historical mean) 2/
0.8 1.9 -0.3 6/ 0.9 1.7 1.6
House price inflation 4/ -30 -25 0 5
/
-20 -33 -25 -14
Funding risk Yes No Yes Yes Yes Yes No Yes
Sources: Various stress test reports and IMF staff calculations.
1/ The lowest growth rate assumed.
2/ Based on the data from 1981-2005.
3/ The highest umemployment rate assumed.
4/ Cumulative.
5/ House prices in Germany have been flat for more than a decade.
6/ Owing due to double digit unemployment rates from 1982-1997. The average umployment rate for 2000-05 was 4.3 percent.
Australia
New ZealandIreland
Table 6. Banking System Stress Tests' Assumptions
(In percent)
18
References
Australian Bankers’ Association Inc., 2009, Comparison of Regulatory Capital Frameworks:
APRA and the UK FSA, June.
Australian Prudential Regulation Authority (APRA), 2010a, Insight, Issue 2.
____________, 2010b, Supervisory Oversight and Response System, November.
____________, 2010c, Probability and Impact Rating System, November.
____________, 2011a, Implementing Basel III Capital Reforms in Australia, September.
____________, 2011b, The RBA Committed Liquidity Facility, Media Release, November.
____________, 2011c, Implementing Basel III Liquidity Reforms in Australia, November.
Basel Committee on Banking Supervision (BCBS), 2006, International Convergence of
Capital Measurement and Capital Standards: A Revised Framework.
____________, 2009, Strengthening the Resilience of the Banking Sector, December.
____________, 2011, Global Systemically Important Banks: Assessment Methodology and
the Additional Loss Absorbency Requirement, November.
Bologna, Pierluigi, 2010, “Australian Banking System Resilience: What Should be Expected
Looking Forward? An International Perspective,” IMF Working Paper No. 10/228
(Washington: International Monetary Fund).
Davis, Kevin, 2011, The Australian Financial System in the 2000s, paper presented at the
Reserve Bank of Australia, Annual Research Conference, August.
Debelle, Guy, 2011, Collateral, Funding and Liquidity, Address to Conference on Systemic
risk, Basel III, Financial Stability and Regulations, June.
European Banking Authority, 2011, 2011 EU-Wide Stress Test: Methodological Note, March.
Financil Stability Board, 2010, Intensity and Effectiveness of SIFI Supervision:
Recommendations for Enhanced Supervision, November.
____________, 2011, Peer Review of Australia, September.
International Monetary Fund, 2010, Australia: Basel II Implementation Assessment, IMF
Country Report No. 10/107, May.
19
Kiff, John, 2010, “Canada’s Housing Finance System: Policy Backdrop,” in Canada: Selected
Issues Paper, IMF Country Report No. 10/378 (Washington: International Monetary
Fund).
Laker, J.F., 2010, The Australian Banking System Under Stress?, Australian Business
Economists, Sydney, June 9.
Reserve Bank of Australia, 2010a, Financial Stability Review, March.
____________, 2010b, Australian Implementation of Global Liquidity Standards, Joint Media
Release, December.
Takats, E., and P. Tumbarello, 2009, “Australian Bank and Corporate Sector
Vulnerabilities—An International Perspective,” IMF Working Paper No. 09/223
(Washington: International Monetary Fund).