Overview of the Capital Markets in Vietnamand Directions for Development
Bạn đang xem bản rút gọn của tài liệu. Xem và tải ngay bản đầy đủ của tài liệu tại đây (1.88 MB, 71 trang )
Overview of the Capital Markets in Vietnam
and Directions for Development
May 2006
2
This report reflects the state of Vietnam’s capital markets as of the end of October 2005.
The report disseminates the findings of work in progress to encourage the exchange of
ideas about development issues. The report carries the names of the authors and should
be cited accordingly. The findings, interpretations, and conclusions expressed in this
paper are entirely those of the authors. They do not necessarily represent the view of the
World Bank, its Executive Directors, or the countries they represent.
3
Table of Contents
1 Introduction 11
1.1 Objectives 11
1.2 Methodology 11
1.3 The Structure of the Report 11
2 Macroeconomic Overview 12
2.1 Current Situation and Discussion 12
2.2 Conclusion and Recommendations 13
3 Financial Market Overview 15
3.1 Current Situation and Discussion 15
3.2 Conclusion and Recommendations 17
4 Capital Market Environment 18
4.1 SOE equitization 18
4.2 Foreign Direct Investment 24
4.3 Private sector development 25
4.4 Conclusion and Recommendations 26
5 Operations of Capital Markets 29
5.1 Regulatory framework 29
5.2 Market activities 32
5.3 Conclusion and Recommendations 39
6 Two Principal Problems for Capital Market Development 41
6.1 Management of the secondary market for government securities 41
6.2 Weak incentive for financing in Vietnam’s securities markets 45
6.3 Conclusion and Recommendations 48
7 Policy & Institutional issues 49
7.1 A lack of coherent structural design of the financial sector 49
7.2 Insufficient financial statistics and lack of information sharing 50
7.3 Conclusion and Recommendations 51
8 Formulate formal and simple rules for information sharing. Recommendations for the Five-year
Plan 52
8.1 Private-sector initiatives for market development 52
8.2 Policy impacts of capital market development 52
8.3 Policy inputs and outputs 53
8.4 Priority and sequence 53
8.5 Monitoring of Market Development 54
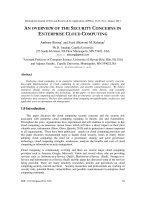
4
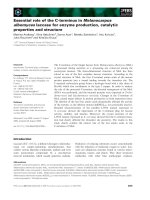
List of Tables
Table 1: GDP Data of ASEAN+3 countries 12
Table 2: Selected Macroeconomic Data of Vietnam 13
Table 3: Selected Financial Sector Data of Vietnam 15
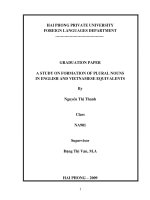
Table 4: Private Sector Share of GDP in Years from the Start of Privatization 21
Table 5: Private Sector Share of GDP in Selected Transition Countries 23
Table 6: Sector Share of GDP by Ownership in Vietnam 23
Table 7: Private Sector Share of Employment in Selected Transition Countries 23
Table 8: FDI Projects Licensed 1998-2005
1, 2
24
Table 9: Business Factor Distribution by Type of Business in 2003 (%) 25
Table 10: Comparative Chart of SOE Equitization and Capital Markets 27
Table 11: Evolution of Capital Market Regulatory Framework in Vietnam 29
Table 12: Trading Values and Their Profile on HOSTC in 2004 31
Table 13: Securities Firms - Their Capital, Licenses and Affiliations 34
Table 14: Sizes and Liquidity Levels of Bond Markets in ASEAN+3 41
Table 15: Government Securities Issue Amounts byChannels & Methods 43
Table 16: Capital Allocated to the Private Sector by Capital Markets and Bank Loans 44
List of Figures
Figure 1: Private Sector Share of GDP in Years from the Start of Privatization 21
Figure 2: Sector Share of GDP by Ownership in China-Shanghai & Vietnam 22
Figure 3: " Non-State" in GDP, Industrial Output & Banking Credit from 1994 to 2002 26
Figure 4: HOSTC Performance and Trading Volume 33
Figure 5: Cumulative Bond Issue Amounts and Monthly Trade Values 42
Figure 6: Cause-Effect Linkages and Sequences in Vietnam’s Capital Markets (1/6) 59
Figure 7: Cause-Effect Linkages and Sequences in Vietnam’s Capital Markets (2/6) 60
Figure 8: Cause-Effect Linkages and Sequences in Vietnam’s Capital Markets (3/6) 61
Figure 9: Cause-Effect Linkages and Sequences in Vietnam’s Capital Markets (4/6) 62
Figure 10: Cause-Effect Linkages and Sequences in Vietnam’s Capital Markets (5/6) 63
Figure 11: Cause-Effect Linkages and Sequences in Vietnam’s Capital Markets (6/6) 64
Figure 12: Solution Sequences in Vietnam’s Capital Markets (1/6) 65
Figure 13: Solution Sequences in Vietnam’s Capital Markets (2/6) 66
Figure 14: Solution Sequences in Vietnam’s Capital Markets (3/6) 67
Figure 15: Solution Sequences in Vietnam’s Capital Markets (4/6) 68
Figure 16: Solution Sequences in Vietnam’s Capital Markets (5/6) 69
Figure 17: Solution Sequences in Vietnam’s Capital Markets (6/6) 70
Figure 18: Four Courses of Policy Actions 71
5
Abbreviations and Acronyms
ADB Asian Development Bank
ASEAN Association of Southeast Asian Nations
CBs Convertible bonds
CDs Certificates of deposit
CLF Central Liquidity Facility
CSD Clearing, settlement and depository system
DAF Development Assistance Fund
DVP Delivery versus payment
EBRD European Bank of Reconstruction and Development
EFT Electronic funds transfer
FDDMP Financial and Domestic Debt Management Policies
FDI Foreign Direct Investment
GDC General Department of Customs
GDP Gross Domestic Product
GSO General Statistics Office of Vietnam
HASTC Hanoi Securities Trading Center
HCMC Ho Chi Minh City
HOSTC Ho Chi Minh City Securities Trading Center
IAS International Accounting Standards
IFC International Finance Corporation
IPO Initial public offering
IMF International Monetary Fund
JSC Joint stock company
LLC Limited liability company
MBO Management buy out
MEBO Management employee buy out
MOF Ministry of Finance
MOJ Ministry of Justice
MPI Ministry of Planning and Investment
MTN Medium- term note
NBFIs Non-bank financial institutions
NCDs Negotiable certificates of deposit
NPLs Non-performing loans
NSCERD National Steering Committee of Enterprise Reform and Development
ODA Official Development Assistance
OTC Over-the-counter
PVP Payment versus payment
6
RTGS Real time gross settlement
SBV State Bank of Vietnam
SOCBs State-owned commercial banks
SOEs State-owned enterprises
SCC Securities Custody Center
SCIC State Capital Investment Corporation
SSC State Security Commission of Vietnam
ST State Treasury
STC Securities Trading Center
STP Straight-through processing
TBs Treasury Bills
VND Vietnam dong
WB World Bank
WTO World Trade Organization
7
Acknowledgements
1. Based on a request by the State Securities Commission (SSC), a joint WB/SSC team led
by Mr. Tadashi Endo, Senior Financial Sector Specialist, and comprised of Dr. Nguyen Thanh
Long, International Cooperation Department of the SSC, and Mr. James Seward, Financial Sector
Specialist of the WB, has undertaken a comprehensive study to support the Government’s policy
formulation for capital market development. Mr. Thomas A. Rose, Advisor of the WBG and Mr.
Noritaka Akamatsu, Lead Financial Economist and Finance & Private Sector Coordinator for
Vietnam, were responsible for the overall management of the project.
2. It is also a result of successful collaboration with various institutions in Vietnam, including the
SSC, the Ministry of Finance (MOF) and the State Bank of Vietnam (SBV), among others. The Team
is grateful to Mr. Tran Xuan Ha, Chairman of the SSC, and Mr. Pham Phan Dzung, Director of
Banking and Financial Institutions Department of the MOF for their guidance and support. Mr.
Nguyen Doan Hung, Vice Chairman of the SSC, has provided precious feedback and support
throughout the process, and has been instrumental in the delivery of this work.
3. The generous contribution and advice of the following persons is gratefully acknowledged:
Mmes/Messrs. Nguyen Thi Lien Hoa, Director, Securities Market Development Department, (Dr.)
Nguyen The Tho, Director of Legal Department, Bui Thi Thanh Huong, Director, Securities Business
Department, Bui Nguyen Hoan, Director-Chief Representative, Representative Office in Ho Chi Minh
City, Pham Hong Son, Vice Director, Chairman’s Office, Nguyen Thi Hoang Lan, Deputy Director,
International Cooperation Department, (Dr.) Tran Dinh Quoc, Deputy Director, Center of Informatics
and Statistics, Le Hai Tra, Advisor of R&D of Markets Development Department, and their staff at the
SSC; Le Thi Ngoc Loan, Deputy Director, Capital Mobilization Department at the State Treasury;
Kieu Huu Dung, Director General, Bank and Non-bank Institutions Department, Nguyen Thi Kim
Thanh, Deputy Director, Monetary Policy Department, Nguyen Huu Nghia, Deputy Manager, Central
Banking Strategy Division, Nguyen Trong Du, Deputy Manager, Credit Institutions Strategy Division,
and their staff at the SBV; (Dr.) Tran Dac Sinh, Director, Le Chi Thu Khoa, Deputy Manager,
Administration and Personnel, Tran Anh Dao, Deputy Manager, Listing Department at the Ho Chi
Minh City Securities Trading Center; Tran Van Dzung, Managing Director at the Hanoi Securities
Trading Center; and officials in the banking, insurance, securities, industries, and practitioners in legal
and accounting services, in the Socialist Republic of Vietnam.
4. On the World Bank side, the Team is grateful to Mmes/Messrs. Khalid Mirza, Klaus Rohland,
Marylou Uy, Rodney Lester and Roberto Rocha for their support and supervision, Mmes/Messrs.
Martin Rama, Daniel Musson, Son Thanh Tran, Cally Jordan, Richard Fore, David Scott, Michel
Noel, and Stijn Claessens for their advice, Mmes/Messrs. Robert D. Strahota, a former Assistant
Director of the US Securities and Exchange Commission and a consultant of the US Agency for
International Development, Elliot Kalter, Assistant Director and Andrei Kilirenko, Economist of
International Capital Market Department, International Monetary Fund, Cally Jordan, a Senior
Counsel of the World Bank and a professor at University of Florida for their involvement in the
quality review of the work, Mr. Oliver Fratzscher, a Senior Financial Economist for his comments and
advice, Mr. Shinichi Tanaka for his research assistance, and Ms. Nguyen Thuy Ngan for her
secretarial support throughout the project.
8
Executive Summary
5. Vietnam’s domestic capital markets appear to be at a critical juncture where the country’s
continuous rapid economic growth may be constrained unless the markets are developed in parallel.
Aside from the fiscal resources (including external borrowing), bank loans have been a key domestic
source of finance for investment. As a result, Government bond issuance has been less than 10% of
GDP ($4.4 billion total during the period 2000-2005), corporate bonds and municipal bonds were just
1% of GDP ($600 million), and the formal equity market capitalization stood at about 2% of GDP at
the end of 2005. On the other hand, bank loans, while having rapidly grown, only represented about
60% of companies’ financing needs. With short-term liabilities, banks cannot meet the growing
demand for medium to long term finances without increasing term mismatch risks. This gap in the
availability of medium to long term funds needs to be filled in order for Vietnam to achieve the 8%
growth target in next five years. It also needs to be filled in a financially sustainable manner, which
requires development of the domestic capital markets. This document provides and in-depth analysis
and recommendations for further development of Vietnam’s capital markets.
6. The country has been running modest current account and budget deficits, maintaining its
external debt at a sustainable and stable level. However, the budget deficit may grow because the
Government may have to increase capital expenditure in order to support and manage its fast
economic growth. If some of the capital expenditure is delegated to the provincial and municipal
level, sub-national debt will increase instead of government debt. In either case, the domestic
government debt market will have to be enhanced substantially because the pricing of sub-
national debt will depend on the availability of reliable sovereign benchmarks. The sub-national debt
should also be captured by appropriate public debt management radar as contingent liabilities of the
Government.
7. Capital market development should facilitate the on going banking sector reforms.
Vietnam’s banking sector has expanded rapidly in recent years mostly by supplying loans to the
private sector. Four large state-owed commercial banks (SOCBs) still account for about 70% of all
credit. Institutional investors and non-bank financial intermediaries are still embryonic. Despite the
sector reform underway, the banking sector remains financially weak and requires reinforcement of its
capital base to enhance its stability and lending capacity. To do so, equity and subordinated debt
instruments will be useful. SOCBs’ public issuance of equity or subordinated debt should follow the
principles of securities regulation even if the current Vietnamese law does not specifically require it.
The banking sector may also benefit from greater competition to accelerate its current reform. Finally,
the diversification of the financial sector will become increasingly critical because underdevelopment
of the capital markets and institutional investors intensifies banking sector risk (due to over-reliance
on bank credit) and reduces prospects for improved corporate governance.
8. The equitization of SOEs needs to be more closely aligned with the policy to develop the
domestic capital markets. Only SOEs that potentially qualify for public offering and trading should
be allowed to place their shares with non-strategic, public investors including employees. It may be
worth considering legislation that grants a certain number of minority shareholders a right to audit and
force their former SOE to list its shares. More centralized decision making for the equitization may
accelerate that of high quality SOEs which qualify for listing. Line ministries’ continuous holding of
controlling shares in equitized SOEs discourages entry of private companies into industries in which
such SOEs operate. A further reduction of line ministries’ shareholdings in equitized SOEs may help
forge the public confidence in the securities market. Beyond strategic industries, it is generally
advisable to limit the State’s controlling share holding only to natural monopolies.
9. The unlisted stock market is much larger than the formal stock trading centers (STC),
indicating the potential of the market to grow. Trading in the unofficial, over-the-counter market
exceeds the official trading on Ho Chi Minh Securities Trading Center, the main trading market, by
more than three times with all bond transactions taking place over the counter. While it is encouraging
9
that an active market exists, it is advisable to entice the players in the unregulated market into a
regulated framework to enhance transparency, investor protection, and market surveillance. At the
same time, Vietnam’s broad capital market strategy should rely more on private-sector initiatives.
HOSTC and the HASTC should be reformed to be privately-owned exchanges. The introduction of a
securities registration system, an integrated securities depository system, and an individual securities
broker/dealer registration system will also help put securities intermediation outside the STCs under
control. In particular, the securities registry and depository systems should be designed to serve for
not only all listed securities but all publicly tradable ones. The broader scope of regulated market will
require enhanced financial statistics supported by appropriate information technology. IT
infrastructure development will be required also at the State Securities Commission (SSC) to put the
current unregulated market activities under regulatory supervision.
10. The nascent government securities market and the small primary market are core impediments
to Vietnam’s capital market development. Trading in the government securities market has been
modest and holdings are concentrated in commercial banks. It is advisable to review the current debt
management and debt issuance policies against World Bank/IMF guidelines and develop and
implement market development policy measures in line with the World Bank/IMF Handbook on
Developing Government Bond Markets. Those may include, among other things, enhancement of the
government cash management and monetary policy framework, reinforce the judicial system for
financial contracts with a view to adopting a standard master repurchase agreement, accelerate the
listing of state-owned commercial banks, enhance contractual savings and expedite setting up pension
schemes for the private-sector. Thus, achieving the government debt market development will require
coordinated efforts between key departments of MOF (including SSC), SBV and key market
participants.
11. Corporate governance, transparency, and the judicial system need further enhancement.
It is recommended to establish robust, efficient and equitable accounting, auditing and corporate
income tax collection systems; streamline banking supervision to keep banks’ maturity mismatch at a
modest level; review intermediaries’ license categories and criteria to alleviate the concentration of
market power of the SOCBs’ subsidiary securities firms. There is also a need to review and reinforce
the judicial system for not only public, but also private enforcement of financial contracts to protect
the interests of investors. Finally, consideration should be given to the establishment of an investor
protection fund as an incentive for investors to trade through regulated brokers.
12. Vietnam’s regulatory framework for capital markets is at an early stage of development.
The current governing regulations for the securities market is Decree 144, which narrowly defines
securities markets in the scope of institutions, activities, and products offered in the STCs. In addition,
the SSC was moved from an independent position to the Ministry of Finance, which may have
compromised the SSC’s ability to act in an independent fashion. However, the new Securities Law
that has been drafted and is scheduled for passage in 2006 aims to more broadly define the scope of
the public trading of securities as well as the SSC’s mandate to regulate it. It is also expected to
provide for the SSC’s operational independence. These are encouraging steps which should help forge
public and private sector confidence in the capital markets.
13. However, the regulatory framework of the financial industry as a whole is not well-defined
and has created room for regulatory arbitrage. Vietnam’s financial industry is already operating in a
conglomerated form, which may be inevitable to meet the mounting global competition expected
from the prospective WTO accession. However, the industry’s current regulatory framework is
based on entity regulation, whereby a regulatory agency only supervises a particular type(s) of
institutions instead of a particular type(s) of business functions. For example, the SSC regulates a
brokerage subsidiary of a bank, but not the bank itself which may also be engaged directly in
securities activities. To minimize the room for regulatory arbitrage, the regulatory framework needs
to be reformed with respect to business functions instead of type of institutions. Regulation should
also ensure provision of sound rules for prudential management, governance, transparent trade and
fair competition within and between the conglomerates. Policymakers may also be faced with the
10
choice between a unified model (unified regulatory agency) and a specialist and separatist model
(specialist agencies) in near future.
14. The Government should forge a vision for the financial sector that includes the prospective
regulatory framework more conducive to Vietnam’s economic development. To do so, policymakers
and the Government must be able to see a clear, updated and comprehensive picture of the financial
industry. It thus requires enhancement of the financial statistics and its supporting information
technology infrastructure. Capital market development requires political support as well as
orchestrated efforts across multiple branches of the Government and the private sector. A master plan
should give priority to addressing the policy and institutional problems over operational issues. It may
help for the Government to set key milestones and standard indicators for capital market development
and to measure progress.
15. The SSC must lead the Government’s efforts in taking specific policy actions to accelerate
capital market development over the next five year period. It is recommended that the 2006-2010
five-year plan of Vietnam’s capital market development include four groups of policy actions as
follows:
(i) Private-sector securities markets
Comprehensive regulatory and supervisory framework for the SSC;
Listing process for SOEs to eliminate owner-regulator conflicts;
Upgrading of the judicial system for financial transactions; and
Improved accounting, auditing and tax collection systems.
(ii) Public debt management and government securities market
Comprehensive regulatory and supervisory regime for the SSC;
Modern reserve management, consistent monetary policy framework;
Best practice debt management and debt issuance policies; and
Contractual savings development and implementation.
(iii) Master plan for a coherent financial sector structure
Analyze the current and forecast the future structure of the financial sector;
Formulate objectives for regulating the financial sector in the future; and
Design and implement a new financial regulatory structure.
(iv) Statistical capacity building and setting an information sharing regime.
Establish a standard set of market indicators;
Develop data sharing networks and safeguard protocols with market operators and
participants and across the Government; and
Build capacity for data analysis for market surveillance and policy making.
11
1 Introduction
16. At the request of the SSC, the World Bank undertook a study project on Vietnam’s capital
markets and sent a mission to Vietnam from May 15 to May 27, 2005. This report is the result of the
study project. The World Bank’s suggestions and comments have been delivered to the SSC
separately as well.
1.1 Objectives
17. The objectives of the Project were:
To review, analyze and evaluate the situation of Vietnam’s securities markets in terms of their
internal factors (regulatory framework, market infrastructure, operational capacity, etc.) as
well as their external factors (economic reform progress, private sector development, etc.) in
reference to experiences in other developing countries including transition economies ;
To work with the officials of the State Securities Commission (SSC) to make specific
recommendations for a five-year plan of Vietnamese capital market development in light of
policy implementation sequence and priorities;
To make suggestions on the draft of the Action Plan for Securities Market Development for
the period of 2006-2010; and to comment on the Prime Minister’s Decision No 163 on the
Strategy for the Development of Vietnam’s Securities Market up to year 2010; and,
To identify desirable capital market-related projects and programs to be administered by the
Bank in line with Vietnam’s overall economic development strategy.
1.2 Methodology
18. This study project was carried out according to the following methods:
Desk research using (i) reports and data on Vietnam compiled by the World Bank and the
IMF; (ii) laws, regulations and rules on banking and capital markets provided by the SSC,
and other Vietnamese authorities; (iii) reports provided by the SSC, and other Vietnamese
authorities; and (iv) annual reports, prospectuses, and other reports provided by
intermediaries, issuers, investors, accountants and lawyers in Vietnam;
Interviews and electronic inquiries with about one hundred officials (i) of the SSC, and other
Vietnamese authorities; and (ii) intermediaries, issuers, investors, accountants and lawyers in
Vietnam in May 2005; and,
Discussions with and reviews by officials of the World Bank and the IMF who were well
versed in the subjects and/or the region.
1.3 The Structure of the Report
19. This report is organized as follows: Sections 2 and 3 will overview Vietnam’s
macroeconomic situation and the financial markets in Vietnam, respectively. Section 4 will examine
SOE equitization, foreign direct investments, and private sector development, which have been
considerably influencing capital market development process in the country. Section 5 will review the
operation of Vietnam’s capital markets in terms of their regulatory framework and activities,
examining key issues to find ways to enhance the robustness and efficiency of the markets. Section 6
will explore two principal impediments to Vietnam’s capital market development, namely its nascent
government securities market and its inactive primary market. Section 7 will discuss the policy and
institutional problems that have been adversely affecting the whole financial sector in Vietnam.
Finally, Section 8 will recommend policy actions to be implemented under the five-year plan of
Vietnamese capital market development.
12
2 Macroeconomic Overview
20. This section will overview Vietnam’s macroeconomic situation and relate their issues to the
financial markets.
2.1 Current Situation and Discussion
21. Vietnam’s economy growth has been robust, although it is still catching up to its fast
growing neighbors. In 2004, Vietnam achieved a growth of 7.7 percent, which was the second
highest growth rate among ASEAN+3 countries from 2000 to 2004, though its GDP per capital
registered at US$ 482 in the tenth place in 2003. (Table 1) The industry and construction sectors,
which comprised about 40 percent of GDP, have maintained the annual growth of approximately ten
percent since 2000 and pulled the Vietnamese economy. During the same period, the annual growth
rate of the services sector, which also comprised about 40 percent of GDP, has increased from 5.3
percent to 7.5 percent, while growth in the agricultural sector has remained relatively low between 2.8
percent and 4.6 percent. These data indicate that Vietnam has been industrializing its economy
22. Vietnam’s effort to join the World Trade Organization (WTO) has successfully increased its
international trade and foreign investment. Encouraged by China, Vietnam has gradually liberalized
international trade through deregulations that resulted from negotiations in view of the WTO
accession. Tariff reductions have contributed to the expansion of imports. Export has also increased
by price hike of some commodities and quota-free trade gained through negotiations noted above.
High foreign direct investment (FDI) commitments were observed in 2004, which reached US$ 4.2
billion, as well as in the first four months of 2005, which amounted to US$ 2.1 billion. (Table 2)
Thus, Vietnamese economy has been increasingly integrated to the world economy
Table 1: GDP Data of ASEAN+3 countries
2000 2001 2002 2003
GDP
(
current
US$
m
illi
on
)
n.a. n.a. n.a. n.a.
GDP
per cap
i
ta
n.a. n.a. n.a. n.a.
GDP
growt
h
(
annua
l
%)
n.a. n.a. n.a. n.a.
GDP
(
current
US$
m
illi
on
)
3
,
583 3
,
706 4
,
000 4
,
228
GDP
per cap
i
ta
282 287 304 315
GDP
growt
h
(
annua
l
%)
7.0 5.7 5.5 5.2
GDP
(
current
US$
m
illi
on
)
1
,
080
,
741 1
,
175
,
716 1
,
271
,
000 1
,
417
,
000
GDP
per cap
i
ta
856 924 993 1
,
100
GDP
growt
h
(
annua
l
%)
8.0 7.5 8.3 9.3
GDP
(
current
US$
m
illi
on
)
150
,
196 143
,
034 172
,
971 208
,
312
GDP
per cap
i
ta
728 684 817 970
GDP
growt
h
(
annua
l
%)
4.9 3.5 3.7 4.1
GDP
(
current
US$
m
illi
on
)
4
,
746
,
068 4
,
162
,
363 3
,
972
,
485 4
,
300
,
858
GDP
per cap
i
ta
37
,
409 32
,
738 31
,
181 33
,
713
GDP
growt
h
(
annua
l
%)
2.8 0.4 -0.4 2.7
GDP
(
current
US$
m
illi
on
)
511
,
928 481
,
969 546
,
713 605
,
331
GDP
per cap
i
ta
10
,
890 10
,
180 11
,
476 12
,
634
GDP
growt
h
(
annua
l
%)
8.5 3.8 7.0 3.1
GDP
(
current
US$
m
illi
on
)
1
,
711 1
,
750 1
,
719 2
,
122
GDP
per cap
i
ta
324 324 311 375
GDP
growt
h
(
annua
l
%)
5.8 5.7 5.0 5.0
GDP
(
current
US$
m
illi
on
)
90
,
320 88
,
001 95
,
164 103
,
737
GDP
per cap
i
ta
3
,
881 3
,
697 3
,
915 4
,
187
GDP
growt
h
(
annua
l
%)
8.9 0.3 4.2 5.3
GDP
(
current
US$
m
illi
on
)
n.a. n.a. n.a. n.a.
GDP
per cap
i
ta
n.a. n.a. n.a. n.a.
GDP
growt
h
(
annua
l
%)
n.a. n.a. n.a. n.a.
GDP
(
current
US$
m
illi
on
)
75
,
913 72
,
043 77
,
954 80
,
574
GDP
per cap
i
ta
991 920 975 989
GDP
growt
h
(
annua
l
%)
6.0 3.0 4.4 4.5
GDP
(
current
US$
m
illi
on
)
91
,
476 84
,
871 88
,
275 91
,
342
GDP
per cap
i
ta
22
,
767 20
,
545 21
,
200 21
,
492
GDP
growt
h
(
annua
l
%)
9.4 -2.4 3.3 1.1
GDP
(
current
US$
m
illi
on
)
122
,
725 115
,
536 126
,
770 142
,
953
GDP
per cap
i
ta
2
,
021 1
,
888 2
,
058 2
,
305
GDP
growt
h
(
annua
l
%)
4.8 2.2 5.3 6.9
GDP
(
current
US$
m
illi
on
)
31
,
173 32
,
685 35
,
058 39
,
164
GDP
per cap
i
ta
397 411 436 482
GDP
growt
h
(
annua
l
%)
6.8 6.9 7.0 7.2
Source: World Bank
Burnei
Cambodia
China
Indonesia
Japan
Korea, Rep.
Lao PDR
Thailand
Vietnam
Malaysia
Myanmar
Philippines
Singapore
13
23. The country has been running modest current account and budget deficits, maintaining its
external debt at a sustainable level. Its current account has been in deficit since 2002 due to rapid
import growth. In 2004, the deficit moderately declined to around 4.0 percent of GDP as net exports
grew, partly due to the increased export prices for crude oil and rice. The current account deficit has
been financed mainly by official development assistance (ODA) and FDI inflows in capital account.
Similarly, the fiscal balance, which had been long in deficit in a range of 4 to 5 percent of GDP,
slightly improved in 2004 (Table 2) by controlling current expenditure.
24. A more explicit regulatory framework, a more robust market infrastructure and the availability
of more instruments would help the State Bank of Vietnam (SBV) to effectively rein in growing
inflationary pressures. Credit growth of 28.4 percent and 41.6 percent in 2003 and 2004, respectively,
appear to be inconsistent with objectives for low inflation. In addition, price increases for imported
products and foods, caused respectively by the price appreciation of petroleum products and by the
shock to farmers of the avian flu and the drought, imposed inflationary pressures on the economy. It
seems that the SBV’s ability to manage monetary policy has been considerably constrained by the
state-owned commercial banks’ (SOCBs’) conventional operations that are often influenced by non-
commercial objectives. The lack of independence has also restrained the central bank from more
effective monetary management.
25. Vietnam needs to improve the efficiency of the financial sector by intensifying structural
reform efforts. In order to satisfy the increasing demand for capital in both the public and private
sectors to support a high economic growth, financial resources need to be not only expanded but also
allocated more efficiently. The WTO accession will expose Vietnamese economic actors to a highly
competitive world. An improved financial sector will encourage investors to invest more in
Vietnamese industries. The attendant reduction of financial costs and robustness of financial systems
will make Vietnamese industries resilient to the international competition and shocks.
2.2 Conclusion and Recommendations
26. The Vietnamese economy has been one of the best performers among the ASEAN
countries. Its accession to the WTO is expected in 2006. A better FDI environment, an efficient
Table 2: Selected Macroeconomic Data of Vietnam
2000 2001 2002 2003 2004 2005
Q1
Total GDP (percentage change) 6.8 6.8 7.0 7.2 7.7 7.2
Agriculture (percentage change) 4.6 2.8 4.1 3.2 3.5 4.1
Industry & Construction (percentage change) 10.1 10.3 9.4 10.3 10.2 8.5
Services (percentage change) 5.3 6.1 6.5 6.6 7.5 7.0
Export Value Growth (percentage change) 25.2 4.0 11.2 20.8 31.4 -
Import Value Growth (percentage change) 34.5 2.3 22.1 27.8 26.7 -
FDI Commitments (USD billion) 2.7 3.2 3.0 3.1 4.2 2.1
FDI Disbursement (USD billion) 2.4 2.5 2.6 2.7 2.9 -
Saving-Investment Balance 2.1 2.1 -1.2 -4.7 -4.0 -
Gross National Saving 31.7 33.2 32.0 30.4 - -
Gross Investment 29.6 31.2 33.2 35.1 - -
ICOR
2
4.1 4.2 4.4 4.5 - -
Current Account Balance (percent of GDP) 2.1 2.1 -1.2 -4.7 -4.0 -
Trade Balance (percent of GDP) 1.2 1.9 -2.5 -6.4 -5.0 -
Total Revenue and Grants (percent of GDP) 20.5 21.6 22.2 23.4 23.4 -
Total Expenditure and Net Lending (percent of GDP) 25.5 26.6 26.8 28.4 26.7 -
Fiscal Balance (percent of GDP) -5.0 -5.0 -4.5 -5.0 -3.3 -
Credit to the Economy (percentage change) - 21.5 22.2 28.4 41.6 -
Source: GSO, GDC, MPI, IMF and World Bank
1
The first four months of 2005
2
Incremental Capital-Output Ratio
14
Government debt issuance system, and a clear monetary policy appear critical for managing the rapid
economic growth with inflationary pressures under control.
27. The Government is recommended to:
Organize its debt issuance program as much in line with international standards for public
debt management as possible; and,
Clearly establish a monetary management framework.
15
3 Financial Market Overview
28. This section will overview the financial markets in Vietnam, relating their issues to the capital
markets.
3.1 Current Situation and Discussion
29. Vietnam’s financial sector has expanded rapidly in the recent years, mostly
supplying banking loans to the private sector. In the banking sector, the credit to the economy
rose from VND 156 trillion in 2000 (35 percent of GDP) to VND 420 trillion in 2004 (59 percent
of GDP). The ratio of bank deposits to GDP stands at 57 percent. In the securities market, which
includes stock, bond and investment funds, total listing value was VND 27.0 trillion in 2004 (4.0
percent of GDP), while it was just VND 1.5 trillion in 2000 (0.3 percent of GDP). The insurance
market has also been growing; the penetration rate became 2.0 percent of GDP in 2004 from 0.4
percent in 1993, although it is still relatively low.
30. Commercial banks, especially SOCBs, dominate Vietnam’s financial sector, deterring market-
Table 3: Selected Financial Sector Data of Vietnam
2000 2001 2002 2003 2004 2005*
Banking
Credit to the Economy (VND tril.) 156 189 231 297 420
Credit to the Economy (Growth
rate) 21% 22% 28% 42%
Credit to the Economy (% of GDP) 35% 41% 44% 50% 59%
Claims on SOEs (% of total credit) 45% 42% 39% 36% 34%
Claims on SOEs (% of GDP) 16% 17% 17% 18% 20%
Securities
Stocks
Listed companies (companies) 5 11 20 22 26 30
Market Cap (VND tril.) n.a. n.a. n.a. 2.3 3.8 5.9
Market Cap (% of GDP) n.a. n.a. n.a. 0.4% 0.5% 0.5%
Bonds
Listed bonds (issues) 4 18 41 103 207 281
Listing value (par value) (VND
tril.) 1.2 2.9 4.3 11.9 23.9 33.7
Listing value (% of GDP.) 0.3% 0.6% 0.8% 2.0% 3.4%
Investment Fund
Listed fund (funds) 0 0 0 0 1 1
Listing value (par value) (VND
tril.) 0 0 0 0 0.3 0.3
Listing value (% of GDP.) 0.0% 0.0% 0.0% 0.0% 0.1%
Insurance
Revenues from premium (VND Tril.) n.a. n.a. 7.0 10.4 12.4
Revenues from premium (% of GDP) n.a. n.a. 1.30% 1.72% 1.73%
Non-life insurance (% of GDP) n.a. n.a. 0.49% 0.63% 0.66%
Life insurance (% of GDP) n.a. n.a. 0.82% 1.09% 1.07%
Revenues from investment (% of
GDP) n.a. n.a. 0.16% 0.16% 0.26%
Total assets (VND tril.) n.a. n.a. 12.5 18.3 26.7
Total assets (% of GDP) n.a. n.a. 1.6% 2.2% 2.6%
Source: HOSTC, MOF, IMF and World Bank
* As of October 21, 2005. GDP for 2005 is an IMF projection
16
based credit allocation as well as equity base reinforcement of Vietnamese industries. Historically,
Vietnam’s financial system depended heavily on the SBV and two SOCBs, which provided almost all
financial services in the country. In 1988, two years after the introduction of Doi moi, the
Government established additional SOCBs so that the SBV could specialize in the monetary policy
and financial supervision as the central bank. While allowing the private sector to set up joint-stock
commercial banks in 1991 and foreign banks to open local branches in 1992, the Development
Assistance Fund (DAF), which was intended solely for policy finance, was added to the state-owned
financial facilities in 2000. The SOCBs currently account for nearly three-quarters of total bank credit
in Vietnam. They are still engaging in non-commercial or politically-preferred lending, especially in
rural areas.
1
Market capitalization of all listed stocks is merely VND 3.8 trillion as of the end of 2004,
as compared to VND 420 trillion in overall credit to the economy.
31. Vietnam has been actively developing the insurance industry. The new Insurance Law,
enacted in April 2001, allowed foreign joint venture insurance companies and wholly foreign owned
subsidiary branches to operate in Vietnam. As a result, there were two state-owned companies, 11
joint stock companies, and 15 foreign subsidiaries operating in the country’s insurance sector as of
mid-May 2005.
2
In addition, two out of four state-owned insurance companies have been converted to
equitized companies. Vietnam’s insurance penetration rate stood at 1.72 percent and 1.73 percent in
2003 and 2004. In Vietnam, unlike most other developing countries, life insurance market is larger
share than non-life one. (Table 3) The life/non-life ratio is likely to reverse as motorization intensifies
in the country. The Government set a goal of the insurance penetration rate at 4.2 percent – VND31
trillion (US$2 billion) for life insurance and VND9 trillion (US$562 million) for non-life insurance –
by 2010.
3
4,
However, the government’s goal of insurance industry development is overshadowed by
the creeping inflation.
5
Penetration rate growth almost stopped in 2004. (Table 3) In addition, the
regulatory and supervisory framework for the industry is fledging. Finally, capital market
development has been slow, which limits the availability of high-quality assets and risk management
instruments.
32. Other institutional investors and non-bank financial intermediaries are still embryonic.
In contrast to the insurance industry, the pension fund industry lags behind with one state-managed
pension fund (the State Social Insurance Fund) for public servants but no pension funds for private
sector workers. The absence of pension funds for private sector workers presumably may be
interfering with the development of not only the capital markets but also the private sector by
discouraging workers’ migration from the public sector to the private sector. There is only one
investment fund listed on the Ho Chi Minh City Securities Trading Center (HOSTC). Regarding the
leasing business, there were nine companies at the end of 2004; some of them were subsidiaries of
SOCBs and others were joint companies with foreign capitals.
33. Despite various sector reforms underway,
6
the banking sector remains financially weak and
may benefit from more competition to accelerate its current reform agenda. NPLs of SOCBs were
estimated at approximately 15 percent of total credit as of May 2005, which was about eight percent of
GDP.
7
Assessments based on International Accounting Standards (IAS) audits suggest that the overall
1 World Bank (2005), Taking Stock – An Update on Vietnam’s Economic Developments and Reforms.
2
3 The Prime Minister’s Decision No. 175/2003/QD-TTg
4 The Ministry of Finance of Vietnam, 2005, Vietnam’s insurance market in 2004, and
5 Inflation would generally depress the public’s demand for insurance policies.
6 World Bank (2005), Taking Stock – An Update on Vietnam’s Economic Developments and Reforms. The
reforms include the improvement of payments system, the development of accounting rules aligned with
International Accounting Standards, enhancement of procedures for the collection and sharing of credit
information, an establishment of legal framework for modern financial products and services, and the
implementation of risk-based prudential supervision of banks.
7 World Bank (2005), ibid.
17
quality of the SOCBs portfolio is not improving. On the contrary, according to the judgment of
external auditors analyzing the limited information, the SOCBs have already suffered from capital
shortfall.
8
Despite improvements in some individual financial issues, it seems that Vietnam has yet to
address problems fundamental to the financial sector. In addition to potentially positive effects of
competition from foreign banks, the capital market will also possibly help SOCBs lessen NPLs by
providing indebted companies and SOCBs with additional equity cushion and/or second-tier capital.
34. The banking sector reform has been inadvertently creating a funding gap in the
medium- and long-term segments. In order to rein in the recent sharp credit growth as well as
maturity mismatch, the SBV issued an ordinance to commercial banks in April 2005 to limit medium-
and long-term lending to 40 percent of their short-term funds.
9
On the other hand, the capital markets,
which are aimed at supplying the economy with medium- and long-term risk capital, remain
underdeveloped. A total of 30 companies with market capitalization of $371 million
10
are listed on the
HOSTC five years after its inception. In addition, the government debt market and especially the
corporate bond market are still in an early development stage. Consequently, the banking reform
underway leaves a funding gap in the medium- and long-term segments.
35. The reinforcement of shareholders’ equity capital is also vital to a successful banking sector
reform as equity capital enhances the stability of the banking system as well as banks’ lending
capacities. SOCBs have been plagued with capital shortfalls. The high-growth economy has been
causing banks to expand their loan portfolios. Meanwhile banks’ credit analyses are said not to be
scrupulous enough under a lasting effect of non-commercial based lending.
11
For example, by
allowing the Government, the People’s Committees and other authorities to intervene in bank
management and operations,
12
the SBV laws and the Credit Institutions Law leave room for potential
non-commercial based lending. Given this incomplete state of the reform, the capital markets may
help commercial banks streamline their operations and provide indebted companies and SOCBs with
additional equity and/or second-tier capital.
3.2 Conclusion and Recommendations
36. Though Vietnam’s financial sector has been expanding rapidly, the delayed SOCB
reform is a bottleneck. An unintended financing gap for medium- and long-term debt appears
widening. Strengthening of the equity base of borrowers as well as lenders could complement reforms
in the banking sector.
37. The Government is recommended to:
Accelerate and deepen the banking sector reform; and,
Continue to develop well-functioning capital markets – both equity and debt markets – to
facilitate the banking sector reform.
8 IMF (2004), Vietnam: Selected Issues
9 World Bank (2005), ibid.
10 As of October 21, 2005.
11 World Bank (2005), ibid.
12 Articles 6 to 8 of the Law on the State Bank and Article 116 of the Law on Credit Institutions
18
4 Capital Market Environment
38. This section will examine the equitization of state-owned enterprises (SOEs), foreign direct
investments, and private sector development, which have been considerably influencing capital market
development process in the country.
4.1 SOE equitization
4.1.1 Suggested improvements of equitization
39. Some improvement of the current equitization process and requirements would help
materialize economic and capital market development effectively. Equitization is the very first step
for economic development in general and for capital market development in particular in Vietnam. Of
30 joint stock companies listed on the HOSTC as of October 21, 2005, 29 were former SOEs. Of
more than 2,000 equitized SOEs, approximately 400 companies are said to qualify for listing. The
equitization framework prescribed in the three decrees stop short of accelerating the equitization and
subsequent listing of well-performing SOEs.
40. A more centralized decision making mechanism may accelerate the equitization of
potentially listing-qualified SOEs. The decentralized nature of the current equitization framework is
likely to delay the equitization of SOEs by allowing decisions on equitization to be inconsistent.
Professional skills are vital to warrant the quality of an SOE-converted joint stock company and to
prevent unnecessary delay in equitization and listing. In centralized evaluation, it may be desirable for
the centralized decision making body to consult the line ministry and the people’s committee
concerned so as to reasonably adjust the equitization plan to the factors specific to the SOE. Under the
current arrangement, however, the evaluation is left solely to the line ministry and the people’s
committee that regulates and supervises the SOE. Not every line ministry and people’s committee
may have evaluation skills sufficiently. Some line ministries and people’s committees may try best to
defend their interests vested in the SOE. The decision makers with vested interests may see benefits in
delaying equitization and listing.
41. Only SOEs that qualify for and commit to listing or public offering should be allowed to place
their shares with minority shareholders such as employees, and non-strategic investors. Many SOEs
that are large and financially attractive to the investing public are likely to fall under this category.
The current equitization regulations do not require every SOE that chooses to sell its shares to
employees, and/or non-strategic investors to list its shares on a stock trading center. In most
jurisdictions
13
, when a privatization takes place, investors are entitled to know before subscribing
whether there will be a trading market for their shares and what information will be available
subsequently.
14
With the current weaknesses in the legal and regulatory framework for publicly traded
securities and companies, mandatory listing of equitized SOEs eligible for listing may be considered.
Listing will enhance the transparency of an equitized SOE’s operations and the accountability of its
management as well as the liquidity of its shares. It should also make “closed” transactions involving
no outsiders difficult.
15
Those equitized SOEs that are not ready for listing should not be allowed to
sell their shares to their employees and non-strategic investors.
16
The absence of the mandatory listing
requirement for listing-eligible equitized SOEs may be partly responsible for the burgeoning
13 with an exception of some former socialist countries which adopted a mass privatization program.
14 Some minority shareholders, who are not familiar with securities markets, may not understand well the
economic implication of listing or unlisting of the shares that are offered to them.
15 On average, employees have bought about 55 percent of the shares. P. 19, the World Bank, June 2-3,
2005, Taking Stock – An Update on Vietnam’s Economic Developments and Reforms.
16 The flip side of this qualified mandatory listing requirement will be that it may implicitly encourage a
whole equitized SOE to be sold to strategic investors. This is not necessarily a bad policy for job creation and
economic development as long as the fairness of an SOE sale transaction is assured and is balanced with a set of
counter-balancing policy measures. The counter-balancing policy measure includes certain restrictions of the
sale of the strategic investors’ holdings and tax holidays for listed companies.
19
unregulated market of shares. If the prospective Securities Law adequately addresses the issue of
public offering of securities and publicly held companies, the idea of mandatory listing may be
revisited, however.
42. A legislation that grants a certain number of outsider minority shareholders a right to audit and
force their former SOE to list its shares is also likely to strengthen minority shareholders’ rights.
Approximately 400 former SOEs that qualify for listing under the current listing criteria have are
hesitant to list their shares. This means that for each of such SOEs, at least 50 minority outside
shareholders holding at least 20 percent of the stake
17
are deprived of an opportunity to realize market
value of their shares while insiders of the company may be enjoying superfluous benefits from inside
dealings. The strengthening of minority shareholder rights tends to increase outsider investor
enthusiasm resulting in more share sales to outsiders and higher equitization proceeds. Equity sold to
outsiders accounted for no more than nine percent in 2004.
18
It means that many of the 400 hundred
companies are considered to have at least several hundred shareholders.
43. Liquidating or substantially cutting back on line-ministries’ holdings in equitized SOEs may
help forge the public’s confidence in the securities markets, eliminating owner-regulator conflict of
line-ministries.
19
Of 30 former SOE companies listed on the HOSTC, 27 companies were still owned
by the State. The State holdings in the 27 companies averaged 21.7 percent as of the end of June
2006. Of approximately 1,500 SOEs that were equitized (transformed into joint stock companies) as
of December 2004, 909 companies
20
or 60 percent were 35 percent or more owned by the State. Most
line-ministries holding substantial shares of equitized SOEs are the regulators of the industries in
which the equitized SOEs do business. In an owner-regulator conflict situation, the investing public is
not sure if the management of a company with a serious owner-regulator conflict is pursuing the best
possible interest or the maximum possible profit for minority shareholders of the company.
Otherwise, an owner-regulator conflict in an equitized SOE discourages other companies from
entering the same market or industry that the equitized SOE is doing business, interfering with private
sector development.
44. The manner in which SOE’s assets and liabilities are separated from the State should be made
more transparent. The transparency will help make the evaluation of an equitized SOE easier and
create a well-informed demand for shares auctioned by an SOE, enhancing the confidence in the
country’s stock market. The current equitization appears ambiguous in separating an SOE’s assets and
liabilities from the State. For example, the State’s proceeds from the sale of its stake may be partly
used for compensating retrenched workers and may be “used” for the partly sold SOE’s operations.
(Article 35-1 of Decree 187 on transformation of SOEs into joint stock companies)
45. More generally, it will be effective to develop a competitive private sector if the Government
focuses its control only on a small number of carefully selected sectors and enterprises. Currently, the
Government instead retains the majority or substantial shares of most SOE-converted joint stock
companies that are listed or are qualified for listing. Government intervention in those companies can
undermine the competition in the sectors in which the companies operate. In addition to owner-
regulator conflicts, a protective environment for government-controlled companies undercuts the
efficiency of their operations and, consequently, their sectors.
17 A listing requirement of the HOSTC
18 P. 19, the World Bank, ibid.
19 Natural monopolies as well as strategic industries are exceptions to this. Such SOEs may need to be
controlled by the State or provincial government into a foreseeable future.
20 cf data in Projection on Monitoring of SOE New Establishments and Transformation , NSCERD
20
46. The scope of “state capital” that the State Capital Investment Corporation (SCIC)
21
will
manage should be carefully limited so that the Government may not be seen as interfering with the
market through the SCIC. The SCIC may or may not be a solution for capital market-related issues
arising from SOEs, depending mainly on the scope of “state capital.” The SCIC may help rationalize
and accelerate the liquidating process of state ownership in equitized SOEs by functioning as a
professional and centralized decision making mechanism. It may also alleviate an owner-regulator
conflict by transferring the State ownership rights in equitized SOEs from line-ministries or other
public offices to the SCIC. However, if it operates to retain state control over many sectors and/or the
securities markets, the SCIC will hinder or at best substantially deter developing the private sector as
well as forging the public’s and confidence in the securities markets.
4.1.2 Lessons from European transition countries and China
22
47. In European transition economies, the quality of listed companies and the market were key
determinants of the development of their capital markets. The quality of listed companies is
represented by the companies’ profitability, growth, size, governance, disclosure, etc., while the
quality of the market is reflected by market regulation and supervision, trading and settlement
efficiency, professional, competitive and ethical intermediation, etc. None of the privatization
approaches European transition economies took could develop its capital markets in the short term.
23
Direct sales of state assets did not have any influence on capital markets, at least initially. On the
other hand, mass privatization tended to put aside the standard requirements for due diligence,
disclosure and listing and destroyed the confidence in the capital markets. The assumption that more
companies listed regardless of their quality would create more liquidity has empirically been shown to
be incorrect
48. Another common factor among European transition countries now enjoying high or steady
economic growth is that they employed the privatization of SOEs as one of multiple policy
measures for private sector development. As such, private sector’s share of GDP increased
sharply in European countries during the first several years of transition. For instance, the share
of the private sector in Hungary increased from 30 percent in 1991 to 80 percent in 2003. (Table
5) By contrast, the state sector’s share in Vietnam has remained approximately 40 percent of
GDP at least from 1995 to 2002. (Table 6) The private sector’s share in Czech Republic’s total
employment went up from 20 percent in 1990 to 65 percent in 1994 (Table 7), while in Vietnam
56.2 percent are employed in non-state sector in 2003. (Table 9 in p.25) The four European
countries, Czech Republic, Hungary, Poland, and Russia, instituted private pension funds for the
social security of workers in the private sector, though Vietnam has yet to introduce a pension
fund system for the private sector workers
21 The Prime Minister’s Decision of June 20, 2005 (Decision No. 151/2005/QD-TTg) established the SCIC
and the underlying rationale behind the creation of the SCIC was to reform the State Owned Enterprises (SOE)
sector primarily through the consolidation of the shareholding in most SOEs into one institution. The SCIC will
start with a charter capital base of about VND 5 trillion (US$316.5 million). The Government is said to have
modeled the SCIC after Temasek Holdings of Singapore, which is the Singaporean Government’s investment
management company.
22 This section heavily relied on various literatures on the subject published by the World Bank and other
institutions as well as input from World Bank’s staff working for East European countries and China.
23 Fungacova (2005), Building a castle on sand: Effects of Mass Privatization on capital market creation in
transition economies.
21
49. At the start of privatization, the Vietnamese and Chinese economies were much less state-
owned and industrialized than the European transition economies used to be, privatizing SOEs to
much less a degree than the European counterparts did.
24
In Vietnam and China, non-stated owned
sectors remained around 60 percent and in the range of 50 to 60 percent of GDP, respectively, since
privatization had started; and hence the state-owned sector hardly shrank in Vietnam, and slightly
expanded in China (Table 4 and Figure 1). Instead, foreign-owned enterprises increased in the share
of GDP at the expense of collectives during the privatization period (Figure 2). By contrast,
privatization programs in the European transition countries drastically transferred ownership from the
state to the private sector.
24 The sector share of GDP by ownership in China is not available. Instead, the sector share of GDP by
ownership in Shanghai available at is used here as
its proxy. However, the sector share of GDP by ownership at the national level might significantly differ from
that in Shanghai.
Table 4: Private Sector Share of GDP in Years from the Start of Privatization
(percent)
Years from the Start of Privatization (up to 2003)
Privatiza
-tion
started
Stock
exchang
e est’d
or re-
est’d
Yr
1
Y
2
Yr
3
Yr
4
Yr
5
Yr
6
Yr
7
Yr
8
Yr
9
Yr
10
Yr
11
Yr
12
Yr
13
Yr
14
Czech 1992 1993 30 45 65 70 75 75 75 80 80 80 80 80 - -
Hungary 1990 1990 25 30 40 50 55 60 70 75 80 80 80 80 80 80
Poland 1990 1991 30 40 45 50 55 60 60 65 65 65 70 75 75 75
Russia 1992 1995 25 40 50 55 60 70 70 70 70 70 70 70 - -
China-
Shanghai
1990 1990 n.a. n.a. n.a. n.a. n.a. n.a. 60 57 57 56 55 56 54 52
Vietnam 1997 2000 60 60 61 61 62 62 61 - - - - - - -
Source: EBRD, GSO, and World Bank staff's analysis
Figure 1: Private Sector Share of GDP in Years from the Start of Privatization
0
10
20
30
40
50
60
70
80
90
1234567891011121314
Years from the Start of Privatization (up to 2003)
Share of Private Sector (% of GDP)
Czech (92) Hungary (90) Poland (90)
Russia (92) Vietnam (97) China-Shanghai (90)
Source: EBRD, GSO, and World Bank staff's analysis
22
50. Vietnam’s GDP may have been less dependent on SOEs and collectives, its privatization may
have been slower, and its collectives may have shrunk more modestly, as compared to China. (Figure
1) The state-owned sector’s share of GDP in Vietnam marginally declined from 40.2 percent in 1995
to 38.4 percent in 2002, while that in China decreased from 59.7 percent in 1995 to 51.6 percent in
2002. Collectives’ share of GDP in Vietnam fell from 10.1 percent in 1995 to 8.0 percent in 2002,
whereas collectives’ share of GDP in China dropped 23.2 percent in 1995 to 16.5 percent in 2002.
(Figure 1) In China, a noticeable growth of foreign ownership made up for a decline in collectives’
share. European transition countries and China have more active capital markets than Vietnam in
terms of stock turnover over GDP (Table 10), but the forces behind their active capital markets seem
different.
25
In European transition countries, privatization helped rejuvenate the economy dominated
by inefficient industrial SOEs, ultimately leading to brisk market activity. In China, the “quota
system” – an administrative incentive system under which a better performing region was given a
larger IPO quota –
26
played a key role in jump-starting the market. Chinese SOEs have not been
privatized to the same extent as SOEs in the European transition countries.
51. It is not clear whether China’s stock market policy based on SOE corporatization – i.e. listed
companies are kept majority-owned by the state while only about 35 percent of the total shares of a
company are tradable – has been successful in reforming SOEs.
27
China’s stock trading started with
listing of eight SOEs on the Shanghai Stock Exchange in 1990. SOE privatization was stepped up in
mid-1990s. The quota system was applied to SOEs’ IPOs and listing. In contrast to marginal capital
raising in the Eastern European markets, consequently, the Chinese market supplied as much as RMB
508 billion (US$ 62 billion) through 414 IPOs from 1998 to 2001.
28
However, the selection of
companies for listing was not necessarily based on economic merits (e.g. profitability and profit), but
25 The comparison of component changes in the whole Vietnam’s GDP with the metropolitan Shanghai’s
GDP has to be cautiously made.
26 Each year from 1993 to 2000, the People’s Bank of China established the amount of shares firms were
allowed to issue to the public. Within the quantity constraint thus established, the China Securities Regulatory
Commission (CSRC) allocated quotas to different provinces and ministries on the basis of the size of the quota
that each provincial government and the respective provincial branch of the CSRC had agreed upon through
negotiation for their province. (Pistor, Katharina, and Chenggang Xu, 2004, “Governing Stock Markets in
Transition Economics: Lessons from China,” Working Paper No. 262, Columbia Law School, Columbia
University)
27 Wang, Xiaozu, et al., 2004, “State-owned enterprises going public: The case of China,” Economics of
Transmission, Vol. 12 (3), 467-487, EBRD
28 Pistor, Katharina, and Chenggang Xu, 2004
Figure 2: Sector Share of GDP by Ownership in China-Shanghai & Vietnam
China-Shanghai
State
Collective
Non-public
0%
20%
40%
60%
80%
100%
1995 1996 1997 1998 1999 2000 2001 2002
Vie t n a m
State
Collective
Non-public
0%
20%
40%
60%
80%
100%
1995 1996 1997 1998 1999 2000 2001 2002
r
ce: GSO, Shanghai Statistical Bureau, and World Bank staff's analysis
23
was found significantly influenced by political factors. Reckless lending also pyramided stock
prices,
29
driving many IPOs. Sharp market corrections and substantial capital losses were inevitable.
52. The consolidation and industrialization of the private sector appears essential for Vietnam’s
private sector development, and the capital market is likely to need to adapt for facilitating such
process. Listing of high-quality equitized SOEs will drive private sector development. From the
analysis above, however, it is reasonable to assume that Vietnam has a smaller number of high-quality
SOEs than the European transition countries did. Furthermore, about a half of the country’s private
sector output is attributable to household businesses (Table 6), presumably for lack of skills, materials,
capital, technology, and/or regulatory framework necessary for large-scale operations. There could be
a lot of promising candidates in the household sector that may develop into high-quality listed
companies if the government sets policies to facilitate the consolidation of such household ventures.
Therefore, SOE equitization alone cannot address low productivity arising from small-scale private
sector businesses. Thus, the capital market may also meet the need of small-scale private enterprises
by tuning its regulations and market infrastructure partly for financing institutions such as leasing
companies, venture capital funds, micro-finance companies that directly serve small- and medium-size
enterprises.
29 Cooper, Mary Comerford, 2003, “The Politics of China’s Shareholding System,” Stanford University
Table 5: Private Sector Share of GDP in Selected Transition Countries
(percent)
1990 1991 1992 1993 1994 1995 1996 1997 1998 1999 2000 2001 2002 2003
Czech 10 15 30 45 65 70 75 75 75 80 80 80 80 80
Hungary 25 30 40 50 55 60 70 75 80 80 80 80 80 80
Poland 30 40 45 50 55 60 60 65 65 65 70 75 75 75
Russia 5 5 25 40 50 55 60 70 70 70 70 70 70 70
Source: EBRD
Table 6: Sector Share of GDP by Ownership in Vietnam
(percent)
1995 1996 1997 1998 1999 2000 2001 2002 2003*
State 40 40 40 40 39 39 38 38 39
Non-state 60 60 60 60 61 61 62 62 61
Collective 10 10 9 9 9 9 8 8 7
Private 7 7 7 7 7 7 8 8 8
Household 36 35 34 34 33 32 32 32 31
Foreign investment sector 6 7 9 10 12 13 14 14 14
Source: GSO * preliminary
Table 7: Private Sector Share of Employment in Selected Transition Countries
(percent)
1990 1991 1992 1993 1994 1995 1996 1997
Czech 20 30 40 60 65 - - -
Hungary - - - - - - - -
Poland 49 50 54 57 59 62 65 -
Russia 13 13 18 28 33 34 35 -
Source: World Bank
24
4.2 Foreign Direct Investment
53. FDI commitment reached US$ 4.2 billion in 2004 and has significantly contributed to
rising investment and economic growth. Vietnam had enjoyed an FDI boom in the middle of 1990s,
which was driven by large-scale investments in real estate, hotels and other capital intensive
industries.
30
(Table 8) By contrast, the majority of current FDIs are relatively small investments in
labor-intensive industries of small manufacturing and export-oriented businesses,
31, 32
but FDIs have
substantially increased in number and amount. In the first four months of 2005, commitments
amounted to US$ 2.1 billion, or 45 percent of the yearly plan.
54. Vietnam still has barriers preventing multinational enterprises from investing in the country,
though the country has been making every effort to be competitive to rival countries in attracting
FDIs. For instance, some ministries, ministerial agencies, and provincial people’s committees are said
to have issued documents that restrict or cease investment licensing. In fact, Prime Minister’s
Directive No. 13 of 2005 warned not to issue such documents that “do not comply with the Law on
Foreign Investment and related legislative documents and international commitments.” It is
encouraging that Vietnam will unify the enterprise law with the SOE law and the domestic investment
law with the foreign investment law in order to ensure that all sorts of enterprises in Vietnam can
operate in a level-playing field and equal footing.
33
55. FDIs’ impact on capital market development would be indirect rather than direct. It is
hardly expected that locally established FDI companies will raise debt and/or equity capital in the local
markets in a significant manner. Generally, their foreign parents have better credit standing and better
access to finance in more advanced financial markets. Hence, the parents can provide their local
subsidiaries with funds that they raise at a lower cost and in a timelier manner than the local subsidiaries
do by themselves. When they need local currency funding, the local companies tend to look to the local
branches of foreign banks with which their parents have business relationship. The local branches of
30 Economist Intelligent Unit (April 2005), Country Report: Vietnam.
31 Economist Intelligent Unit (April 2005), ibid.
32
33 The 11th National Assembly passed the Unified Enterprise Law and the Common Investment Law in
December 2005, and the two laws will take effect in July 1, 2006.
Table 8: FDI Projects Licensed 1998-2005
1, 2
Number of
projects
Total registered capital
(US$ mil.)
Total registered capital
per project (US$ mi.)
1988 37 321.8 8.7
1989 69 525.2 7.6
1990 108 735.0 6.8
1991 151 1,275.0 8.4
1992 197 2,027.0 10.3
1993 274 2,589.0 9.4
1994 367 3,746.0 10.2
1995 408 6,848.0 16.8
1996 387 8,979.0 23.2
1997 358 4,894.2 13.7
1998 285 4,138.0 14.5
1999 311 1,568.0 5.0
2000 389 2,018.0 5.2
2001 550 2,592.0 4.7
2002 802 1,621.0 2.0
2003 748 1,899.6 2.5
2004 679 2,084.5 3.1
2005 259 1,685.9 6.5
Source: GSO
1
Excluding supplementary capital to the licensed projects of the previous years, the projects of VIETSOPETRO
2
As of 20 May 2005
25
foreign banks often fund the local companies at a competitive rate in the local currency with a letter of
guarantee, a letter of awareness, or similar arrangements from their parents. Furthermore, their parents
normally prefer not diluting their ownership through equity issuance in order to retain their control over
the local companies. IPOs and listings by locally established FDI companies are exceptional.
Nonetheless, FDIs will help develop the local capital markets by providing purely local companies with
growth opportunities.
34
56. FDIs by overseas Vietnamese may be more involved in the local capital markets.
Entrepreneurial overseas Vietnamese tend to be capital-constrained, relative to multinational companies.
Therefore, they are likely to attempt to leverage their direct investment in Vietnam with capital that is
locally available. The local capital markets will allow them to raise additional capital through initial public
offerings or debt issues. In addition, the possibility to divest in the local markets enables them to have an
exit strategy for their FDIs, and may help maximize their return on investment.
4.3 Private sector development
57. The private sector remains substantially outnumbered by the SOEs in terms of number of
workers as well as amount of capital recourses. The number of private enterprises sharply increased
by 22.6 percent per year between 2000 and 2003, while that of SOEs decreased by 5.6 percent per
year.
35
As a result, the SOEs and the private sector accounted for 6.7 percent and 89.6 percent of
Vietnamese enterprises in 2003, respectively. (Table 9) In a sharp contrast to the numbers of
enterprises, the private sector hired 39.6 percent of the workforce and utilized 19.6 percent of the
capital sources in 2003. At the same time, SOEs had 43.8 percent of the workforce and used 59.1
percent of the capital resources.
58. Meanwhile, the private sector appears to have steadily increased its share in industrial output
and banking credit relative to the public sector since 1994.
36
The share of “non-state” sector, which is
assumed to be a proxy for the private sector, in industrial output increased from 50.4 percent in 1994
to 60.9 percent in 2003, while its share in banking credit rose from 34.1 percent to 60.4 percent during
the same period. (Figure 3)
34 Developed capital markets will at least in theory give the foreign parents an additional exit strategy for
their FDIs – divesture in the local capital market –, making Vietnam attractive as an FDI destination.
35 The General Statistics Office of Vietnam at
508&ItemID=2603
36 In the “non-state sector, banking credit noticeably increased from 1994 to 2002, relative to industrial
output and GDP. (Figure 3) The interpretation of the conspicuous differences in increase rates among the three
indicators needs more analysis. At this moment, statistical ambiguity prevents us from doing a meaningful
analysis.
Table 9: Business Factor Distribution by Type of Business in 2003 (%)
Number of
enterprises
Employees
Capital
sources
Turnover
Contribu-
tion to state
budget
State enterprises 6.7 43.8 59.1 46.6 48.5
Private sector 89.6 39.6 19.6 33.3 14.9
Cooperatives 5.8 3.1 0.7 0.9 0.3
Private businesses 35.6 7.3 2.2 7.1 1.9
Limited companies 41.9 22.1 9.6 19.3 9.2
Joint stock companies 6.3 7.1 7.0 6.0 3.5
Foreign investment
companies
3.7 16.6 21.4 20.1 36.6
Total 100.0 100.0 100.0 100.0 100.0
Source: GSO