Quantification of vitamin e and ç oryzanol components in RiceGermandBran
Bạn đang xem bản rút gọn của tài liệu. Xem và tải ngay bản đầy đủ của tài liệu tại đây (101.41 KB, 6 trang )
Quantification of Vitamin E and
γ
-Oryzanol Components in
Rice Germ and Bran
SHANGGONG YU,
†,‡
ZACHARY T. NEHUS,
§
THOMAS M. BADGER,
‡,|
AND
NIANBAI FANG
*
,†,‡
Arkansas Children’s Nutrition Center and Department of Physiology/Biophysics,
University of Arkansas for Medical Sciences, 1120 South Marshall Street,
Little Rock, Arkansas 72202, Hubei College of Chinese Traditional Medicine,
1 Huang-jia-hu, Wuhan 430065, People’s Republic of China, and Riceland Foods, Inc.,
2120 South Park Avenue, Stuttgart, Arkansas 72160
Rice bran is a rich natural source of vitamin E and γ-oryzanol, which have been extensively studied
and reported to possess important health-promoting properties. However, commercial rice bran is a
mixture of rice bran and germ, and profiles of vitamin E and γ-oryzanol components in these two
different materials are less well-studied. In the current study, vitamin E and γ-oryzanol components
in rice bran and germ were analyzed by liquid chromatography/mass spectrometry/mass spectrometry.
The components were identified by electrospray ionization mass spectrometry (ESI-MS) with both
positive- and negative-ion modes. Both deprotonated molecular ion [M - H]
-
and protonated molecular
ion [M + H]
+
found as the base peaks in spectra of vitamin E components made ESI-MS a valuable
analytic method in detecting vitamin E compounds, especially when they were at very low levels in
samples. Ultraviolet absorption was used for quantification of vitamin E and γ-oryzanol components.
While the level of vitamin E in rice germ was 5 times greater than in rice bran, the level of γ-oryzanol
in rice germ was 5 times lower than in rice bran. Also, the major vitamin E component was R-tocopherol
in rice germ and γ-tocotrienol in rice bran. These data suggest that rice bran and germ have
significantly different profiles of vitamin E and γ-oryzanol components. The method enables rapid
and direct on-line identification and quantification of the vitamin E and γ-oryzanol components in rice
bran and germ.
KEYWORDS: Rice bran; rice germ; γ-oryzanol; vitamin E; LC-MS/MS
INTRODUCTION
Free oxygen radicals are reactive and can start chain reactions
from oxidation of lipid and protein molecules to generation of
mutagens and carcinogens (1-5), which are involved in the
pathogenesis of many diseases, such as atherosclerosis and
cancer (6). Some studies have centered on the antioxidant
nutrition in the control of degenerative diseases through both
enzymatic and nonenzymatic systems (7-9). Rice bran, as the
most nutritious part of rice and a storehouse of bioactive phyto-
nutrients, has been the topic of a great deal of research (10).
Rice bran is produced as a byproduct during the milling
process for the production of white rice (polished rice) from
brown rice, and it is a mixture of bran (brown layer) and germ
of brown rice. Rice bran has been extensively studied for its
antioxidative and disease-fighting properties in disorders such
as cancer, hyperlipidemia, fatty liver, hypercalciuria, kidney
stones, and heart disease (10). Chemical studies indicate that
rice bran is rich in vitamin E and γ-oryzanol. A natural form
of vitamin E in rice bran consists of eight homologues, four of
which are tocopherols and the other four comprising tocotrienols
(10). A natural form of vitamin E in rice bran has beneficial
effects on blood vessels and blood components (10). γ-Oryzanol
is a mixture of ferulic acid esters of triterpene alcohols and
sterols (11-14). γ-Oryzanol inhibits tumor promotion (15, 16),
reduces serum cholesterol levels (17-19), and can also be used
to treat nerve imbalance and disorders of menopause (20). Both
γ-oryzanol and vitamin E in rice bran have reported significant
antioxidant activities, which protect cells from the oxidative
damage of plasma very low-density lipoprotein, cellular proteins
and DNA and from membrane degeneration (21, 22). Rice bran
products have been widely used in agricultural, food, and
cosmetic industries, as well as in research studies aimed at
unlocking important physiological and pharmacological proper-
ties of rice phytochemicals that may be important in health
maintenance and disease prevention (10, 15, 23, 24).
* To whom correspondence should be addressed. Telephone: 011-86-
27-68890247. Fax: 011-86-27-68890113. E-mail:
†
Hubei College of Chinese Traditional Medicine.
‡
Arkansas Children’s Nutrition Center, University of Arkansas for
Medical Sciences.
§
Riceland Foods, Inc.
|
Department of Physiology/Biophysics, University of Arkansas for
Medical Sciences.
However, commercial rice bran is a mixture of rice bran and
rice germ (20% of rice bran), and the difference in the chemical
composition and nutraceutical effects between rice germ and
bran has not been well-studied. The aim of the current study
was to quantitatively analyze components of vitamin E and
γ-oryzanol in rice germ and chemically distinguish rice germ
and bran. We previously identified the γ-oryzanol components
in rice bran (25, 26). Here, liquid chromatography/mass
spectrometry/mass spectrometry (LC-MS/MS) was used to
characterize vitamin E components with their LC retention time
and both positive- and negative-ion spectra from electrospray
ionization mass spectrometry (ESI-MS). The levels of γ-oryza-
nol and vitamin E components in rice germ and bran were
determined by their peaks in LC-ultraviolet (UV) chromato-
grams.
MATERIALS AND METHODS
Material. Ethyl 4-hydroxy-3-methoxycinnate (ethyl ferulate), (+)-
R-tocopherol, (+)-δ-tocopherol, and (+)-γ-tocopherol were purchased
from Sigma-Aldrich Chemical Co. (St. Louis, MO). Internal standard
(IS) biochanin A, which was used for monitoring the stability of LC-
MS/MS analyses, was purchased from LC Laboratories (Woburn, MA).
Rice germ and full-fat raw rice bran were obtained from Riceland Foods,
Inc. (Stuttgart, AR). The rice germ and bran were made from Arkansas
grown rice, which consisted of 85% long-grain rice from three varieties
(Drew, Cypress, and Cocodrie), and the remainder (15%) was made
up by 10 varieties, including Alan, Kaybonnet, XL-6, Wells, Jefferson,
Lagrue, Lemont, Madison, Millie, and Priscilla.
Preparation of Intact Rice Germ and Bran without Intact Germ
Samples. Full-fat raw rice bran as a byproduct during the milling
process for the production of white rice was used to obtain two
samples: intact rice germs (RGs) and full-fat raw rice bran without
intact germ (FFRB). Full-fat raw rice bran was put on clean paper,
and RGs were separated from the rice bran one by one using forceps.
Separated RGs were about 10% (w/w) of full-fat raw rice bran. This
separation was only for research purposes and not involved in the
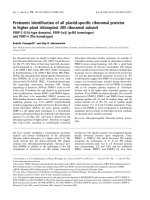
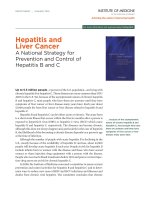
Figure 1.
Structures of vitamin E and
γ
-oryzanol components examined in this study.
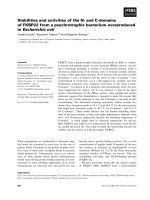
Figure 2.
LC
−
UV chromatograms from LC
−
MS/MS analyses. (A) LC
−
UV 290
±
10 nm chromatogram of vitamin E standards. (B) LC
−
UV 290
±
10 nm chromatogram of rice germ extract. (C) LC
−
UV 290
±
10 nm
chromatogram of rice bran without germ extract. (D) LC
−
UV 320
±
10
nm chromatogram of rice germ extract. (E) LC
−
UV 320
±
10 nm
chromatogram of rice bran without germ extract.
milling process. According to the information of Riceland Foods, Inc.,
rice germ is about 20% of full-fat raw rice bran, which suggest that
the sample FFRB contains about 10% broken rice germ.
Preparation of a Phytochemical Concentrate of Rice Germ and
Bran. RG was ground and used for extraction, and FFRB was directly
used for extraction. For a direct comparison, analyses of RG and FFRB
were conducted by the same method. Each sample (5.0 g) was treated
with 40 mL of 100% ethanol, and the slurry was kept at room
temperature for 24 h with occasional stirring. The slurry was filtered
through a Buchner funnel with a #4 Whatman filter paper. The
extraction process was repeated 3 more times with 100% methanol
(40 mL), 80% aqueous methanol (40 mL), and 50% aqueous methanol
(40 mL). The four extracts were combined and concentrated on a rotary
evaporator under reduced pressure at room temperature until ethanol
and methanol were removed followed by drying in a freeze-dryer. The
dry extracts (extractable phytochemicals) represented 24.8% of the rice
germ and 16.3% of the rice bran, respectively. The extract was
partitioned between water (200 mL) and dichloromethane 3 times (200
mL × 3). The aqueous layer and combined dichloromethane extract
were rotary evaporated under reduced pressure at room temperature
followed by drying in a freeze-dryer. The vitamin-E- and γ-oryzanol-
rich fractions (dichloromethane fraction) were 8.0% of the rice germ
and 7.1% of the rice bran without intact germ, respectively.
LC-MS/MS Analysis. The dichloromethane fractions were dis-
solved in 100% methanol (10 µg/µL) and directly analyzed by LC-
MS/MS with a 10 µL injection. LC-MS/MS was performed using an
Agilent 1100 series liquid chromatograph interfaced to a Bruker Model
Esquire-LC multiple ion trap mass spectrometer equipped with an
atmospheric pressure interface-electrospray (API-ES) chamber. A HP
ChemStation was used for data collection and manipulation. For high-
performance liquid chromatography (HPLC), a 150 × 4.6 mm i.d., 5
µm, Eclipse XDB-C8 column (Agilent Technologies, Wilmington, DE)
was used at a flow rate of 0.8 mL/min. The HPLC gradient was 0.1%
formic acid/acetonitrile (solvent B) in 0.1% formic acid/H
2
O (solvent
A) as follows: 20-70% B in 15 min, 70-85% B from 15 to 20 min,
85-90% B from 20 to 30 min, 90-100% B from 30 to 70 min, held
at 100% B from 70 to 75 min, and finally back to 10% B at 80 min,
with diode-array detection set at 200 ( 10, 240 ( 10, 290 ( 10, 320
( 10, and 355 ( 10 nm. For optimum MS analysis, 10 mM ammonium
acetate (for negative-ion mode) or 2% formic acid (for positive-ion
mode) in methanol was used as an ionization reagent and added at a
flow rate of 0.2 mL/min via a tee in the eluant stream of the HPLC
just prior to the mass spectrometer by an auxiliary HP 1100 series HPLC
pump. Conditions for ESI-MS analysis of HPLC peaks in both
negative- and positive-ion mode included a capillary voltage of 3200
V, a nebulizing pressure of 33.4 psi, a drying gas flow of 8 mL/min,
and a temperature of 250 °C. Parameters that control the API and the
mass spectrometer were set via the Smart Tune with the compound
stability of 50% and trap drive level of 50%. Ion-charge control (ICC)
was on, including target, 5000; maximum accumlation time, 50.00 ms;
scan, m/z 80.00-850.00; averages, 10; and rolling averaging, off.
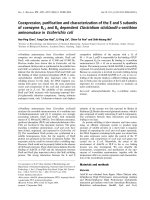
Figure 3.
ESI
−
mass and CID spectra of compound 10 in negative- and positive-ion mode and proposed collision-induced dissociation pathway of
vitamin E components. * See Table 1 for
m
/
z
value.
Table 1.
ESI
−
MS Data for Vitamin E Components in Rice Germ and Bran
negative CID spectra
m/z
(relative intensity)
positive CID spectra
m/z
(relative intensity)
compounds
retention time
(min) parent [M
−
15]
-
[frag3
−
H]
-
parent [frag1
+
H]
+
[frag2
+
H]
+
[frag3
+
H]
+
7a,
β
-tocotrienol 33.2 409 [M
−
H]
-
394 (100%) 149 (25%)
a
7b,
γ
-tocotrienol 33.8 409 [M
−
H]
-
394 (100%) 149 (25%) 411 [M
+
H]
+
205 (37) 191 (100%) 151 (55%)
9,
δ
-tocopherol 44.5 401 [M
−
H]
-
386 (100%) 135 (47%) 403 [M
+
H]
+
191 (8%) 177 (38%) 151 (100%)
10,
γ
-tocopherol 48.9 415 [M
−
H]
-
400 (100%) 149 (45%) 417 [M
+
H]
+
205 (18) 191 (55%) 151 (100%)
11,
R
-tocopherol 53.4 429 [M
−
H]
-
414 (10%) 149 (100%) 431 [M
+
H]
+
219 (13%) 205 (19%) 165 (100%)
a
The spectrum of 7a could not be obtained in LC
−
MS/MS analysis because of its very low concentration in the dichloromethane fraction.
Samples were analyzed by automatic MS/MS, with the width of the
isolation ) 4.0, fragmentation amplitude ) 1.00 V, and number of
parents ) 1.
Quantitative Determination. Phytochemicals were separated by LC
and monitored by a diode-array detector and MS. Vitamin E components
were quantified on the basis of the areas of the UV peak (at 290 ( 10
nm), and γ-oryzanol components were based on the areas of the UV
peak (at 320 ( 10 nm). The rice samples (100 µg) or standards were
dissolved in 10 µL of 100% methanol, which contained 10 ng of
biochanin A as an internal standard (IS). The stability of LC-MS/MS
analyses was monitored by comparing the UV and MS peak areas of
IS to the LC-MS/MS analyses. Calibration curves of each standard
were created from seven concentrations using Microsoft Excel software.
The concentrations of individual components in the rice samples were
determined using calibration curves of their corresponding standard.
The compounds were quantified by calibration curves of their structure-
related standards when their corresponding standards were not available.
Results are means ( standard deviation (SD) for at least three replicate
determinations.
RESULTS AND DISCUSSION
Extraction and Fractionation of Phytochemicals in Rice
Germ and Bran. The phytochemicals (24.8%, w/w) obtained
from extraction of RG with ethanol, methanol, and aqueous
methanol were much higher than those in FFRB (16.3%, w/w).
The fractionations of the extracts by the water-dichloromethane
partition indicate that RG contains significantly higher levels
of polar phytochemicals (16.8 versus 9.2%, w/w) and slightly
higher levels of nonpolar phytochemicals (8.0 versus 7.1%, w/w)
in comparison with those in FFRB. The vitamin E and
γ-oryzanol components discussed in this study are free com-
pounds in RG and FFRB because bound tocotrienols and
tocotrienol-like compounds do not release by methanol extrac-
tion without prior heating (27). The extraction of free vitamin
E and γ-oryzanol was considered nearly complete because
vitamin E and γ-oryzanol were not detected in a fifth extraction
with 100% ethanol. In the water-dichloromethane partition,
there were no detectable γ-oryzanols and vitamin E in the water
fraction, which suggested that the major part, if not all, of free
vitamin E and γ-oryzanol components of RG and FFRB was
enriched in the dichloromethane fraction.
Identification of γ-Oryzanol and Vitamin E Components.
Figure 1 shows the basic chemical structures of the compounds
investigated in this study. LC-UV chromatograms of the
dichloromethane fractions of RG and FFRB from LC-MS/MS
analyses are presented in Figure 2. A total of 23 components
of γ-oryzanol have been identified and characterized in our
previous study (25, 26). Compound 8 yielded dominant depro-
tonated molecular ion [M - H]
-
at m/z 617 in negative mode,
and the collision-induced decomposition (CID) pathway of the
deprotonated molecular ion is similar to that of major compo-
nents of γ-oryzanol (cycloartenol trans-ferulate) (25); therefore,
its possible structure is hydroxylated cycloartenol ferulate.
Because neither nuclear magnetic resonance (NMR) data of this
minor compound nor the corresponding standard was available,
identification of 8 could not be completed by the LC-MS/MS
in this study. In the present study, three vitamin E components
9, 10, and 11 in RG were identified by a direct comparison of
their corresponding standards. These compounds were (+)-δ-
tocopherol, (+)-γ-tocopherol, and (+)-R-tocopherol, respec-
tively (Figure 2). Electrospray ionization of vitamin E com-
pounds yielded mass spectra with predominant base peaks of
both deprotonated molecular ion [M - H]
-
in negative mode
and protonated molecular ion [M + H]
+
in positive mode
(Figure 3). The prominent negative and positive molecular ion
species make ESI-MS a valuable analytical method for
detecting vitamin E compounds and determining their structures,
especially when only very low concentrations of the compounds
in the sample or very small quantities of the compounds are
available. CID of protonated molecular ions from 7a, 7b, 9,
10, and 11 produced three diagnostic fragments, [frag1 + H]
+
,
[frag2 + H]
+
, and [frag3 + H]
+
, resulting from the cleavage
of the side chain accompanied by the breakdown of the chroman
structure with a hydrogen rearrangement and the loss of a methyl
acetylene (CH
3
-CtCH) fragment (Figure 3). CID of depro-
tonated molecular ions from 7a, 7b, 9, 10, and 11 produced
abundant ions of [M - H - Me]
-
, resulting from the loss of a
methyl group at the C2 position in chroman moiety and anion
[frag3 - H]
-
. The diagnostic fragmentation patterns for the
components of vitamin E in ESI-MS analysis are illustrated
in Table 1, and R-, β-, γ-, and δ-tocopherols or -tocotrienols
Table 2.
Levels of
γ
-Oryzanol and Vitamin E Components in Rice Germ and Bran
structure (Figure 1) name RG
a
(mg/kg) FFRB
a
(mg/kg)
γ
-Oryzanol Components
1
b
24-hydroxy-24-methyl-cycloartanol ferulates nd
c
17.27
±
0.51
2
b
stereoisomers of 1 nd
c
10.81
±
0.12
3 (24
S
)-cycloart-25-ene-3
β
,24-diol-3
β
-
trans
-ferulate 20.03
±
0.47 87.79
±
0.95
4 (24
R
)-cycloart-25-ene-3
β
,24-diol-3
β
-
trans
-ferulate 22.70
±
0.00 97.97
±
1.76
5
b
25-hydroxy-24-methyl-cycloartanol ferulates nd
c
30.30
±
0.70
6 cycloart-23
Z
-ene-3
β
,25-diol-3
β
-
trans
-ferulate 60.58
±
0.30 268.52
±
6.18
8
b
hydroxylated cycloartenol ferulate 14.69
±
0.47 58.84
±
0.90
12 cycloartenol
trans
-ferulate 95.01
±
0.29 489.08
±
10.31
13
b
stereoisomer of 12 7.16
±
0.00 31.28
±
1.12
14 campesterol
trans
-ferulates 64.42
±
0.56 404.57
±
2.96
15 24-methylenecycloartanol
trans
-ferulate 208.92
±
1.72 941.54
±
11.44
16 sitosterol
trans
-ferulate 73.76
±
1.22 326.01
±
3.83
17 stigmastanol
trans
-ferulate 10.88
±
0.45 49.62
±
0.75
total 578.16
±
3.83 2813.59
±
26.01
Vitamin E
7
b
γ
-tocotrienol 55.72
±
1.56 106.01
±
1.40
9
δ
-tocotrienol 30.60
±
1.28 nd
c
10
γ
-tocotrienol 68.32
±
1.45 nd
c
11
R
-tocotrienol 457.55
±
5.62 nd
c
total 612.19
±
4.75 106.01
±
1.40
a
RG, rice germ; FFRB, full-fat raw rice bran without germ.
b
Because neither NMR data of these minor compounds nor the corresponding standards were available,
identification of 1, 2, 5, 8, and 13 could not be completed by LC
−
MS/MS in this study and our previous study (
25
,
26
).
c
nd
)
not detected.
with different numbers of methyl groups in chroman are readily
distinguished by the diagnostic fragmentation pattern. However,
the fragmentation pattern cannot be employed in the discrimina-
tion between β- and γ-tocotrienols, which have the same number
of methyl groups with different positions in the chroman (7a
and 7b). The elution order of vitamin E components have been
reported to be R>β > γ > δ in a reverse-phase system (28).
Compounds 7a and 7b yielded almost identical mass spectra
and had a different retention time (Table 1). The retention times
suggest that 7a (33.2 min) and 7b (33.8 min) are β- and
γ-tocotrienols, respectively. Compound 7a was not detected by
MS in positive mode and only yielded a very small UV peak,
which indicated that a trace amount of 7a was in the dichlo-
romethane fraction.
Quantification of γ-Oryzanol and Vitamin E Components.
The LC-UV chromatograms are shown in Figure 2.LC-MS/
MS analyses were very reproducible based on the recovery rates
of all standards and IS. For example, the mean of the UV peak
at the IS (320 nm) was 132.22 ( 0.67 mAU min (mean ( SD,
n ) 9). A wavelength of 320 ( 10 nm was used to quantitate
oryzanol components, and a wavelength of 290 ( 10 nm was
used for the quantification of vitamin E components. The levels
of three tocopherols were calculated on the basis of the standard
curves of their corresponding standards. The standard curve of
γ-tocopherol was also used to calculate γ-tocotrienol. The UV
absorption of γ-oryzanol components results from the ferulic-
acid-conjugated system, and the standard curve of standard ethyl
ferulate was used for the quantification of γ-oryzanol compo-
nents. While γ-oryzanol components were detected in LC-UV
chromatograms of both 320 and 290 nm (Figure 2), they were
more sensitive at the 320 nm wavelength. The 320 nm peaks
were used to quantitate γ-oryzanol components. The results
shown in Figure 2 and Table 2 indicate a significant difference
between chemical profiles of RG and FFRB. The amounts of
vitamin E components (612.19 mg/kg) and γ-oryzanol compo-
nents (578.16 mg/kg) are almost the same as in RG (Table 2).
The major vitamin E component in RG is R-tocopherol (457.55
mg/kg). γ-Tocotrienol, which has been reported as the major
vitamin E component in commercial rice bran (14, 29), has a
lower concentration in RG. Rice bran (FFRB) used in this study
was different from commercial rice bran that has been widely
used in rice bran studies. In the present study, intact germ was
sorted out from rice bran, but the rice bran might contain broken
germ generated from the rice milling process. Only one vitamin
E component, γ-tocotrienol, was found in FFRB at the level of
106.01 mg/kg. Other vitamin E components were not detected
in the dichloromethane fraction of FFRB. The level of γ-oryza-
nol (2813.59 mg/kg) was 27 times higher than the level of
vitamin E (106.01 mg/kg) in FFRB. Because the major vitamin
E component in RG was R-tocopherol and the most abundant
vitamin E component found in FFRB was γ-tocotrienol, it is
reasonable to assume that γ-tocotrienol was extracted from the
rice bran but not the broken germ.
In summary, we analyzed free vitamin E and γ-oryzanol
components in RG and FFRB. The profiles of free vitamin E
and γ-oryzanol in RG and FFRB differ significantly. The levels
of free vitamin E and γ-oryzanol are the same as in RG, but
the level of free vitamin E is 27 times lower than that of
γ-oryzanol in FFRB. The major free vitamin E components are
R-tocopherol in RG and γ-tocotrienol in FFRB. The level of
γ-oryzanol in RG is much less than that in FFRB, but the
profiles of γ-oryzanol components in RG and FFRB are very
similar. The order of the levels of γ-oryzanol components are
15 > 12 > 16 > 14 > 6 > 4 > 3 > 17 in RG and 15 > 12 >
14 > 16 > 6 > 4 > 3 > 17 in FFRB. It is important to note
that commercial rice bran is the mixture of rice bran and germ
and different commercial rice bran may contain different levels
of vitamin E and γ-oryzanol components. Also, different
extraction methods can result in different levels of these
components because some tocotrienols and tocotrienol-like
compounds are bound to cellular components in the rice bran
(27).
ABBREVIATIONS USED
RG, intact rice germ; FFRB, full-fat raw rice bran without
intact germ; ESI-MS, electrospray ionization mass spectrom-
etry; API-ES, atmospheric pressure interface-electrospray;
ICC, ion-charge control; CID, collision-induced dissociation;
frag, fragment.
LITERATURE CITED
(1) Esterbauer, H.; Eckl, P.; Ortner, A. Possible mutagens derived
from lipids and lipid precursors. Mutat. Res. 1990, 238, 223-
233.
(2) Johnson, T. M.; Yu, Z. X.; Ferrans, V. J.; Lowenstein, R. A.;
Finkel, T. Reactive oxygen species are downstream mediators
of p53-dependent apoptosis. Proc. Natl. Acad. Sci. U.S.A. 1996,
93, 11848-11852.
(3) Gutteridge, J. M. Lipid peroxidation and antioxidants as biom-
arkers of tissue damage. Clin. Chem. 1995, 41, 1819-1828.
(4) Lawrence, J. M.; Melissa, A. T. Comparison of mutagenicities
of malondialdehyde and the side products formed during its
chemical synthesis. Cancer Res. 1980, 40, 276-282.
(5) Marnett, L. J. Oxy radicals, lipid peroxidation and DNA damage.
Toxicology 2002, 181-182, 219-222.
(6) Das, U. N. A radical approach to cancer. Med. Sci. Monit. 2002,
8, RA79-RA92.
(7) Sies, H. Oxidative stress: Oxidants and antioxidants. Exp.
Physiol. 1997, 82, 291-295.
(8) Ames, B. N. Dietary carcinogens and anticarcinogens. Oxygen
radicals and degenerative diseases. Science 1983, 221, 1256-
1264.
(9) Lipid Soluble Antioxidants: Biochemistry and Clinical Applica-
tions; Ong, A. S. H., Packer, L., Eds.; Birkhauser Verlag: Basel,
Switzerland, 1992.
(10) Jariwalla, R. J. Rice-bran products: Phytonutrients with potential
applications in preventive and clinical medicine. Drugs Exp. Clin.
Res. 2001, 27,17-26.
(11) Evershed, R. P.; Spooner, N.; Prescott, M. C.; Goad, L. J.
Isolation and characterization of intact steryl ferulates from seeds.
J. Chromatogr. 1988, 440,23-25.
(12) Xu, Z.; Godber, J. S. Purification and identification of compo-
nents of γ-oryzanol in rice bran oil. J. Agric. Food Chem. 1999,
47, 2724-2728.
(13) Diack, M.; Saska, M. Separation of vitamin E and γ-oryzanols
from rice bran by normal-phase chromatography. J. Am. Oil
Chem. Soc. 1994, 71, 1211-1217.
(14) Rogers, E. J.; Rice, S. M.; Nicolosi, R. J.; Carpenter, D. R.;
McClelland, C. A.; Romanczyk, L. J. Identification and quan-
titation of γ-oryzanol components and simultaneous assessment
of tocols in rice bran oil. J. Am. Oil Chem. Soc. 1993, 70, 301-
307.
(15) Yasukawa, K.; Akihisa, T.; Kimura, Y.; Tamura, T.; Takido,
M. Inhibitory effect of cycloartenol ferulate, a component of rice
bran, on tumor promotion in two-stage carcinogenesis in mouse
skin. Biol. Pharm. Bull. 1998, 21, 1072-1076.
(16) Akihisa, T.; Yasukawa, K.; Yamaura, M.; Ukiya, M.; Kimura,
Y.; Shimizu, N.; Arai, K. Triterpene alcohol and sterol ferulates
from rice bran and their anti-inflammatory effects. J. Agric. Food
Chem. 2000, 48, 2313-2319.
(17) Guardiola, F.; Codony, R.; Addis, P. B.; Rafecas, M.; Boatella,
J. Biological effects of oxysterols: Current status. Food Chem.
Toxicol. 1996, 34, 193-211.
(18) Seetharamaiah, G. S.; Chandrasekhara, N. Studies on hypocho-
lesterolemic activity of rice bran oil. Atherosclerosis 1989, 78,
219-224.
(19) Sugano, M.; Tsuji, E. Rice bran oil and cholesterol metabolism.
J. Nutr. 1997, 127, 521S-524S.
(20) Nakayama, S.; Manabe, A.; Suzuki, J.; Sakamoto, K.; Inagaki,
T. Comparative effects of two forms of γ-oryzanol in different
sterol compositions on hyperlipidemia induced by cholesterol
diet in rats. Jpn. J. Pharmacol. 1987, 44, 135-144.
(21) Topinka, J; Binkova, B; Sram, R. J.; Erin, A. N. The influence
of R-tocopherol and pyritinol on oxidative DNA damage and
lipid peroxidation in human lymphocytes. Mutat. Res. 1989, 225,
131-136.
(22) Xu, X.; Hua, N.; Godber, S. Antioxidant activity of tocopherols,
tocotrienols, and γ-oryzanol components from rice bran against
cholesterol oxidation accelerated by 2,2′-azobis-(2-methylpro-
pionamidine) dihydrochloride. J. Agric. Food Chem. 2001, 49,
2077-2081.
(23) Iqbal, J.; Minhajuddin, M.; Beg, Z. H. Suppression of dieth-
ylnitrosamine and 2-acetylaminofluorene-induced hepatocar-
cinogenesis in rats by tocotrienol-rich fraction isolated from rice
bran oil. Eur. J. Cancer PreV. 2004, 13, 515-520.
(24) Qureshi, A. A.; Sami, S. A.; Salser, W. A.; Khan, F. A. Dose-
dependent suppression of serum cholesterol by tocotrienol-rich
fraction (TRF
25
) of rice bran in hypercholesterolemic humans.
Atherosclerosis 2002, 161, 199-207.
(25) Fang, N.; Yu, S.; Badger, T. Characterization of triterpene alcohol
and sterol ferulates in rice bran using LC/MS/MS. J. Agric. Food
Chem. 2003, 51, 3260-3267.
(26) Luo, H-F.; Li, Q.; Yu, S.; Badger, T. M.; Fang, N. Hydroxylated
triterpene alcohol ferulates from rice bran. J. Nat. Prod. 2005,
68,94-97.
(27) Qureshi, A. A.; Mo, H.; Packer, L.; Peterson, D. M. Isolation
and identification of novel tocotrienols from rice bran with
hypocholesterolemic, antioxidant, and antitumor properties. J.
Agric. Food Chem. 2000, 48, 3130-3140.
(28) Tan, B.; Brzuskiewicz, L. Separation of tocopherol and tocot-
rienol isomers using normal- and reverse-phase liquid chroma-
tography. Anal. Biochem. 1989, 2, 368-373.
(29) Qureshi, A. A.; Salser, W. A.; Parmar, R.; Emeson, E. E. Novel
tocotrienols of rice bran inhibit atherosclerotic lesions in
C57BL/6 ApoE-deficient mice. J. Nutr. 2001, 131, 2606-2618.
Received for review July 1, 2007. Accepted July 3, 2007. Funding has
been provided in part from the U.S. Department of Agriculture/
Agricultural Research Service under project 0501-00044-001-01S, the
Arkansas Rice Research and Promotion Board, and the Hubei College
of Traditional Chinese Medicine.
JF071957P