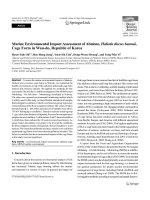
Assessment of environmental risk from polluted organic wastewater in long thanh industrial park with the nemerow index and principal component analysis
Bạn đang xem bản rút gọn của tài liệu. Xem và tải ngay bản đầy đủ của tài liệu tại đây (616.38 KB, 11 trang )
Le Nguyen Thanh Tri, Nguyen Hien Than - Volume 3 – Issue 2-2021, p. 128-138
Assessment of environmental risk from polluted organic
wastewater in Long Thanh Industrial Park with the Nemerow
index and Principal component Analysis
by Le Nguyen Thanh Tri, Nguyen Hien Than (Thu Dau Mot University)
Article Info:
Received 31 Jan. 2021, Accepted 2 June 2021, Available online 15 June 2021
Corresponding author:
/>
ABSTRACT
This study aims to assess environmental risk using the improved Nemerow index
and the principal component analysis (PCA) method in Long Thanh's Industrial
Park in Dong Nai Province. The study was implemented in five industrial parks of
Long Thanh District in 2019. The result showed that Loc An - Binh Son industrial
park was at extreme high risk of the level (6.7). Three industrial parks of Long
Thanh, Go Dau and An Phuoc were high-risk (from 3 to 5) respectively. On the
other hand, Long Duc Industrial Park has obtained no environmental risk.
Keywords: environmental risk, Nemerow risk index, Long Thanh, PCA
1. Introduction
Water pollution is not able to affect human health immediately, but it also becomes
significant damage during long-term exposure. Besides, water pollution also influenced
the economic profits. The World Bank pointed out that every year in Vietnam, 780
million USD is lost in public health fields due to environmental pollution (Thủy, 2020).
Duong Thanh Nghi et al., (2011) studied "Evaluating bio-accumulation of persistent
organic pollutants PCBS and PAHS in Ha Long Bay" the result in order to show the
pollution level of PCBs, PAHs in the natural environment of water and sediments and
their accumulation capacity in the biological flesh tissue is seasonal and increases
gradually with the food chain. Inengite, Abasi, Walter, and Chemistry (2015) studied
"Application of pollution indices to assess heavy metal pollution in flood affected soils"
the results of Original Research Article the heavy metals revealed that heavy metals
128
Thu Dau Mot University Journal of Science - Volume 3 - Issue 2-2021
concentrations where higher in the flooded soil samples compared to the unflooded soil
samples. There was also evidence of leaching of heavy metals. Zhang, Feng, and Hao
(2018) studied "Applying the Nemerow index method and integrated water Quality
index method in the water quality assessment of Zhangze Reservoir" the method is able
to objectively reflect the water quality of each water quality monitoring section and is
more suitable for the water quality evaluation of the reservoir. Sulthonuddin, Hartono,
and Said (2019) studied "Using Nemerow's pollution index method for water Cimanuk
River Quality Assessment in West Java" this research found that the Cimanuk river is
not meet the water quality standards with the value of TSS (81.57±132.69 mg/L), BOD
(8.41±6.53 mg/L), COD (33.92±26.51mg/L), DO (5.54±1.67 mg/L), and Ammonia
(0.21±0.31 mg/L). The degradation of river water quality in the Cimanuk river indicated
by increasing NPI value, NPI value of the Cimanuk river ranging from 1.04 to 7.51. The
water quality status of the Cimanuk river has been changing from slightly to moderately
polluted. Zhang, Hou, Qian, and ES (2020) studied "Water quality assessment using a
comprehensive water quality index and revised Nemerow index method: A case study
on Jinghui canal, North China'' the results showed that groundwater quality in the area
was poor due to the industrial and agricultural activities. Thus, the study on
environmental risk assessment from industrial wastewater currently has been
concerning areas, however the previous research was only focused on qualitative risk
assessment or assessment of heavy metals risk. The Nemerow index has been carried
out in many studies. However, the environmental risk assessment due to organic
pollution integrated between the Nemerow risk index and the PCA weight has not been
conducted yet. Therefore, this paper will implement an environmental risk assessment
combining the Nemerow risk index and the PCA weight to quantitate the level of impact
origin from organic pollution in industrial wastewater plants. The results of the study
will illustrate a picture of the state of industrial wastewater treatment and the risk level
of it. Furthermore, the results of the study will also provide basic information for
authorities and local managers to adapt treatment technologies and input wastewater
standards to improve industrial wastewater treatment efficiency.
2. Materials and methods
The data of the study
The data were collected from reports of wastewater monitoring of industrial parks in
Long Thanh District in 2019. Each monitoring station, there is a frequency of 12 times
per year. Five Industrial Parks by Go Dau Industrial Park, An Phuoc Industrial Park,
Long Thanh Industrial Park, Loc An Industrial Park - Binh Son, Long Duc Industrial
Park were chosen to study. Pollution parameters were observed in this study including
pH, total N, total P, total Ammonium, BOD5, COD, and Fluoride.
129
Le Nguyen Thanh Tri, Nguyen Hien Than - Volume 3 – Issue 2-2021, p. 128-138
Figure 1. The map of sampling locations
The Nemerow risk index
In this study, the author used the Nemerow risk index to calculate the environmental
risk from organic pollution of industrial wastewater. In 1974 the Nemerow index was
published by NL Nemerow (Nemerow & Leonard, 1974). Many studies use this index
to evaluate the water quality as HaoYulin and GeZhenchang (1989), Islam, Ahmed,
Raknuzzaman, Mamun, and Islam (2015). The assessment process is generalized as
follows.
Step 1: Collecting monitoring data. In this study, data on wastewater monitoring of
industrial parks in 2019 were used.
Step 2: Calculating the rate of exceeding standard and the level of wastewater pollution
following the formula (Zhang et al., 2020):
According to traditional assessment, the Nemerow index is calculated by Eq 1. (A. K.
Inengite, Abasi, & Walter, 2015):
Ps
2
2
Pave
Pmax
2
(1)
Of which:
+ Ps is the target of Nemerow pollution index
130
Thu Dau Mot University Journal of Science - Volume 3 - Issue 2-2021
+ Pave is the average value of the single pollution index (Pi) of each parameter.
+ Pmax is the highest value of the parameter.
As stated in the evaluation formula, the weights of the pollution parameters are the
same. However, the influence degree of parameters on wastewater quality is different
according to many opinions of the studies. In this study, the weights of the pollutants
were determined with the Entropy method. The formula for calculating the Nemerow
risk index was modified as follows (QianZhang, Feng, & Hao, 2018):
Ps
2
(Wi Pi )2 Pmax
2
(2)
In which, Wi is the weight of the i single pollutants.
The results of the Nemerow risk index are compared with the rating scale to determine
the pollution level such as the water quality results are classified into 5 levels: Good P
<1, Caution 1 (QianZhang et al., 2018; Tao, Yujia, & Kai, 2011).
Determining weights based on the principal components analysis (PCA)
Principal components analysis groups together individual parameters that are collinear
to form an overall index that obtains as much as possible of the information common to
individual parameters. According to PCA, the weighting takes place only to correct for
corresponding information between two or more correlated parameters, and is not a
compute of the theoretical significance of the associated variables (Zhang et al., 2020).
Steps for weighting parameters are as follows:
Step 1: Standardizing monitoring data
Step 2: Calculating the component score coefficient matrix
Step 3: Determining eigenvalues of the matrix
Step 4: Evaluating the variance contribution rate of principal components
Step 5: Implementing the rotation component matrix
Step 6: Computing weight for all parameters of pollutants.
Standard criteria choose loading factors that: (i) have associated initial eigenvalues
larger than one; (ii) contribute individually to the explanation of overall variance by
more than 10%; and (iii) contribute cumulatively to the principal components of the
overall variance by more than 60% (Zhang et al., 2020).
3. Results and discussion
The weights of parameters
131
Le Nguyen Thanh Tri, Nguyen Hien Than - Volume 3 – Issue 2-2021, p. 128-138
According to the result of the principal component analysis method, wastewater
monitoring data obtained three principal components representing 82.68% of the
variance of the sample with eigenvalue > 1.
TABLE 1. The eigenvalue and % cumulative variance of the data
F1
F2
F3
F4
F5
F6
F7
Eigenvalue
2.80
2.05
0.94
0.51
0.38
0.23
0.09
% variance
39.94
29.30
13.44
7.29
5.44
3.34
1.24
% accumulation
39.94
69.25
82.68
89.98
95.42
98.76
100
As can be seen from Figure 2 and Figure 3 illustrated the first five-component account
for 95.4% of the variance of the overall sample. Therefore, in this study, the first fivecomponents were chosen to determine the weight of the pollutants affecting the
industrial wastewater quality. Besides, Figure 3 also showed that the Total Phosphorus
was the highest load factor in the first-factor component, followed by Fluoride. In the
second factor component, BOD5 and COD were the highest load factor.
Scree plot
90,0
95,4
98,8 100,0
80
Eigenvalue
82,7
2
69,2
60
1,5
40
1
39,9
20
0,5
0
F2
F3
F4
F5
F6
0,75
0,5
A-Nito
A-Florua
A-pH
Tổng A-Amoni
tổng
0,25
0
A-P tổng
-0,25
-0,5
-0,75
0
F1
A-BOD5
A-COD
1
D2 (26.31 %)
2,5
Variables (axes D1 and D2: 50.26 %)
after Varimax rotation
100
Cumulative variability (%)
3
F7
-1
-1
axis
-0,75 -0,5 -0,25
0
0,25
0,5
0,75
D1 (23.95 %)
Figure 2. Diagram of eigenvalue and
cumulative variance
TABLE 2. Squared load factors of
parameters in the principal components
Figure 3. Load coefficients of
parameters in Factor 1 and 2
TABLE 3. The Weights of variances
132
1
Thu Dau Mot University Journal of Science - Volume 3 - Issue 2-2021
As we can see that the results of weighting calculation of pollutant parameters in
wastewater obtained weighted values (pH, N-total, P-total, Amoni, BOD5, COD,
Florua) = (0.12; 0.11; 0.16; 0.12; 0.19; 0.17; 0.14). BOD5 was the highest importance of
elements affecting the industrial wastewater quality, then COD. Ph was recognized as
the lowest contribution on the industrial wastewater quality.
The current status of wastewater treatment of industrial parks
There are five industrial parks in operation in Long Thanh District enclosing Go Dau
Industrial Park, Long Duc Industrial Park, Long Thanh Industrial Park, An Phuoc
Industrial Park, Loc An- Binh Son Industrial Park. Almost all industrial parks applying
the main treatment technology are using the aerotank activated sludge, by contrast just
only Loc An - Binh Son Industrial Park is applying treatment technology with SBR
aerobic activated sludge. This technology is cheaper and capable of operation is steady.
The treatment effectiveness is higher than other technologies.
The results of the wastewater treatment of the most industrial parks agree with QCVN
40:2011 of the Ministry of Natural Resources and Environment as the following
describes.
An Phuoc Industrial Park
TABLE 4. Descriptive statistics of the wastewater quality of An Phuoc Industrial Park
N-total
(mg/l)
P-total
(mg/l)
Amoni
(mg/l)
BOD5
(mg/l)
COD
(mg/l)
Min
9.51
7.74
0.42
0.09
11.00
46.00
Floru
a
(mg/l)
0.07
Max
10.04
9.98
0.67
0.22
12.00
48.00
0.24
Mean
QCVN
40:2011
(Column A)
9.78
8.86
0.55
0.16
11.50
47.00
0.16
7.2 to 10.8
24
4.8
6
36
90
6
It can be seen from Table 3 and
Figure 4, the observed parameters
in An Phuoc Industrial Park were
within the permitted limits of
QCVN 40:2011(Kp =1.2, Kf = 1.0).
Of which, only pH pollutant has
exceeded the standard of 1,1156.
Thereby, it evidenced that the
industrial wastewater treatment
system of An Phuoc Industrial
Park has handled monitoring
parameters so well.
The rate of
exceeding standard
pH
Statistic
1,4
1,2
pH
1
0,8
0,6
0,4
0,2
N-total
COD
BOD5
P-total
Amoni
Florua
0
Parameter
Figure 4. The rate of exceeding standards
of An Phuoc Industrial Park
Go Dau Industrial Park
133
Le Nguyen Thanh Tri, Nguyen Hien Than - Volume 3 – Issue 2-2021, p. 128-138
TABLE 5. Descriptive statistics of the wastewater quality of Go Dau Industrial Park
6.27
N-total
(mg/l)
3.81
P-total
(mg/l)
0.32
Amoni
(mg/l)
0.08
BOD5
(mg/l)
2.00
COD
(mg/l)
10.00
Florua
(mg/l)
0.20
Max
7.31
15.00
0.74
1.30
8.00
31.00
0.65
Mean
QCVN
40:2011
(Column A)
6.81
7.08
0.48
0.23
4.92
18.00
0.39
7.2 to 10.8
24
4.8
6
36
90
6
Statistic
pH
Min
From Table 4 and Figure 5, we
realized that the pollutants in
Go Dau Industrial Park agreed
within the limits of QCVN 40:
2011 (Kp =1.2, Kf = 1.0). It
showed that the wastewater
treatment system of Go Dau
Industrial Park was good.
Number of
exceeding
standards
1,4
pH
1,2
1
0,8
0,6
N-total
Amoni COD
P-total BOD5 Florua
0,4
0,2
0
Parameter
Figure 5. The rate of exceeding standards of Go
Dau Industrial Park
Loc An - Binh Son Industrial Park
TABLE 6. Descriptive statistics the wastewater quality of of Loc An - Binh Son
Industrial Park
pH
N-total
(mg/l)
Amoni
(mg/l)
14.80
Ptotal
(mg/l)
0.94
Min
6.09
Max
6.99
Mean
QCVN 40:2011
(Column A)
15.00
0.96
6.54
14.90
7.2 to 10.8
24
According to Table 5 and
Figure 6, it can be found that
the observed parameters in
Loc An - Binh Son Industrial
Park adhered by the limit of
QCVN 40: 2011 (Kp =1.2, Kf
= 1.0). It indicated that the
wastewater treatment system
of Loc An- Binh Son
Industrial Park has handled
well monitoring parameters.
BOD5
(mg/l)
COD
(mg/l)
Florua
(mg/l)
0.00
8.00
25.00
0.00
0.00
13.00
33.00
0.00
0.95
0.00
10.50
29.00
0.00
4.8
6
36
90
6
pH
Number of
exceeding
standards
Statistic
1
N-total
0,5
0
P-total
BOD5
Amoni
COD
Florua
Parameter
Figure 6. Number of exceeding standards of Loc An
Industrial Park - Binh Son
134
Thu Dau Mot University Journal of Science - Volume 3 - Issue 2-2021
Long Duc Industrial Park
TABLE 7. Descriptive statistics the wastewater quality of Long Duc Industrial Park
Statistic
pH
Min
6.96
Ntotal
(mg/l)
5.33
Max
7.84
12.20
0.29
1.52
8.00
32.00
1.53
Mean
QCVN 40:2011
(Column A)
7.45
7.67
0.25
0.99
5.08
19.92
0.78
7.2 to 10.8
24
4.8
6
36
90
6
Amoni
(mg/l)
BOD5
(mg/l)
COD
(mg/l)
Florua
(mg/l)
0.19
0.30
4.00
13.00
0.43
The rate of
exceeding standards
As can be seen from Table 6
and Figure 7 that Long Duc
Industrial Park practised good
wastewater treatment so that
all pollutants were closed with
QCVN 40:2011 (Kp =1.2, Kf
= 1.0). This indicated that the
effectiveness of the treatment
plant was good performance.
P-total
(mg/l)
1,4
1,2
pH
1
0,8
BOD5
Amoni COD
Florua
P-total
0,6
N-total
0,4
0,2
0
Parameter
Figure 7. The rate of exceeding standards of
Long Duc Industrial Park
Long Thanh Industrial Park
TABLE 8. Descriptive statistics the wastewater quality of of Long Thanh Industrial
Park
Min
Max
Mean
QCVN 40:2011
(Column A)
pH
7.77
8.10
7.92
N-total
(mg/l)
6.95
15.90
11.37
P-total
(mg/l)
0.09
0.25
0.14
Amoni
(mg/l)
0.48
1.72
0.88
BOD5
(mg/l)
7.00
15.00
10.58
COD
(mg/l)
36.00
48.00
41.00
Florua
(mg/l)
0.76
1.36
1.07
6.48 to 9.72
21.6
4.32
5.4
32.4
81
5.4
It can be seen from Table 7
and Figure 8 that the
technology applied in the
treatment plant achieved a
good efficiency with QCVN
40:2011 (Kp =1.2, Kf = 0.9).
Number of exceeding
standards
Statistic
1,4
1,2
1
0,8
0,6
0,4
0,2
pH
N-total
COD
BOD5
Amoni
Florua
P-total
0
Parameter
Figure 8. The rate of exceeding standards of Long
Thanh Industrial Park
135
Le Nguyen Thanh Tri, Nguyen Hien Than - Volume 3 – Issue 2-2021, p. 128-138
In conclusion, it could be argued that
the current treatment technology of
almost industrial parks has a stable
treatment efficiency. Most of the
pollutants met in the limit of national
technique regulation. Only the pH of
An Phuoc Industrial Park exceeded
the standard compared to QCVN 40:
2011/BTNMT.
The state of environmental risks
from polluted organic wastewater in
Long Thanh’s industrial park
Figure 9. The risk level of Industrial Parks
To determine the current organic contaminants of each industrial park, we rely on
National technical regulation on surface water quality QCVN 08-MT: 2015 / BTNMT.
The purpose is to monitor a total load of pollutants discharged into the receiving waters
through the basic parameters that determine the quality of water sources, thereby
specifying the whole allowable maximum discharge load and discharge level for each
waste source. Wastewater standards and regulations need to be built based on this basal
purpose, including the feasibility of wastewater treatment methods and minimizing
pollutants for the sustainability of the natural environment and the conservation of
aquatic plants and animals in the habitat. Although the current state of the organic
pollution of each industrial park, the results of the environmental risk from industrial
parks.
TABLE 9. The Nemerow risk index of Long Thanh’s industrial parks
Industrial Parks
The risk level
An Phuoc Industrial Park
4.0
Go Dau Industrial Park
3.4
Loc An - Binh Son Industrial Park
Long Duc Industrial Park
6.7
2.5
3.0
Long Thanh Industrial Park
136
Thu Dau Mot University Journal of Science - Volume 3 - Issue 2-2021
As is shown by Table 8, Long Duc Industrial Park was the lowest risk (2.5), followed
by Long Thanh Industrial Park (3.0) at caution level. Go Dau Industrial Park and An
Phuoc Industrial Park were high level of 3.4, (4.0), Loc An - Binh Son Industrial Park
was extremely high risk.
4. Conclusion
Although the development of the industrialization-modernization at Long Thanh's
District Industrial Park brings many economic benefits, the environmental pollution
problem also causes many consequences. The Nemerow risk index and PCA weights
were good performance to evaluate the environmental risk causing wastewater. This
study is the prerequisite to initiate studies on the handling of organic substances in
industrial wastewater and to overcome problems from the dangers of organic
substances.
Acknowledgements
This work is supported by Dong Nai Department of Natural Resources and Environment. The authors are
grateful for editors and anonymous reviewers for their helpful and constructive comments on an earlier
draft of this article.
References
HaoYulin, & GeZhenchang (1989). Water quality evaluation for rivers of Xinjiang in
China. Paper presented at the Regional Characterization of Water Quality, China.
Inengite, A., Abasi, C., Walter, C. J. I. R. J. o. P., & Chemistry, A. (2015). Application
of pollution indices for the assessment of heavy metal pollution in flood impacted
soil. 175-189.
Inengite, A. K., Abasi, C. Y., & Walter, C. (2015). Application of pollution indices for
the assessment of heavy metal pollution in flood impacted soil. International
research journal of pure & applied chemistry, 8(5), 175-189.
Islam, M. S., Ahmed, M. K., Raknuzzaman, M., Mamun, M. H.-A.-., & Islam, M. K.
(2015). Heavy metal pollution in surface water and sediment: A preliminary
assessment of an urban river in a developing country. Ecological Indicators, 48,
282–291. doi: />Nemerow, & Leonard, N. (1974). Scientific stream pollution analysis.
Dương Thanh Nghị, Trần Đức Thạnh, Trần Văn Quy và Đỗ Quang Huy (2011). Đánh
giá khả năng tích tụ sinh học chất ô nhiễm hữu cơ bền PCBs và PAHs vùng vịnh
Hạ Long. Tuyển tập báo cáo Hội nghị Khoa học và Cơng nghệ Biển tồn quốc lần
thứ V, 77.
137
Le Nguyen Thanh Tri, Nguyen Hien Than - Volume 3 – Issue 2-2021, p. 128-138
QianZhang, Feng, M., & Hao, X. (2018). Application of nemerow index method and
integrated water quality index method in water quality assessment of Zhangze
Reservoir. Earth and Environmental Science, 128, 1-6. doi: 10.1088/17551315/128/1/012160
Sulthonuddin, I., Hartono, D. M., & Said, C. A. A. (2019). Using Nemerow’s pollution
index method for water quality assessment of Cimanuk River in West Java.
Tao, T., Yujia, Z., & Kai, H. (2011). Water quality analysis and recommendations
through comprehensive pollution index method. Management Science And
Engineering, 5(2).
Thủy, V. T. D. (2020). Some solutions to complete regulations on waste management of
the Law on Environmental Protection. Vietnamese Environment administration
Magazine, 2.
Zhang, Q., Feng, M., & Hao, X. (2018). Application of Nemerow index method and
integrated water quality index method in water quality assessment of Zhangze
Reservoir. Paper presented at the IOP Conf. Ser. Earth Environ. Sci.
Zhang, Y., Hou, K., Qian, H. J. E., & ES. (2020). Water quality assessment using
comprehensive water quality index and modified Nemerow index method: A case
study of Jinghui Canal, North China. 467(1), 012125.
138