Báo cáo y học: " Advantages of the single delay model for the assessment of insulin sensitivity from the intravenous glucose tolerance test" doc
Bạn đang xem bản rút gọn của tài liệu. Xem và tải ngay bản đầy đủ của tài liệu tại đây (822.73 KB, 20 trang )
RESEARC H Open Access
Advantages of the single delay model for the
assessment of insulin sensitivity from the
intravenous glucose tolerance test
Simona Panunzi
1*
, Andrea De Gaetano
1
, Geltrude Mingrone
2
* Correspondence: simona.
1
CNR-Institute of Systems Analysis
and Computer Science (IASI),
BioMathLab, Rome, Italy
Abstract
Background: The Minimal Model, (MM), used to assess insulin sensitivity (IS) from
Intra-Venous Glucose-Tolerance Test (IVGTT) data, suffers from frequent lack of
identifiability (parameter estimates with Coefficients of Variation (CV) less than 52%).
The recently proposed Single Delay Model (SDM) is evaluated as a practical
alternative.
Methods: The SDM was applied to 74 IVGTTs from lean (19), overweight (22), obese
(22) and morbidly obese (11) subjects. Estimates from the SDM (K
xgI
) were compared
with the corresponding MM (S
I
), 1/HOMA-IR index and Euglycemic-Hyperinsulinemic
Clamp (M-EHC over 7 subjects) estimates.
Results: K
xgI
was identifiable in 73 out of 74 subjects (CV = 69% in the 74
th
subject) and
ranged from 1.25 × 10
-5
to 4.36 × 10
-4
min
-1
pM
-1
;S
I
CV was >52% in 36 subjects (up to
2.36 × 10
9
%) and presented 18 extreme values (≤ 1.5 × 10
-12
or ≥ 3.99).
K
xgI
correlated well with 1/HOMA-IR (r = 0.56, P < 0.001), whereas the correlations
K
xgI
-S
I
and 1/HOMA-IR-S
I
were high (r = 0.864 and 0.52 respectively) and significant
(P < 0.001 in both cases) only in the non-extreme S
I
sub-sample (56 subjects). Correla-
tions K
xgI
vs. M-EHC and S
I
vs. M-EHC were positive (r = 0.92, P = 0.004 and r = 0.83,
P = 0.02 respectively). K
xgI
decreased for higher BMI’s (P < 0.001), S
I
significantly so only
over the non-extreme-S
I
sub-sample. The Acute Insulin Response Index was also com-
puted and the expected inverse (hyperbolic) relationship with the K
xgI
observed.
Conclusions: Precise estimation of insulin sensitivity over a wide range of BMI,
stability of all other model paramet ers, closer adherence to accepted physiology
make the SDM a useful alternative tool for the evaluation of insulin sensitivity from
the IVGTT.
Background
Insulin Resistance (IR), an impaired metaboli c response to circulating insulin resulting
in a decreased ability of the body to respond to the hormone by suppressing Hepatic
Glucose Output and enhancing tissue glucose uptake, plays a central role in the devel-
opment of Type 2 Diabetes Mellitus. In fact, IR develops long before diabetes, as has
been described in the relatives of type 2 diabetic patients [1]. Further, the metabolic
consequences of elevated body mass index (BMI), such as IR, are the critical factors
that confer risk for type 2 diabetes [2] or cardiovascular disease associated with fatness
[3].
Panunzi et al. Theoretical Biology and Medical Modelling 2010, 7:9
/>© 2010 Panunzi et al; licensee BioMed Central Ltd. This is an Open Access art icle distrib uted under the terms of the Creative Commons
Attribution License (http://creativecom mons.org/licenses/by/2.0), which permits unrestricted use, distr ibution, and reproduction in
any medium , provided the original work is properly cited.
IR is present in a variety of diseases other than Type 2 Diabetes Mellitus and obesity,
including hypertension [ 4], coronary heart disease [5], chronic renal failure [6], liver
cirrhosis [7]. Due to the large prevalence of IR in the general population [8] and to its
correlation and possibly causative role in many diseases [9], it has become of consider-
able interest to have an accurate measurement of the degree of IR by tests that are
easy to perform and operator-independent. While the Euglycemic Hyperinsulinemic
Clamp (EHC) has been long considered as the “golden standard” in clinical research
[10], it requires careful training of the operator, and may be potentially dangerous for
the subjects investigated due to the h igh levels of insulinemia reached during the test.
Moreover, due to its intrinsic complexity (the subjects must lie in bed, infusion pumps
and continuous bedside measurements of glycemia are required), this procedure is not
easily applied to studies involving large patient samples. The Insulin Resistance Ather-
osclerosis Study (IRAS), for instance, performed on 398 black, 457 Hispanic, and 542
non-Hispanic white subjects, evaluated insulin sensitivity (S
I
) by the frequently sampled
intravenous glucose tolerance test (IVGTT), analyzed by means of the Minimal Model
(MM)[11].TheMM,introducedinthelateseventies,alsosuffers,however,from
some relevant problems, one of which is the frequent occurrence of “zero-S
I
“ values,
i.e. of very low point estimates of the insulin sensitivity index, particularly in large clin-
ical studies [12].
Recently, on a series o f subjects with BMI < 30 and with fasting glycemia < 7 mM
[13],itwasshownthattheS
I
parameter from the MM is statistically unidentifiable
(being estimated as not significantly different from zero) in as much as 50% of the
healthy population. The possibility to reliably estimate an index of IR is, of course, cru-
cial for any model aiming at being useful to diabetologists. Part of the problem of the
lack of identifiability of the S
I
from the M M may reside in the MM being actually
overparametrized with respect to the information available from the 23-point IVGTT
[13]. Another important element determining this lack of identifiability resides in the
parameter estimation strategy suggested by the proposing Authors [14] and commonly
followed in applications, i.e. to use interpolated observed insulinemias (obviously
affected by experimental error) as the input function in the model for fitting glycemias.
This ‘decoupling’ fitting strategy delivers parameter estimates which optimize the
adherence of the model to observed gly cemias by considering random fluctuations of
insulinemia as the true input signal: t hese estimates a re, quite understandably, prone
to error. In the recently published paper introducing the Single Delay Model (SDM) to
assess insulin sens itivity after an IVGT T [13], the effect of avoiding the above sources
of error is discussed in detail.
The appropriate mathematical behaviour of the SDM itself has also been the object
of a previous paper [15]. The SDM was designed to fit simultaneously both glucose
and insulin time courses with a reduced number of parameters (six free parameters
overall instead of at least eight for the MM if both glycemias and insulinemias are pre-
dicted), and was shown to provide robust and precise estimates of insulin sensitivity in
a sample of non-obese subjects with normal fasting glycemia.
The goal of the present study is to apply the same SDM t o a heterogeneous popula-
tion, consisting of overweight, obese and morbidly obese subjects compared with lean
individuals, in order to verify the performance of this model over the entire BMI range
of interest for diabetologists.
Panunzi et al. Theoretical Biology and Medical Modelling 2010, 7:9
/>Page 2 of 20
Methods
Experimental protocol
Data related to 74 healthy volunteers and obese subjects (28 males, 46 females, BMI
from 18.51 to 62.46 [Kg/m
2
], average anthropometric characteristics reported in
Table 1) from archived, unpublished studies conducted at the Catholic Universit y
Department of Metabolic Diseases in Rome, were analyzed.
19 subjects were lean individuals (BMI ≤ 24 Kg/m
2
, average 22.40 ± 1.68 SD), 22
were overweight (24< BMI ≤ 30 Kg/m
2
, average 25.78 ± 1.34), 22 were obese (30 <
BMI ≤ 40 Kg/m
2
, average 34.34 ± 2.74) and 11 were morbidly obese (BMI > 40 Kg/m
2
,
average 48.68 ± 6.68). All subjects had negative family and personal histories for Dia-
betesMellitusandotherendocrinediseases, were on no medications, had no current
illness and had maintained a constant body weight for the six months preceding each
study.
For the three days preceding the study each subject followed a standard composition
diet (55% carbohydrate, 30% fat, 15% protein) ad libitum with at least 250 g carbohy-
drates per day. Written informed consent was obtained in all cases; all original study
protocols were conducted according to the Declaration of Helsinki and along the
guidelines of the institutional review board of the Cathol ic University School of M edi-
cine, Rome, Italy.
Each study was performed at 8:00 AM, after an overnight fast, with the subject
supine in a quiet room with constant temperature of 22-24°C . Bilateral polyethylene I.
V. cannulas were inserted into antecubital veins. The standard IVGTT was employed
(without either Tolbutamide or insulin injections) [11]: at time 0 ( 0’)a33%glucose
solution (0.33 g Glucose/kg Body Weight) was rapidly injected (less than 3 minutes)
through one arm li ne. Blood samples (3 ml each, in lithium heparin) were obtained at
-30’,-15’,0’ ,2’,4’ ,6’,8’,10’,12’,15’,20’,25’,30’ ,35’,40’,50’,60’,80’,100’,120’,140’,
160’ and 180’ through the contralateral arm vein. Each sample was immediately centri-
fuged and plasma was separated. Plasma glucose was measured by the glucose oxidase
method (Beckman Glucose Analyzer II, Beckman Instruments, Fullerton, CA, USA) .
Plasma insulin was assayed by standard radio immunoassay technique. The plasma
levels of glucose and insuli n obtained at -30’,-15’ and 0’ were averaged to yield the
baseline values referred to 0’.
Seven out of the 74 subjects also underwent a Hyperinsulinemic-Euglycemic glucose
Clamp study. They were admitted to the Department of Metabolic Diseases at 6.00 p.m.
of the day before the study. At 7:00 a. m. on the following morning, indirect calorimetric
monitoring was started; the infusion catheter was inserted into an antecubital vein; the
sampling catheter was introduced in the contralateral dorsal hand vein and this h and
was kept in a heated box (60°C) to obtain arterialized blood. The g lycemia of diabetic
patients was maintained below 100 mg/dl by small bolus doses of short-acting human
insulin (Actrapid HM, Novo Nordisk, Denmark) until the beginning of the study. A t
9.00 a.m., after 12 to 14 hour overnight fast, the euglycemic hyperinsulinemic glucose
clamp was performed as described by De Fronzo et al [16]. A priming dose o f short-act-
ing human insulin was given during the initial 10 minutes in a logarithmically decreasing
way, in order t o acutely raise the serum insulin to the desired concentration. Insulin
concentration was then maintained approximately c onstant with a continuous infusion
of insulin at an infusion rate of 40 mIU/m
2
/minute for 110 minutes.
Panunzi et al. Theoretical Biology and Medical Modelling 2010, 7:9
/>Page 3 of 20
Table 1 Anthropometric characteristic of the studied subjects along with the
descriptives of the 1/HOMA-IR and HOMA2 indices and of the two insulin-sensitivity
indices K
xgI
and S
I
in the Full Sample and in the Sub-sample (not including extreme
S
I
values)
Anthropometric characteristic Full Sample
Age Height (cm) BW (Kg) BMI G
b
(mM) I
b
(pM)
BMI ≤ 24 Mean 41.7 166.8 62.7 22.4 4.4 33.0
Std. Dev. 18.5 9.8 9.5 1.7 0.6 13.2
Std. Err. 4.2 2.2 2.2 0.4 0.1 3.0
N 19 19 19 19 19 19
24>BMI ≤ 30 Mean 47.2 166.0 71.3 25.8 4.6 46.1
Std. Dev. 14.8 7.9 8.8 1.3 0.5 26.5
Std. Err. 3.2 1.7 1.9 0.3 0.1 5.6
N 22 22 22 22 22 22
30>BMI ≤ 40 Mean 49.5 163.0 91.5 34.3 4.3 70.0
Std. Dev. 17.5 8.3 12.4 2.7 0.5 46.4
Std. Err. 3.7 1.8 2.6 0.6 0.1 9.9
N 22 22 22 22 22 22
BMI>40 Mean 40.4 162.0 127.4 48.7 4.8 96.4
Std. Dev. 9.7 8.4 16.2 6.7 0.4 59.7
Std. Err. 2.9 2.5 4.9 2.0 0.1 18.0
N 11 11 11 11 11 11
Total Mean 45.5 164.7 83.4 30.9 4.5 57.3
Std. Dev. 16.2 8.6 24.3 9.3 0.5 42.7
Std. Err. 1.9 1.0 2.8 1.1 0.1 5.0
N 74 74 74 74 74 74
Full Sample
1/HOMA-IR HOMA2 K
xgI
S
I
BMI ≤ 24 Mean 1.4 1.64 1.6E-04 47.2
Std. Dev. 1.1 0.51 9.3E-05 205.8
Std. Err. 0.3 0.13 2.1E-05 47.2
N 19 16 19 19
24>BMI ≤ 30 Mean 1.0 1.37 1.3E-04 13.8
Std. Dev. 0.6 0.59 7.6E-05 64.6
Std. Err. 0.1 0.13 1.6E-05 13.8
N 22 20 22 22
30>BMI ≤ 40 Mean 0.8 1.16 8.4E-05 101.3
Std. Dev. 0.4 0.67 7.1E-05 246.9
Std. Err. 0.1 0.14 1.5E-05 52.6
N 22 22 22 22
BMI>40 Mean 0.4 0.73 2.8E-05 139.8
Std. Dev. 0.2 0.30 9.5E-06 270.9
Std. Err. 0.1 0.09 2.9E-06 81.7
N 11 11 11 11
Total Mean 1.0 1.26 1.1E-04 67.1
Std. Dev. 0.8 0.62 8.5E-05 203.3
Std. Err. 0.1 0.08 9.9E-06 23.6
N 74 69 74 74
Panunzi et al. Theoretical Biology and Medical Modelling 2010, 7:9
/>Page 4 of 20
The Single Delay Model (SDM)
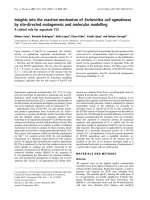
The schematic diagram of the mathematical model is represented in Figure 1 and its
equations are reported below:
(1)
(1a)
(2)
(2a)
The meaning of the structural parameters is reported in Table 2. The initial condition
G
b
+GΔ expresses the glucose concentration as variation with respect to the basal
Table 1: Anthropometric characteristic of the stud ied subjects along with the descrip-
tives of the 1/HOMA-IR and HOMA2 indices and of the two insulin-sensitivity indices
K
xgI
and S
I
intheFullSampleandintheSub-sample(notincludingextremeS
I
values)
(Continued)
Sub-Sample
1/HOMA-IR HOMA2 K
xgI
S
I
BMI ≤ 24 Mean 1.5 1.68 1.6E-04 1.4E-04
Std. Dev. 1.1 0.53 9.6E-05 8.9E-05
Std. Err. 0.3 0.15 2.4E-05 2.2E-05
N 16 13 16 16
24>BMI ≤ 30 Mean 1.0 1.40 1.3E-04 1.1E-04
Std. Dev. 0.6 0.59 7.8E-05 6.3E-05
Std. Err. 0.1 0.14 1.7E-05 1.4E-05
N 21 19 21 21
30>BMI ≤ 40 Mean 0.6 0.98 5.3E-05 7.5E-05
Std. Dev. 0.4 0.68 2.8E-05 7.8E-05
Std. Err. 0.1 0.21 8.5E-06 2.4E-05
N 11 11 11 11
BMI>40 Mean 0.4 0.70 2.8E-05 3.6E-05
Std. Dev. 0.2 0.30 1.0E-05 1.4E-05
Std. Err. 0.1 0.11 3.6E-06 4.8E-06
N 8888
Total Mean 1.0 1.27 1.1E-04 1.0E-04
Std. Dev. 0.8 0.65 8.5E-05 7.8E-05
Std. Err. 0.1 0.09 1.1E-05 1.0E-05
N 56 51 56 56
Panunzi et al. Theoretical Biology and Medical Modelling 2010, 7:9
/>Page 5 of 20
Figure 1 Block diagram of the Single Delay Model. The model consists of two compartments: the
glucose plasma concentrations and the insulin plasma concentrations. Elimination of glucose from plasma
occurs depending on plasma insulin concentrations.
Table 2 Definition of the symbols used in the discrete Single Delay Model
Symbol Units Definition
G(t) [mM] glucose plasma concentration at time t
G
b
[mM] basal (preinjection) plasma glucose concentration
I(t) [pM] insulin plasma concentration at time t
I
b
[pM] basal (preinjection) insulin plasma concentration
K
xgI
[min
-1
pM
-1
] net rate of (insulin-dependent) glucose uptake by tissues per pM of plasma insulin
concentration
T
gh
[mmol min
-1
kgBW
-1
]
net balance of the constant fraction of hepatic glucose output (HGO) and insulin-
independent zero-order glucose tissue uptake
V
g
[L kgBW
-1
] apparent distribution volume for glucose
D
g
[mmol kgBW
-1
] administered intravenous dose of glucose at time 0
G
Δ
[mM] theoretical increase in plasma glucose concentration over basal glucose
concentration at time zero, after the instantaneous administration and distribution
of the I.V. glucose bolus
K
xi
[min
-1
] apparent first-order disappearance rate constant for insulin
T
igmax
[pmol min
-1
kgBW
-1
]
maximal rate of second-phase insulin release; at a glycemia equal to G* there
corresponds an insulin secretion equal to T
igmax
/2
V
i
[L kgBW
-1
] apparent distribution volume for insulin
τ
g
[min] apparent delay with which the pancreas changes secondary insulin release in
response to varying plasma glucose concentrations
g [#] progressivity with which the pancreas reacts to circulating glucose concentrations.
If g were zero, the pancreas would not react to circulating glucose; if g were 1, the
pancreas would respond according to a Michaelis-Menten dynamics, with G* mM
as the glucose concentration of half-maximal insulin secretion; if g were greater
than 1, the pancreas would respond according to a sigmoidal function, more and
more sharply increasing as g grows larger and larger
I
ΔG
[pM mM
-1
] first-phase insulin concentration increase per mM increase in glucose concentration
at time zero due to the injected bolus
G* [mM] glycemia at which the insulin secretion rate is half of its maximum
Panunzi et al. Theoretical Biology and Medical Modelling 2010, 7:9
/>Page 6 of 20
conditions, as a consequence of the I.V. gluco se bolus. In equation (2), the second term
represents second-phase insulin delivery from the b-cells. Its functional form is consistent
with the hypothesis that insulin production is limited, reaching a maximal rate of release
T
igmax
/V
i
by way of either a Michaelis-Menten dynamics or a sigmoidal shape, according
to whether the g value is 1 or greater than 1 resp ectively. Situations where g is equal to
zero correspond to a lack of response of the pancreas to variations of circulating glucose,
while for g values between zero and 1 the shape of the response resembles a Michaeli s-
Menten, with a sharper curvature towards the asymptote. The parameter g expresses
therefore the cap ability of the pancreas to accelerate its insulin secretion in response to
progressively increasing blood glucose concentrations. The initial condition I
b
+IΔ
G
GΔ
represents the immediate first-phase response of the pancreas to the sudden increment in
glucose plasma concentration. The model is discussed in detail in [13].
From the steady state condition at baseline it follows that:
The index o f insulin sensit ivity is easily derived from this model by applying the
same definition as for the Minimal Model [11], i.e.
(3)
and coincides therefore with one of the model structural parameters to be estimated.
It is expressed in t he same units of measurement as the MM-derived S
I
index (min
-1
pM
-1
) [13].
Insulin Sensitivity determination with the SDM
For each subject the discrete Single Delay Model [13] was fitted to glucose and insuli n
plasma concentrati ons by Generalized Least Squares [17], in order to obtain individual
regression parameters along with an estimate for the glucose and insulin coefficients of
variation. All observations on glucose and insulin were considered in the estimation
procedure except for the basal levels. Coefficients of variation (CV) for glucose and
insulin were estimated in phase 2 of the GLS algorithm, whereas single-subject CVs
for the model parameter estimates were derived fro m the corresponding estimated
asymptotic variance-covariance matrix of the GLS estimators.
Insulin Sensitivity determination with the MM
For the MM, fitting was perfor med by means of a Weighted Least Squares (WLS) esti-
mation procedure, considering as weights the inverses of the squares of the expecta-
tions and as coefficient of variation for glucose 1.5% [14]. Observations on glucose
before 8 minutes from the bolus injection, as well as observations on insulin before the
first peak were disregarded, as suggested by the p roposing Authors [11,18]. A B FGS
quasi-Newton algorithm was used for all optimizations [19]. The insulin sensitivity
index w as computed as the ratio between the MM parameters p
3
and p
2
representing
respectively the scale factor governing the amplitude of insulin action, and the elimina-
tion rate constant of the remote insulin compartment were insulin action takes place.
Panunzi et al. Theoretical Biology and Medical Modelling 2010, 7:9
/>Page 7 of 20
Basal insulin sensitivity measurements and HOMA
Studies conducted in a population of overweight and obese postmenopausal women
[20] and in polycystic ova ry syndrome and menopausal pat ients [21] have demon-
strated that surrogate measures of insulin resistance, as for example the HOMA index,
the fasting insulin, the QUICKY index etc, ar e simple tools, appropriate in large sam-
ple studies, that can b e used as sub stitutes for the EH clamp. In this study the
HOMA, though simplistic and approximate tools for a real assessmen t of insulin sen-
sitivity, was therefore used to perform comparisons and assess coherence among the
model derived indices, as the EHC-derived M was not availab le for most of the evalu-
ated subjects.
The HOMA insulin resistance index was computed as the product of the fasting
values of glucose, expres sed as mM, and insulin, expressed as μIU/mL, divided by the
constant 22.5) [22-24]. Its reciprocal 1/HOMA-IR [25], was used as insulin sensitivity
index. The HOMA2 insulin sensitivity index was obtained by the program HOMA
Calculator v2.2.2 [26].
Statistical analysis
Model fitting was performed using Matlab version 7 (The MathWorks, Inc) whereas
statistical analyses were performed using R (version 2.6.1 Copyright 2007 The R Foun-
dation for Statistical Computing). The entire sample composed of 74 subjects was
divided into four groups: lean subjects (BMI less or equal to 24), overweight subjects
(BMI between 24 and 30), obese (BMI greater than 30 and less or equal to 40) and
morbidly obese subjects (BMI greater than 40). For each parameter of the SDM and
MM the a-posteriori model identifiability was determined by computing the asymptotic
coefficients of variation for the free model parameters: a CV smaller than 52% trans-
lates into a standard error of the parameter smaller than 1/1.96 of its corresponding
point estimate and into an asymptotic normal confidence region of the parameter not
including zero.
One-way ANOVAs were performed to determine if a significant difference arose
among the four groups for the variables K
xgI
,S
I
, 1/HOMA-IR and HOMA2.
The different insulin sensitivity indices were correlated using Pearson’s r coefficient.
A further comparison was made between the insulin sensitivity (M index) assessed
with Euglycemic Hyperinsulinem ic Clamp and either of the two model-derived insulin
sensitivity indices (K
xgI
and S
I
) on the 7 subjects who underwent both IVGTT and
EHC. Given the small numb er of subjects, both the parametric Pearson’ s r correlation
coefficient and the nonparametric Spearman coefficient were computed.
Results
SDM and MM fitting
The two models were both able to satisfactorily fit all the available data sets (but see
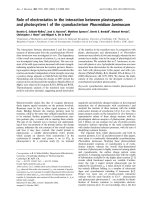
discussion in [13]). Figure 2 shows the experimental data of glucose and insulin con-
centrations as well as the corresponding time course predict ions from the SDM for
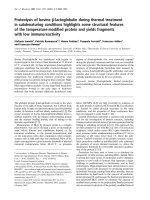
four subjects, each from one of the four different BMI subgroups. Figure 3 shows t he
same four subjects fitted with the MM. In this case only glucose concentrations were
fitted, whereas insulin observations were linearly interpolated as the MM Authors
suggest.
Panunzi et al. Theoretical Biology and Medical Modelling 2010, 7:9
/>Page 8 of 20
Figure 2 Glucose and Insulin observed concentrations (circles) along with their Single Delay Model
time predictions (continuous line) for four subjects belonging to different BMI classes. Panel A: one
subject with BMI ≤ 24, Panel B: one subject with 24 < BMI ≤ 30, Panel C: one subject with 30 < BMI ≤ 40,
Panel D: one subject with BMI > 40
Panunzi et al. Theoretical Biology and Medical Modelling 2010, 7:9
/>Page 9 of 20
Figure 3 Glucose and Insulin observed con centrations (circles) along with the Minimal Model
glucose time predictions and interpolated insulin observations (continuous line) for four subjects
belonging to different BMI classes. Panel A: one subject with BMI ≤ 24, Panel B: one subject with 24 <
BMI ≤ 30, Panel C: one subject with 30 < BMI ≤ 40, Panel D: one subject with BMI > 40.
Panunzi et al. Theoretical Biology and Medical Modelling 2010, 7:9
/>Page 10 of 20
The sensitivity index K
xgI
from the SDM was identifiable (CV < 52%) in 73 out of 74
subjects. For the remaining subject the CV was equal to 68.83% (K
xgI
=2.87×10
-4
).
The sensitivity index S
I
from the MM was not identifiable (CV ≥ 52%) in 36 subjects
out of 74, where coefficients of variation ranged from 52.76% to 2.36 × 10
+9
%. In 18
of these subjects the S
I
estimates were either suspiciously large (from 3.99 to 890 in 11
subjects) or very small (less than or equal to 1.5 × 10
-12
,thesocalled“ zero-S
I
“,in7
subjects).
Comparison between K
xgI
,S
I
, 1/HOMA-IR and HOMA2
The relationship between the four indices was examined by means of the Pearson cor-
relation coefficient. Two situations were examined, either considering the entire 74-
subject sample (the “whole sample”), or considering a sub-sample (the “reduced sub-
sample”) obtained by eliminating those 18 subjects whose S
I
values were extreme (11
very large, > 3; 7 very small, = 1.5 × 10
-12
). The computation of HOMA2 was not per-
formed for 5 subjects whose basal insulin values were below 20 pmol. No of these sub-
jects presented extreme S
I
values.
The correlations between K
xgI
and 1/HOMA-IR and between K
xgI
and HOMA2 were
positive and highly significant both in the whole sample (r = 0.565, P < 0.001 and r =
0.581, P < 0.001 respectively) and in the reduced sub-sample (r = 0.572, P < 0.00 1 and
r = 0.558, P < 0.001 and respectively).
The correlations between S
I
and1/HOMA-IRandbetweenS
I
and HOMA2 were
positive and significa nt (r = 0.525, P < 0.001 and r = 0.454, P = 0.001 respectively)
only when the reduced sub-sample was considered, whereas in the whole sample no
correlation was apparent (r = -0.074, P = 0.529 and r = 0.015, P = 0.904 respectively).
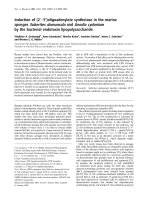
In the reduced sub-sample, where the extreme-S
I
subjects are not considered, corre-
lation between K
xgI
and S
I
was clearly positive and significant (r = 0.864, P < 0.001),
see Panel A of Figure 4. In this reduced sub-sample, absolute values also agreed very
well (mean K
xgI
= 1.07 × 10
-4
vs. mean S
I
= 1.01 × 10
-4
).
TheresultsofaBland-AltmanprocedureonK
xgI
and S
I
are reported in Panel B of
Figure 4. Because of the non-uni formity of the variance (the differences bet ween each
pair of insulin sensitivity indices depend on the values of the computed indices), the
logarithms of the ratios instead of absolute differences are reported o n the ordinates.
The 95% interval around the average mean is reported along with the individual points.
From an inspection of the graph it can be easily seen that, in the sub-sample without
extreme S
I
values, the two methods are equivalent. An equivalent Bland-Altman proce-
dure could not be performed on the whole sample, given the extreme values attained
by the MM-derived S
I
.
Comparison between the four BMI-classes
Table 1 reports the average anthropometric characteristic of the Full sample along with
the mean values over the two samples (the Full Sample a nd the reduced Sub-Sample)
of the four insulin sensitivity indices in the four BMI-identified classes. The ANOVA
analysis among patient groups resulted significant for 1/HOMA-IR, HOMA2 and for
K
xgI
both in the whole sample (P < 0.001 for the K
xgI
, P = 0.002 for the 1/HOMA-IR
and P = 0.001 for the HOMA2) and in the reduced sub-sample (P < 0.001 for the K
xgI
,
P = 0.005 for the 1/HOMA-IR and P = 0.001 for the HOMA2). S
I
was significantly
Panunzi et al. Theoretical Biology and Medical Modelling 2010, 7:9
/>Page 11 of 20
different in the four groups only when the reduced sub-sample was c onsidered (P =
0.006) and not significantly different among groups on the whole sample (P = 0.297).
Figure 5 summarizes the comparison between the average values of S
I
and K
xgI
in the
four BMI patient groups.
Comparison with the EHC results
Only 7 subjects were available in the present series, who also underwent an Euglycemic
Hyperinsulinemic Clamp. On these, a further comparison was performed, given the
widespread opinion that the EHC is the gold standard in the determination of insulin
sensit ivity. Figur e 6 reports the values of the insulin sensitivity assessed with EHC (M
index), along with the two insulin sensitivity indices, K
xgI
and S
I
:thetwomodel-
derived insulin sensitivity indices (K
xgI
and S
I
on the ordinate) are plotted against the
clamp-derived insulin sensitivity M index (on the abscissa). It is to be noticed that
Figure 4 Panel A: scatter plot of the two Insulin Sensitivity Indices from the Single Delay Model
(K
xgI
) and from the Minimal Model (S
I
) on the reduced Sub-Sample obtained eliminating the 18
extreme-S
I
subjects. Panel B: Bland-Altman Procedure; on the abscissas are reported the averages of each
pair of Insulin Sensitivity Indices (one from the Single Delay Model K
xgI
and one from the Minimal Model
S
I
) from the reduced Sub-Sample (obtained eliminating the 18 extreme-S
I
subjects); on the ordinates are
reported the logarithms of the ratios between each subject’sK
xgI
and S
I
.
Panunzi et al. Theoretical Biology and Medical Modelling 2010, 7:9
/>Page 12 of 20
these seven subjects happened to fall within the “ good estimate s” subgroup for the
MM (S
I
CV < 52%). The points show a linear correlation between the two model-
derived indices and the M. Given the small number of available subjects, the non
parametric Spearman index was computed along with the parametric coefficient of
correlation (Pearson’s r). When the non parametric correlation is considered the
P values are not significa nt, even if for the K
xgI
thePvalueisborderline(Spearman’s
Figure 5 Mean values and standard errors for the Insulin Sensitivity Indices from the Single Delay
Model (K
xgI
) and from the Minimal Model (S
I
). For the K
xgI
the average values were computed both in
the Full Sample and in the reduced Sub-Sample. The average values of the S
I
index over the Full Sample
were out of scale for all four groups and could not be plotted. Black bar = K
xgI
in the Full Sample, white
bar = S
I
in the reduced Sub-Sample, striped bar = K
xgI
in the reduced Sub-Sample. Post-Hoc analysis
by LSD test: for the K
xgI
in the Full Sample the significant comparisons were 1 vs 3 (P = 0.001), 1 vs 4
(P < 0.001), 2 vs 4 (0.001) and 3 vs 4 (P = 0.047); for the K
xgI
in the reduced Sub-Sample the significant
comparisons were: 1 vs 3 (P = 0.001), 1 vs 4 (p < 0.001), 2 vs 3 (P = 0.008), 2 vs 4 (P = 0.002); for the S
I
in
the reduced Sub-Sample the significant comparisons were: 1 vs 3 (P = 0.019), 1 vs 4 (P = 0.001), 2 vs 4
(P = 0.016).
Figure 6 Scatter plot of the two Insulin Sensitivity Indices (K
xgI
and S
I
) versus the M clamp-derived
index of insulin sensitivity in seven subjects undergoing both IVGTT and Clamp. Each couple of
points has been labelled with the subject’s BMI. Solid triangles = Single Delay Model K
xgI
, blank squares =
Minimal Model S
I
.
Panunzi et al. Theoretical Biology and Medical Modelling 2010, 7:9
/>Page 13 of 20
rho = 0.75, P = 0.052 for the correlation K
xgI
-M; Spearman’s rho = 0.571, P = 0.181 for
S
I
-M); when the Pearson’s r coefficient is computed both correlations result positive
and significant (Pearson’sr=0.918,P=0.004forK
xgI
and Pearson’s r = 0.832, P =
0.020 for S
I
). A thorough study is clearly nece ssary, involving a larger number of
subjects.
Relationship between the AIR and the K
xgI
In order to evaluate the ability of the SDM to reproduce known physiologic relation-
ships, the Acute Insulin Response (AIR) was computed [27,28] as the ratio of the dif-
ference of estimated initial condition and observed basal insulin (I
Δ
=I
0
-I
b
), over the
first order insulin disappearance rate (AIR = I
Δ
/K
xi
). Figure 7 shows th e scatter plot of
available subjects over the SDM-K
xgI
and Acute Insulin Response plane. A one-way
ANOVA test on AIR, with factor the BMI class, resulted s ignificant (P = 0.001). The
average values in the four classe s were: 5666 ± 4053 for BMI ≥ 24, 7519 ± 5077 for
24 < BMI ≤ 30, 17069 ± 19690 for 30 < B MI ≤ 40 and 22956 ± 15606 f or BMI > 40.
The Disposition Index D
I
(computed as the product between AIR and K
xgI
)resulted
instead not significantly different among the four BMI classes by one-way ANOVA (P
= 0.718, average values: 0.69 ± 0.32 for BMI ≥ 24, 0.68 ± 0.25 for 24 < BMI ≤ 30, 0.76
± 0.44 for 30 < BMI ≤ 40 and 0.61 ± 0.39 for BMI > 40).
A linear regression was also performed to evaluate whether the increase in AIR is
linked to an increase in BMI: the beta coefficient was positive (b = 764) and significant
(P < 0.001).
Discussion
In the quest for simpler and more effective methods to evaluate the degree of sensitiv-
ity to insulin, the Intra-Venous Glucose Tolerance Test (IVGTT) has been proposed as
an alternative to the established, but undoubtedly cumbersome, Euglycemic Hyperinsu-
linemic Clamp (EHC). The IVGTT-generated data, howe ver, need to be interpreted by
fitting onto them a suitable mathematical model: in the choice of the model to be
Figure 7 Relationship between the SDM Insulin Sensitivity Index (K
xgI
) and the Acute Insulin
Response (AIR = I
ΔG
/K
xgI
) in the 74 subjects.
Panunzi et al. Theoretical Biology and Medical Modelling 2010, 7:9
/>Page 14 of 20
applied, the possibility of reliably and precisely estimating an index of insulin sensitivity
should be a major consideration, together with physiological plausibility, if the model is
to be really useful to the diabetological community.
The aim of the present work is to evaluate a recently published model (the Single
Delay Model, SDM) [13] for the glucose and insulin concentrations observed during a
standard IVGTT, by applying it to a heterogeneous population composed of lean, over-
weight, obese and morbidly obese subjects. A further goal is to compare the SDM-
derived insulin sensitivity index K
xgI
with the well known S
I
from the Minim al Model
(MM).
The SDM, as presented in this work and as appeared in previous publications
[13,15], was selected from a group of four two-compartment models, which differed
according to the presence or absence of an insulin-independent glucose elimination
rate term and according to the presence or absence of an explicit delay term for
the action of insulin in stimulating tissue glucose uptake [13].
It is widely accepted that the observed effectiveness of insulin in producing appreci-
able decrease in glycemia lags behind the corresponding increase in insulinemia [28].
Explanations of this phenomenon may include the fact that interstitial insulin, rather
than seru m insulin, is responsible for glucose disappearance. The delay in the appear-
ance of the insulin effect, besides being produced by the progressive (rather than
instantaneous) lowering of glucose by tissues when stimulated by the hormone, may
also depend on a specific delay of insulin action on those tissues. This delay in tissue
insulin stimulation (which could stem from insulin distribution from plasma into inter-
stitial space) can be mathematically represented by using either an unknown quantity
(a further state variable representing an intermediate compartment, as in the MM, or
even by a chain of similar added compartments) or by incor porating an explicit delay
(discrete, distributed, etc.) in the action of serum insulin (which has to be transferred
to the interstitium before exerting its effects). This last mathematical formulation
allows the experimental assessment of whether such delay is indeed significantly differ-
ent from zero, or whether it is relatively small and therefore practically negligible for
data fitting. In fact, there is little doubt as to the fact that insulin needs to be trans-
ferred from plasm a to, say, muscle cell surface, in o rder to produc e its actio n. On the
other hand, the actual t ime needed for this to happen may w ell be relatively small (if
we think, for instance, that recirculation time is of the order of 1 minutes, including
passage through both peripheral and lung capillaries, compared with the relatively long
delay in l owering glycemia (which may be appreciated in tens of minutes). The com-
parison of models conducted in order to select the final form of the SDM showed that
no explicit delay term was necessary for fitting available IVGTT data, which does not
mean, as discussed before, that a delay does not exist.
The same can be said regarding the lack of a “glucose effectiveness term” ,i.e.ofa
first-order, insulin-independent tissue gluc ose uptake term. There appears in fact to be
no normal physiol ogical mechanism to suppo rt first-order glucose elimination from
plasma: tissues in the body, except for brain, do not take up glucose irrespective of
insulin; brain glucose consumption is relatively constant, and is subsumed, for the pur-
poses of the present model, in the constant (zero-order) net hepatic glucose output
term . A mass effect could indeed exist in the case when glycemias are above the renal
threshold, where urinary glucose eliminati on, roughly proportional to above-threshold
Panunzi et al. Theoretical Biology and Medical Modelling 2010, 7:9
/>Page 15 of 20
glycemias, is observed; and in the case when diffusion of glucose between compart-
ments takes place. It must be emphasized that none of the subjects studied exhibited
sustained, above-renal -threshold glycemias and that the rate of transfer attributable to
plasma/interstitium equilibration (given again the observed circulation time of about
two minutes) is much faster than what would be needed for insulin-independent tissu e
glucose uptake to contribute to the observed glycemia time course (with variations in
the order of half-hours). A further substantial observation, against compartment equili-
bration playing a major role, is the estimated value of the volume of distribution for
glucose, around 0.16 L/KgBW, comprising therefore interstitial water together with
plasma volume. For all these reasons it would seem that no actual physiological
mechanism would support the inclusion of an insulin-independent tissue glucose
uptake term for the purpose of modeling the present series o f subjects. It was in fact
observed that, even if such a first-order mechanism were indeed present, its explicit
representation did not prove necessary for the acceptable fitting of the present data
series.
In future analyses it may however well be necessary to reintroduce insulin action
delay or first order insulin-independent glucose uptake or both to explain observations
under different conditions.
In the present series the two indices were compared also with the 1/HOMA-IR, the
HOMA2 and (over a subsample) with the clamp-derived “ M” index of insulin
sensitivity.
The first result of the present assessmentisthatwhilein50%ofthesubjects,the
MM-derived S
I
is not significantly different from zero, and while several subjects exhi-
bit questionably large or small S
I
values, the SDM-derived index of insulin sensitivity,
K
xgI
, exhibits estimates with coefficient of variation less than 52% in every subject
except one (whose estimated CV is in any case 69%) and with act ual values covering a
reasonable range (1.25 × 10
-5
to 4.36 × 10
-4
).
This result points to a marked degree o f variability in the estimation of the para-
meters of the MM, compared with a very good numerical stability in the c orrespond-
ing estimation of t he SDM parameters. The instability of the S
I
index appears clearly
also when considering correlation with the HOMA i ndices: it runs out when extreme
S
I
values are considered, while it still persists between HOMA and K
xgI
.Reasonsfor
this different behaviour have been discussed elsewhere [13], and can be summarised as
a mathematical formulat ion more respectful of physi ologic al understanding, of a smal-
ler number of free parameters (the SDM is in fact more “ minimal” than the MM
because it fits both glycemias and insulinemias simultaneously using six free para-
meter s instead of at least eight for the MM, having therefore a large r ratio of observa-
tions to estimable parameters), and in the avoidance of the statistically incorrect
procedure of assuming interpolated noisy insulin concentrations as the true forcing
function for glucose kinetics. Figures 2 and 3 show the performance of the two models
in terms of their ability to describe the observed data. T he apparent better fit of the
Minimal Model is discussed at a great level of detail in [13]. Briefly, by using interpo-
lated noisy observations as model input, the Minimal Model exploits the random varia-
tions of a single realization of the insulin kinetics to adapt coefficients in order to
retrieve observed characteristics of the time course of glycemia. When fitting simulta-
neously glycemias and insulinemias, the Minimal Model (integrating Toffolo’s[18]
Panunzi et al. Theoretical Biology and Medical Modelling 2010, 7:9
/>Page 16 of 20
equation with the Bergman’s original equations [11], see for example [14]) loses its
ability to do so, fits more poorly t han the SDM, and in fact loses the ability to repro-
duce the secondary insulin secretion phase ‘hump’. Notice that in Figure 2 both insulin
and glucose equations are fitted onto the data, while in figure 3 the insulin data are
merely linearly interpolated. Finally, while the close adaptation to the data is cer tainly
an imp ortant requisite of a good model, it is certainly not the primary consideration. If
it were so, then polynomial or spline approximations would systematically outperform
mechanistic models. The point is to find a simple mechanistic model, whose elements
have a direct biological meaning, which closely fits available data, and the qualitative
behaviour of whose solutions is compatible with physiology. For a critique to the Mini-
mal Model from this point of view see [29].
There remains however the concern that, whatever the sophistication o f the model,
the well-known variability of insulin clearance makes it so that no insulin secretion
analysis based on insulin levels alone can be expected to be fully accurate. It would be
helpful to validate the results obtained for insulin secretion from the SDM against
some gold standard indices of insulin secretion: indices based on C peptide measure-
ment and the reconstruction of prehepatic insulin profiles could in fact be a possible
candidate. However, not only the present data series, available to us, did not include
C-peptide measurements for all 74 subjects, but the very deconvolution methods pro-
posed so far in the literature to address this issue rely, themselves, on ad-hoc assump-
tions: one such being, e.g., the threshold based identification of the number of peaks
from noisy C-peptide observed concentrations [30]. This problem deserves further
study.
Even without considering the possibl e fitting of insulin obser vations to obtain infor-
mation about the pancreatic response to circulating glucose, and limiting therefore the
discussion to the estimation of insulin sensitivity by fitting glycemias, there are some
problems in the standard appr oach. One is the phenomenon of the “zero-S
I
” [12], but
even more important from a practical viewpoint is the large fraction of extreme esti-
mates of the S
I
(18 out of 74, or 24.3% in the present series) and more generally of
estimates of S
I
whose confidence interval contains zero, and to which therefore no
meaningful estimate can be attributed (about 50% in the present series). Several recent
publications [31-33] have addressed the improvement of estimation methods for the
Minimal Model. The contention in the present work is that once the model itself is
improved, then standard estimation methods are sufficient to obtain precise estimates.
Furthermore, better estimation procedures, bayesian approaches, or population meth-
ods could be used for any model, for the SDM as well as for the Minimal Model.
The second result of the present work concerns the physiological correctness of the
obtained estimates. While, in principle, estimates could be precise but biased, this in
fact does not seem to be the case for the K
xgI
index as shown by the actual range of
values, by t he correlation with the 1/HOMA-IR and HOMA2 indices, by the correla-
tion with the M index from the EHC, and by the very correlation with the S
I
,when
questionable S
I
values are excluded. In fact, when excluding the 18 extreme S
I
values,
the correlation S
I
-K
xgI
is very high and significant, and furthermore the Bland and Alt-
man procedure shows the two measures to be equivalent.
While the S
I
suffers from the presence of questionable and extreme values, the K
xgI
correlates uniform ly, and better than the S
I
, with the 1/HOMA-IR, HOMA2 and with
Panunzi et al. Theoretical Biology and Medical Modelling 2010, 7:9
/>Page 17 of 20
the clamp-deri ved M-index over all available subjects. The limited size of the available
sample of subjects who underwent both clamp and IVGTT does however r epresent a
limitation of the present study, which should be addressed in the future by applying
the SDM to other series of subjects simultaneously studied with both EHC and
IVGTT.
The performance of the K
xgI
index has also been tested with regards to its ability of
reproducing the well-known existing relationship between insulin resistance and body
mass index. This is clearly visible in Table 1, where the considered population has
been divided into four BMI subpopulations. Table 1 shows that increasing BMI is
accompanied by a gradual decrease in insulin sensitivity, as estimated by either 1/
HOMA-IR and HOM A2 or K
xgI
(in the full sample) or by S
I
(in the reduced sample
only). The ANOVAs performed on the K
xgI
and on the 1/HOMA-IR and HOMA2
highlight significant differences of insulin sensitivity among the four classes. This result
isobtainedbothinthefullandinthereducedsamples.FortheS
I
the ANOVA
resulted significant only when the reduced sub-sample is considered.
The lack of correlation of any insulin sensitiv ity index with the HOMA at extremes
of insulin sensitivity may in fact reflect a limit of validity of HOMA in these ranges of
insulin sensitivity values. Since the accuracy of HOMA mostly relies on t he ability of
fasting insulin to mirror insulin resistance, in the extreme insulin sensitivity ranges
(high or low, e.g. athletes and T2DM subjects) the overall approximately hyperbolic
relationship of HOMA and ins ulin sensitivity appears as a (respectively horizontal and
vertical) asymptote, and correlation between insulin sensitivity and HOMA in both
extreme ranges is lost. If this were the explanation of the lack of correlation of the
HOMA with the S
I
, such lack should be apparent also between HOMA and K
xgI
,
which is not the case, the values of correlation between HOMA and K
xgI
being essen-
tially the same whet her including or excl uding the extreme ranges. The facts that this
behaviour is the same both for the HOMA and for the newer and more accurate
HOMA2, and that the large variability of SI index values would in any case produce
lack of correlation by itself, lead us to hypothesize that the cause of the lack of correla-
tion of the S
I
with the HOMA is essentially due to unreliable estimation of the S
I
itself.
The increase in AIR with increasing BMI is consistent with the current consensus. In
non-dia betic subjects, fasting i nsulin secretion increases with BMI in an approximately
linear fashion [34]. Similar results are obtained after an oral load of 75 g of glucose
where total insulin output over the 2 h following ingestion increases in linear propor-
tion with BMI [34]. It is also well known that there is a hyperbolic relationship
between early insulin secretion, measured e.g. by the Acute Insulin Response (AIR)
index, and insulin action, as expressed by an insulin sensitivity index, which, in the
present case, is the model parameter K
xgI
.
This hyperbolic relationship of AIR w ith insulin sensitivity is well reproduced using
the obtained SDM parameter estimates (the corresponding graph based on the full
sample of S
I
estimates is not shown, given the extreme values which the S
I
index takes
in some subjects). While not offering anything new from the physiological v iewpoint,
the confirmation of this relationship gives further support to the stability and meaning-
fulness not only of the insulin sensitivity index K
xgI
, but also of other SDM parameters,
the AIR index being obtained in this case by the model-estimated I
ΔG
and K
xi
.
Panunzi et al. Theoretical Biology and Medical Modelling 2010, 7:9
/>Page 18 of 20
The observation that no significant relationship exists between the Disposition Index
and BMI indicates that in the present series no progression of disease is apparent, in
the sense that all subjects, whatever their body composition, seemed adequately
compensated.
Conclusions
The present model i s obviously not supposed to describe a ll possible mechanisms
intervening in the fate of secret ed insulin and glucose uptake, but intends, in the pre-
sent form, to relate peripheral serum insulin concentrations (an index of the actual
insulin concentrations in interstitium, portal system, target tissues etc.) to observed
glucose kinetics. Its purpose is exactly the same as that of the original Minimal Model,
i.e. to provide the diabetologist with a simple mathematical way to interpret the
IVGTT, and the contention made here is th at the new model improves our ability to
compute a robust, precise index of insulin sensitivity.
Author details
1
CNR-Institute of Systems Analysis and Computer Science (IASI), BioMathLab, Rome, Italy.
2
Department of Internal
Medicine, Catholic University, School of Medicine, Rome, Italy.
Authors’ contributions
SP: mathematical modelling and model computation, statistical analysis, drafting of the manuscript; ADG:
mathematical modeling, drafting of the manuscript; GM: drafting of the manuscript; data provision; All authors read
and approved the final manuscript.
Competing interests
The authors declare that they have no competing interests.
Received: 18 June 2009 Accepted: 18 March 2010 Published: 18 March 2010
References
1. Groop LC: Insulin resistance: the fundamental trigger of type 2 diabetes. Diabetes Obes Metab 1999, 1:S1-S7.
2. Mahler R, Adler M: Clinical review 102: Type 2 diabetes mellitus: update on diagnosis, pathophysiology, and
treatment. J Clin Endocrinol Metab 1999, 84:1165-1171.
3. Fontbonne A, Eschwege E: Insulin and cardiovascular disease: Paris prospective study. Diabetes Care 1991,
14:461-469.
4. Ferrannini E, Buzzigoli G, Bonadonna R, Giorico M, Oleggini M, Graziadei L, et al: Insulin resistance in essential
hypertension. N Engl J Med 1987, 317:350-357.
5. Després J, Lamarche B, Mauriège P, Cantin B, Dagenais G, Moorjani S, et al: Hyperinsulinemia as an Independent Risk
Factor for Ischemic Heart Disease. N Engl J Med 1996, 334:952-958.
6. Kincaid-Smith P: Hypothesis: obesity and the insulin resistance syndrome play a major role in end-stage renal
failure attributed to hypertension and labelled ‘hypertensive nephrosclerosis’. J Hypertens 2004, 22:1051-1055.
7. Farrell G, Larter C: Nonalcoholic fatty liver disease: from steatosis to cirrhosis. Hepatology 2006, 43:S99-S112.
8. Meigs G: Epidemiology of the insulin resistance syndrome. Curr Diab Rep 2003, 3:73-79.
9. Peter P, Nuttall S, Kendall M: Insulin resistance–the new goal! J Clin Pharm Ther 2003, 28:167-174.
10. Ferrannini E, Natali A, Bell P, Cavallo Perin P, Lalic N, Mingrone G: Insulin resistance and hypersecretion in obesity.
European Group for the Study of Insulin Resistance (EGIR). J Clin Invest 1997, 100:1166-1173.
11. Bergman RN, Ider YZ, Bowden CR, Cobelli C: Quantitative estimation of insulin sensitivity. Am J Physiol 1979, 236:
E667-E677.
12. Ni TC, Ader M, Bergman EN: Reassessment of glucose effectiveness and insulin sensitivity from minimal model
analysis: a theoretical evaluation of the single-compartment glucose distribution assumption. Diabetes 1997,
46:1813-1821.
13. Panunzi S, Palumbo P, De Gaetano A: A discrete Single Delay Model for the Intra-Venous Glucose Tolerance Test.
Theoretical Biology and Medical Modelling 2007, 4.
14. Pacini G, Bergman RN: MINMOD: a computer program to calculate insulin sensitivity and pancreatic responsivity
from the frequently sampled intravenous glucose tolerance test. Comput Methods Programs Biomed 1986,
23:113-122.
15. Palumbo P, Panunzi S, De Gaetano A: Qualitative behavior of a family of delay-differential models of the glucose-
insulin system. Discrete and Continuous Dynamical Systems - Series B 2007, 7:399-424.
16. Defronzo RA, Tobin JD, Andres R: Glucose clamp technique: a method for quantifying insulin secretion and
resistance. Am J Physiol 1979, 237:E214-E223.
17. Davidian M, Giltinan DM: Nonlinear Models for Repeated Measurement Data 1995.
18. Toffolo G, Bergman RN, Finegood DT, Bowden CR, Cobelli C: Quantitative estimation of beta cell sensitivity to
glucose in the intact organism: a minimal model of insulin kinetics in the dog. Diabetes 1980, 29:979-990.
Panunzi et al. Theoretical Biology and Medical Modelling 2010, 7:9
/>Page 19 of 20
19. Press WH, Flannery BP, Teukolsky SA, Vetterling WT: Numerical recipes in C. The art of scientific computing Cambridge:
Cambridge University Press, 2 1994.
20. Malita F, Karelis A, St-Pierre D, Garrel D, Bastard J, Tardif A, et al: Surrogate indexes vs. euglycaemic-hyperinsulinemic
clamp as an indicator of insulin resistance and cardiovascular risk factors in overweight and obese
postmenopausal women. Diabetes & Metabolism 2006, 32:251-255.
21. Ciampelli M, Leoni F, Cucinelli F, Mancuso S, Panunzi S, De Gaetano A, et al: Assessment of insulin sensitivity from
measurements in the fasting state and during an oral glucose tolerance test in polycystic ovary syndrome and
menopausal patients. J Clin Endocrinol Metab 2005, 90:1398-1406.
22. Matthews DR, Hosker JP, Rudenski AS, Naylor BA, Treacher DF, Turner RC: Homeostasis model assessment: insulin
resistance and beta-cell function from fasting plasma glucose and insulin concentrations in man. Diabetologia
1985, 28:412-419.
23. Emoto M, Nishizawa Y, Maekawa K, Hiura Y, Kanda H, Kawagishi T, et al: Homeostasis model assessment as a clinical
index of insulin resistance in type 2 diabetic patients treated with sulfonylureas. Diabetes Care 1999, 22:818-822.
24. Bonora E, Targher G, Alberiche M, Bonadonna R, Saggiani F, Zenere MB, et al: Homeostasis model assessment closely
mirrors the glucose clamp technique in the assessment of insulin sensitivity: studies in subjects with various
degrees of glucose tolerance and insulin sensitivity. Diabetes Care 2000, 23:57-63.
25. Yokoyama H, Emoto M, Fujiwara S, Motoyama K, Morioka T, Komatsu M, et al: Quantitative Insulin Sensitivity Check
Index and the Reciprocal Index of Homeostasis Model Assessment in Normal Range Weight and Moderately
Obese Type 2 Diabetic Patients. Diabetes Care 2003, 26:2426-2432.
26. HOMA Calculator. The Oxford Centre for Diabetes Endocrinology & Metabolism Diabetes Trial Unit 2009.
27. Kahn SE, Prigeon RL, McCulloch DK, Boyco EJ, Bergman RN, Schwartz MW, et al: Quantification of the relationship
between insulin sensitivity and b-cell function in human subjects. Diabetes 1993, 42:1663-1672.
28. Bergman RN: Lilly lecture 1989. Toward physiological understanding of glucose tolerance. Minimal-model
approach. Diabetes 1989, 38:1512-1527.
29. De Gaetano A, Arino O: Mathematical modelling of the intravenous glucose tolerance test. J Math Biol 2000,
40:136-168.
30. Van Cauter E: Estimating false-positive and false-negative errors in analyses of hormonal pulsatility. American
Journal of Physiology-Endocrinology and Metabolism 1988, 254:E786-E794.
31. Cobelli C, Caumo A, Omenetto M: Minimal model SG overestimation and SI underestimation: improved accuracy by
a Bayesian two-compartment model. Am J Physiol Endocrinol Metab 1999, 277:481-488.
32. Pillonetto G, Caumo A, Sparacino G, Cobelli C: A new dynamic index of insulin sensitivity. Ieee Transactions on
Biomedical Engineering
2006, 53:369-379.
33. Pillonetto G, Sparacino G, Cobelli C: Numerical non-identifiability regions of the minimal model of glucose kinetics:
superiority of Bayesian estimation. Math Biosci 2003, 184:53-67.
34. Ferrannini E, Camastra S, Gastaldelli A, Sironi A, Natali A, Muscelli E, et al: Beta-Cell Function in Obesity. Effects of
Weight Loss. Diabetes 2004, 53:S26-S33.
doi:10.1186/1742-4682-7-9
Cite this article as: Panunzi et al.: Advantages of the single delay model for the assessment of insulin sensitivity
from the intravenous glucose tolerance test. Theoretical Biology and Medical Modelling 2010 7:9.
Submit your next manuscript to BioMed Central
and take full advantage of:
• Convenient online submission
• Thorough peer review
• No space constraints or color figure charges
• Immediate publication on acceptance
• Inclusion in PubMed, CAS, Scopus and Google Scholar
• Research which is freely available for redistribution
Submit your manuscript at
www.biomedcentral.com/submit
Panunzi et al. Theoretical Biology and Medical Modelling 2010, 7:9
/>Page 20 of 20