An analysis of the Patents Granted to the University of Arkansas
Bạn đang xem bản rút gọn của tài liệu. Xem và tải ngay bản đầy đủ của tài liệu tại đây (437.26 KB, 8 trang )
University of Arkansas, Fayetteville
ScholarWorks@UARK
University Libraries Faculty Publications and
Presentations
University Libraries
4-2021
An analysis of the Patents Granted to the University of Arkansas,
Fayetteville, 2010-2019
Lutishoor Salisbury
Jeremy S. Smith
Tian Yang
Follow this and additional works at: />Part of the Information Literacy Commons, and the Scholarly Publishing Commons
An Analysis of the Patents Granted to the University of Arkansas, Fayetteville, 2010-2019
Background
The Chemistry and Biochemistry Library compiled a database of patents granted to the
University of Arkansas that has an assignee with at least one of its inventors from the
Fayetteville campus. This database is continuously updated to incorporate the new patents as
they are granted.
To access this database please follow this link: />
Objective
This report provides an analysis of the patents in this database that were granted for ten years
(2010-2019) where at least one of the inventors was affiliated with a department or college from
the University of Arkansas in Fayetteville. It identifies (a) the number of patents with inventors
from the various departments; (b) the number of unique inventors in each department; and (3)
the college affiliations of the inventors; their inter- and extra-collegiate collaborators from
campus and their off-campus campus collaborators.
Results of the Analyses
(a)
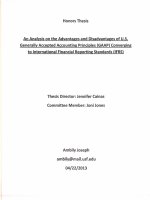
Patents Granted by Year
An average of 17.3 patents/year were granted for the last 10 years. Fig. 1 shows this
information.
2
No. of Patents: 173
30
27
23
No of Patents
25
20
15
11
13
15
16
2012
2013
21
18
15
14
10
5
0
2010
2011
2014
2015
2016
2017
2018
2019
Years
(b) Patents by Departmental Affiliation and Unique Inventors
(1) Pattens Issues by Departmental Affiliation
Fig. 2 shows the number of inventors from 18 departments, mostly in engineering,
agricultural and the sciences, that contributed to the 173 patents for this period. The
top five departments with inventors on patents are: 20 percent from the Department of
Crops, Soils and Environmental Science; 17.3 percent from the Department of Chemistry
and Biochemistry; 14.45 percent from the Department of Horticulture, 12.13 percent
from the Department of Poultry Science and 12 percent from the Department of Food
Science and Technology.
3
Fig. 2: No. of Patents/Unique Inventors per
Departmental Affiliation
40
Patents
34
35
Unique Authors
30
Count
30
25
25
20
15
10
5
ANSC
BAEG
18
15 15
9
14
3
54
12
5
CHBC
21
18
20
12
10 10
9
8
4
21
5
3
8
5
22
4
6
32
BISC
BMEG
CEMB
CHEG
CSES
CSCE
11
0
Departments
(2) Unique No. of Inventors by Departmental Affiliation
ELEG
FDSC
HORT
MEEG
NANO
PHYS
PLPA
POSC
RREC
Legend
Animal Science
Biological and
Agricultural Engineering
Biological Sciences
Biomedical Engineering
Cell and Molecular
Biology
Chemistry and
Biochemistry
Chemical Engineering
Crop, Soil, and
Environmental Sciences
Computer Science and
Computer Engr.
Electrical Engineering
Food Science
Horticulture
Mechanical Engineering
Nanotechnology
Physics
Plant Pathology
Poultry Science
Rice Research Extension
Center
The top Departments with the largest number of unique inventors on
the patents are: Crops, Soils and Environmental Science with 21 inventors, followed by
Poultry Science and Chemistry and Biochemistry with 18 inventors each; then electrical
engineering and food science with 10 inventors each (Fig. 2).
The contributions of the unique inventors are not uniform across the departments. In
almost all the departments, a few inventors contributed to many of the patents. For
example, the Horticultural Department has inventors on 25 patents with one inventor listed
on 92 percent (n=23) of them and another one contributed to 44 percent (n=11) of them;
Animal science has inventors on 9 patents with one inventor contributing 66.7 percent (n=6)
; Biological and Agricultural Engineering has 15 patents, one inventor contributing to 40
percent of them and other one to 33.3 percent; Biological Sciences has inventors on 15
patents with one inventor contributing to 80 percent (n=12) of them; The Department of
Chemical Engineering has inventors on 14 patents, with one inventor contributing to 64.3
percent (n=9) of the patents; Poultry Science has 21 patents, with one inventor listed on
85.7 percent (n=18) of them and another inventor listed on 52.4 Percent (n=11) of them.
etc.
4
(d) Inventors According to College Association and Collaboration
Figure 3 shows the inter-college associations and extra-college collaborations of the patents
that were granted during this period. For explanation of the bubbles: The College of
Engineering has inventors on 50 patents. These inventors collaborated on 8 patents with
inventors from the College of Arts and Sciences and on 3 patents with inventors from
the Dale Bumpers College of Agriculture, Food and Life Sciences. They also have 13 interdepartmental collaborators on patents within the college. The College of Engineering has
the most inter-collegiate collaborations on 11 patents.
Fig. 3: Inter-College Networks of Inventors
Explanation:
Circles represent Colleges/Schools/Units
Numbers in Red represent the number of patents with at least one inventor associated with
the college.
Numbers in Blue represent the number of Inter-departmental collaborations within the
college.
5
Lines represent collaboration between Colleges.
Numbers in Black represent the number of patents with at least one inventor associated
with each college.
(e) Inter-departmental Cooperation of Patents Granted
The intra- and inter- departmental collaborations are visualized below in Fig 4. The top five
departments with the highest collaborations are: FDSC and BISC with 6 networks each,
followed by CHBC, CSES and BAEG with 4 each, POSC, ANSC, BMEG with 3 each and HORT
and PHYS with 2 each.
Fig. 4: Intra- and Inter- Departmental Collaboration on
Patents
Legend:
AAES Dark Orchid
AFLS Cadet Blue
ARSC Cyan3
ENGR Coral
GRAD Forest Green
CRU
Gold
6
Explanation:
Circles represent Departments.
Numbers in within each circle represent the number of patents with at least one inventor
associated with the department.
Lines represent collaboration between Departments.
Numbers in Black represent the number of patents with at least one inventor associated
with each department.
Outside Collaborators by Departmental Affilations
Of the 173 patents that have the University of Arkansas as an assignee, twenty five percent
(n=43) of them have 20 unique co-assignees. These co-assignees were used to identify the
extent that the university’s patenting activities is collaborative outside the university. The coassignees comprised of 7 educational institutions, 3 medically related institutions, 9 corporate
institutions and 1 government institution.
Seventy two percent (n=31 patents) of the external co-assignees are from institutions within the
United States; twenty one percent (n=9) of the patents have co-assignees within Arkansas with 8
of those from assignees within Northwest Arkansas where the university is located; seventy
percent (n=30) of the patents have co-assignees also from 8 other states in the USA (CO, DC, LA,
MA, NY. PA, SC, and TX); TX having the largest number of co-assignees on 11 of the patents. In
addition, 7 of the patents have additional assignees from outside the United States including
Japan (n=9); Denmark (n=2); Germany (n=1) and Canada (n=1). The extent of collaborators by
departmental affiliation are shown below.
7
Compiled by
Lutishoor Salisbury, Jeremy S. Smith and Tian Yang
CHBC Library
April 2021
8