Aircraft measurements over Europe of an air pollution plume from Southeast Asia – aerosol and chemical characterization pot
Bạn đang xem bản rút gọn của tài liệu. Xem và tải ngay bản đầy đủ của tài liệu tại đây (7.98 MB, 25 trang )
Atmos. Chem. Phys., 7, 913–937, 2007
www.atmos-chem-phys.net/7/913/2007/
© Author(s) 2007. This work is licensed
under a Creative Commons License.
Atmospheric
Chemistry
and Physics
Aircraft measurements over Europe of an air pollution plume from
Southeast Asia – aerosol and chemical characterization
A. Stohl1 , C. Forster1, 2 , H. Huntrieser2 , H. Mannstein2 , W. W. McMillan3 , A. Petzold2 , H. Schlager2 , and
B. Weinzierl2
1 Norwegian
Institute for Air Research, Kjeller, Norway
fă r Physik der Atmosphă re, Deutsches Zentrum fă r Luft- und Raumfahrt (DLR), Oberpfaffenhofen, Germany
u
a
u
3 University of Maryland, Baltimore, USA
2 Institut
Received: 13 November 2006 – Published in Atmos. Chem. Phys. Discuss.: 5 December 2006
Revised: 2 February 2007 – Accepted: 14 February 2007 – Published: 16 February 2007
Abstract. An air pollution plume from Southern and Eastern Asia, including regions in India and China, was predicted
by the FLEXPART particle dispersion model to arrive in the
upper troposphere over Europe on 24–25 March 2006. According to the model, the plume was exported from Southeast Asia six days earlier, transported into the upper troposphere by a warm conveyor belt, and travelled to Europe
in a fast zonal flow. This is confirmed by the retrievals of
carbon monoxide (CO) from AIRS satellite measurements,
which are in excellent agreement with the model results over
the entire transport history. The research aircraft DLR Falcon was sent into this plume west of Spain on 24 March
and over Southern Europe on 25 March. On both days, the
pollution plume was found close to the predicted locations
and, thus, the measurements taken allowed the first detailed
characterization of the aerosol content and chemical composition of an anthropogenic pollution plume after a nearly
hemispheric transport event. The mixing ratios of CO, reactive nitrogen (NOy ) and ozone (O3 ) measured in the Asian
plume were all clearly elevated over a background that was
itself likely elevated by Asian emissions: CO by 17–34 ppbv
on average (maximum 60 ppbv) and O3 by 2–9 ppbv (maximum 22 ppbv). Positive correlations existed between these
species, and a O3 / CO slope of 0.25 shows that ozone
was formed in this plume, albeit with moderate efficiency.
Nucleation mode and Aitken particles were suppressed in
the Asian plume, whereas accumulation mode aerosols were
strongly elevated and correlated with CO. The suppression of
the nucleation mode was likely due to the large pre-existing
aerosol surface of the transported larger particles. Supermicron particles, likely desert dust, were found in part of
the Asian pollution plume and also in surrounding cleaner
air. The aerosol light absorption coefficient was enhanced in
the plume (average values for individual plume encounters
Correspondence to: A. Stohl
()
0.25–0.70 Mm−1 ), as was the fraction of non-volatile Aitken
particles. This indicates that black carbon (BC) was an important aerosol component. During the flight on 25 March,
which took place on the rear of a trough located over Europe,
a mixture of Asian pollution and stratospheric air was found.
Asian pollution was mixing into the lower stratosphere, and
stratospheric air was mixing into the pollution plume in the
troposphere. Turbulence was encountered by the aircraft in
the mixing regions, where the thermal stability was low and
Richardson numbers were below 0.2. The result of the mixing can clearly be seen in the trace gas data, which are following mixing lines in correlation plots. This mixing with
stratospheric air is likely very typical of Asian air pollution,
which is often lifted to the upper troposphere and, thus, transported in the vicinity of stratospheric air.
1
Introduction
Recently, intercontinental transport of air pollutants has been
recognized as an important process affecting the atmospheric
chemical composition. Speculations on its relevance were
made early (e.g. Andreae et al., 1988) but the first unambiguous examples based on observations were published by Jaffe
et al. (1999) for transport from Asia to North America, and
by Stohl and Trickl (1999) for transport from North America to Europe. Since these studies, the number of articles
documenting the phenomenon and evaluating its impact on
ozone and aerosol concentrations goes into the dozens (e.g.
Berntsen et al., 1999; Jacob et al., 1999; Wild and Akimoto,
2001; Li et al., 2002; Stohl et al., 2003; Traub et al., 2003;
Hudman et al., 2004; Price et al., 2004; Huntrieser et al.,
2005; Auvray and Bey, 2005). The relevant transport processes have been identified and, for pollution export from
Asia and North America, often involve lifting to the upper
troposphere by so-called warm conveyor belts (WCBs) at the
eastern seaboards and subsequent transport by fast airstreams
Published by Copernicus GmbH on behalf of the European Geosciences Union.
914
in the middle or upper troposphere (Stohl, 2001; Stohl et al.,
2002a). The study by Stohl and Trickl (1999) is a textbook
example for this process. In addition, deep convection in
thunderstorms or mesoscale convective complexes is also important in summer (Wild and Akimoto, 2001).
Much of our current understanding of the impact of intercontinental air pollution transport on the chemical composition of the atmosphere is based on the results of model
studies (e.g. Wild and Akimoto, 2001; Li et al., 2002). Observational studies are relatively less numerous but a number
of transport events have been described recently (see, e.g.,
articles in the book by Stohl, 2004). The models are in broad
consensus with the observations but their validity for hemispheric transport distances is still uncertain. Another problematic issue with the transport over such long distances is
that the mixing of pollution plumes with other air masses
becomes important and probably dominant. For instance,
mixing of Asian pollution with stratospheric air can occur
even before such a plume reaches North America (Cooper et
al., 2004a,b). Trickl et al. (2003) observed dry ozone-rich
air masses to arrive over Europe, which originated from beyond North America but because of mixing they could not
say how much of the ozone was produced in Asian pollution
plumes and how much was transported from the stratosphere.
The accuracy of global models will depend to a large extent
on how well they can treat the mixing between different air
masses.
Recently, a so-called Task Force on Hemispheric Transport of Air Pollution ( was founded by
the United Nations Economic Commission for Europe (UNECE) under the Convention on Long-range Transboundary
Air Pollution, and international partner organisations. This
Task Force shall further our understanding of hemisphericscale air pollution transport and explore its implications for
environmental policies. This can be achieved only through
the extensive use of chemistry transport models and climate
chemistry models. Yet, observations of truly hemisphericscale transport events, which must serve as the ultimate
benchmarks for the models, are lacking. For instance, we
are not aware of a study describing the transport of an anthropogenic air pollution plume from Asia across the North
Pacific, North America, and the North Atlantic to Europe,
despite the fact that model calculations suggest a substantial
impact of Asian emissions on carbon monoxide (e.g. Pfister
et al., 2004) and ozone levels (e.g. Auvray and Bey, 2005)
over Europe. Asian pollution over Europe has only been
documented after taking the alternative shorter but presumably less important pathway involving westward transport
with the monsoon circulation from India to Africa and the
Mediterranean (Lelieveld et al., 2002; Lawrence et al., 2003;
Traub et al., 2003). Regarding transport with the westerlies,
Damoah et al. (2004) reported a case where a smoke plume
originating from boreal forest fires burning in Siberia was
transported across North America to Europe. The transport
of the smoke was clearly visible in satellite imagery and,
Atmos. Chem. Phys., 7, 913–937, 2007
A. Stohl et al.: Asian pollution over Europe
thus, the source attribution was relatively straightforward.
Grousset et al. (2003) reported a likely case of dust transport
from Asia to Europe, again a case with a rather unique signature. Pollution produced by fossil fuel combustion (FFC)
in Asia is more difficult to detect over Europe because the
concentrations involved are typically lower and, thus, such
plumes cannot easily be tracked from space.
As a result of the strong lifting of polluted air masses at
the eastern seaboard of Asia, the biggest chance of successfully identifying such a pollution plume over Europe is in
the upper troposphere (Wild and Akimoto, 2001; Stohl et al.,
2002a), requiring measurements with an aircraft. However,
current models accumulate considerable errors over hemispheric transport distances and, thus, guiding a research aircraft into such a plume still poses a major challenge for modelers. In this paper, we present the first unambiguous observation of transport of FFC emissions from Southeast Asia via
the westerlies to Europe. We describe how the Asian pollution plume was targeted over Europe with a research aircraft
and characterize its chemical composition and aerosol content.
2
Methods
2.1 Instrumentation
We used the DLR (Deutsches Zentrum fă r Luft- und Raumu
fahrt) research aircraft Falcon with an extensive instrumentation for in situ measurements of trace gases and aerosol microphysical properties as well as meteorological parameters,
as summarized in Table 1. Nitric oxide (NO) and the sum of
reactive nitrogen compounds (NOy ) were measured using a
chemiluminescence technique (Schlager et al., 1997; Ziereis
et al., 1999). Individual NOy compounds were catalytically
reduced to NO on the surface of a heated gold converter with
addition of CO. The inlet tube for air sampling was oriented
rearward and heated to 30◦ C to avoid sampling of particles
with diameters larger than about 1 µm and adsorption of nitric acid on the wall of the sampling tube, respectively. The
accuracy of the NO and NOy measurements is 8 and 15%, respectively, for a time resolution of 1 s. Detections of CO and
O3 were made using vacuum resonance fluorescence in the
fourth positive band of CO (Gerbig et al., 1996) and UV absorption (Thermo Electron Corporation, Model 49), respectively. The accuracy of the CO and O3 measurements is 10
and 5% for a time resolution of 5 s.
The aerosol instrumentation was capable of measuring
particle size ranges from the small particles relevant for particle formation processes (Dp <0.02 µm), to the optically
active background Aitken and accumulation mode particles
(0.05 µm
o
o
www.atmos-chem-phys.net/7/913/2007/
A. Stohl et al.: Asian pollution over Europe
915
Table 1. Instrumentation on board the research aircraft Falcon during MEGAPLUME.
Property
Trace gase
NO/NOy
CO
O3
Aerosol properties
Number concentration;
size distribution of ultrafine particles
Size distributions
Dry state, accumulation mode
Ambient state, accumulation + coarse mode
Volume fraction of
volatile/refractory particles
Aerosol optical properties
Volume absorption coefficient, λ=0.55 µm
Meteorological parameters
T, p, RH, 3-D wind velocity
Instrumentation
Chemiluminescence detector
VUV fluorescence
UV absorption
Condensation Particle Counters (CPC)
operated at lower cut-off diameters Dmin =0.004 and 0.010 µm
Passive Cavity Aerosol Spectrometer Probe PCASP-100X: 0.1 µm
Dmin =0.014, and 0.080 µm (CPC & Diffusion Screen Separator DS)
Particle Soot Absorption Photometer (PSAP)
Falcon standard instrumentation
separators (Feldpausch et al., 2006), one thermodenuder
with two channels operated at 20◦ C and 250◦ C (Engler et
al., 2006), and two optical particle counters (passive cavity
aerosol spectrometer probe (PCASP 100X); forward scattering spectrometer probe (FSSP 300)). The number concentrations of nucleation mode, Aitken mode and accumulation mode particles were determined from CPC and PCASP100X data. The fractions of volatile particles of the nucleation mode, Aitken mode and accumulation mode were determined from two CPC instruments connected to heated and
non-heated sampling lines of equal lengths, respectively. The
heating temperature of the sampling line was set to 250◦ C for
separating volatile components of sulfuric acid-like and ammonium sulfate-like behavior from non-volatile or refractory
particle components like BC, sea salt, dust and soil material
(Engler et al., 2006). CPC instruments were operated with
nominal minimum threshold diameters (50% response probability) of 4 and 10 nm for the total aerosol and of 14 and
80 nm for the non-volatile aerosol. The latter cut-off diameter of 80 nm was achieved by a CPC equipped with a diffusion screen separator containing three screens (Feldpausch et
al., 2006). Size distributions of the accumulation and coarse
mode were inferred from a combined analysis of PCASP100X and FSSP-300 data. FSSP-300 data were also used for
the identification of in-cloud sequences. If in a humid air
mass the number concentration in the size range Dp >3 µm
exceeded 1 cm−3 , sequences were labeled in-cloud.
A particle soot absorption photometer (PSAP) (Bond et
al., 1999) was used to measure the aerosol absorption coefficient σap at 550 nm. Based on previous experience (Petzold et al., 2002), only constant-altitude flight sequences
out of clouds were used for the data analysis to avoid measurement artifacts due to pressure changes in the sampling
line during ascent and descent. The limitation to out-ofwww.atmos-chem-phys.net/7/913/2007/
cloud sequences avoids measurement artifacts due to humidity effects on the filter transmission function (Arnott et al.,
2003). The correction function proposed by Bond et al.
(1999) was applied. Since no direct measurement of the
aerosol light scattering coefficient was available, the scattering coefficient correction was performed assuming an average single-scattering albedo of 0.95. The detection limit was
set empirically to 0.1 sMm−1 based on previous experience
(Petzold et al., 2002). The σap values can be converted to
equivalent BC (EBC) mass concentrations by dividing by a
mass-specific absorption coefficient of 8 m2 g−1 (Bond and
Bergstrom, 2006).
2.2 Emission information
For information on FFC emissions in Asia, we used the
EDGAR 3.2 Fast Track 2000 global inventory of CO and
NOx emissions (Olivier et al., 2001). North American emissions were based on the point, onroad, nonroad and area
sources from the U.S. EPA National Emissions Inventory,
base year 1999 with updates for 2005, with spatial partitioning of area sources at 4 km resolution (Frost et al.,
2006). For Europe, we used the expert emissions taken
from the UNECE/EMEP (United Nations Economic Commission for Europe/Co-operative Programme for Monitoring
and Evaluation of Long Range Transmission of Air Pollutants in Europe) emission database for the year 2003. These
data are based on official country reports with adjustments
made by experts and are available at 0.5◦ resolution from
. In addition, estimates were also made
for biomass burning (BB) emissions of CO, using daily fire
detections (resolution about 1 km) from the MODIS instruments onboard the Aqua and Terra satellites (Giglio et al.,
2003), information on land cover at 1 km resolution (Hansen
Atmos. Chem. Phys., 7, 913–937, 2007
916
et al., 2000), and an algorithm recently described by Stohl
et al. (2006). BB emission estimates are highly uncertain by
an estimated factor of three because no information on the
size of the fires is available.
2.3 Model simulations
Simulations were made using the Lagrangian particle dispersion model FLEXPART (Stohl et al., 1998; Stohl and
Thomson, 1999; Stohl et al., 2005) (see u.
no/∼andreas/flextra+flexpart.html). FLEXPART releases socalled tracer particles at emission sources and calculates their
trajectories using the mean winds interpolated from the meteorological input fields plus random motions representing
turbulence. For moist convective transport, the scheme of
ˇ
Emanuel and Zivkovi´ -Rothman (1999), as described and
c
tested by Forster et al. (2007), is used. FLEXPART was
used previously to study intercontinental transport of air pollutants generated by FFC (Stohl and Trickl, 1999; Stohl et al.,
2002a, 2003; Forster et al., 2004) and BB (Forster et al.,
2001; Damoah et al., 2004).
During the measurement campaign, FLEXPART served
as a forecast model, in order to guide the aircraft into pollution plumes of interest. The forecasts, made four times
a day, were similar to the ones described in Forster et al.
(2004) and were using input data from the National Centers for Environmental Prediction Global Forecast System
(GFS) model with 1◦ ×1◦ resolution and 26 pressure levels. For post-mission calculations, FLEXPART was driven
also with operational analyses from the European Centre for
Medium-Range Weather Forecasts (ECMWF) (White, 2002)
with 1◦ ×1◦ resolution (derived from T319 spectral truncation) and two nests (108–27◦ W, 9–54◦ N; 27◦ W–54◦ E,
35–81◦ N) with 0.36◦ ×0.36◦ resolution (derived from T799
spectral truncation). There are 23 ECMWF model levels below 3000 m, and 91 in total. In addition to the analyses at
00:00, 06:00, 12:00 and 18:00 UTC, 3-h forecasts at intermediate times (03:00, 09:00, 15:00, 21:00 UTC) were used.
Most of the results shown in this paper are from the simulations using the ECMWF data but comparisons with results
from GFS-driven simulations will also be presented.
Transport of CO and NOx FFC emission tracers was calculated separately for the source regions Asia, North America and Europe, respectively. For every tracer, 700 000 particles per day were injected between 0 and 100 m above the
ground for area sources and between 100% and 120% of the
stack altitude for point sources. The particles were carried
for 20 days, after which they were removed from the simulation. FLEXPART is a pure transport model and no removal
processes were considered here. Thus, the only purpose of
the model simulations is to identify the regions affected by
pollution plumes and to understand the pollution transport in
relation to the synoptic situation.
A special feature of FLEXPART is the possibility to run it
backward in time to produce information on the spatial disAtmos. Chem. Phys., 7, 913–937, 2007
A. Stohl et al.: Asian pollution over Europe
tribution of sources contributing to a particular measurement
(Stohl et al., 2003; Seibert and Frank, 2004). Backward simulations were made from small segments along flight tracks.
Segments were generated when the aircraft changed its position by more than 0.18◦ in either longitude or latitude, or
changed altitude by more than 8 hPa below 850 hPa, 12 hPa
between 850 and 700 hPa, and 15 hPa above. 40 000 particles were released per segment and were followed backward in time for 20 days, forming what we call a retroplume,
to calculate a so-called potential emission sensitivity (PES)
function, as described by Seibert and Frank (2004) and Stohl
et al. (2003). The word “potential” here indicates that this
sensitivity is based on transport alone, ignoring removal processes that would reduce the sensitivity. The value of the
PES function (in units of s kg−1 ) in a particular grid cell is
proportional to the particle residence time in that cell. It is
a measure for the simulated mixing ratio at the receptor that
a source of unit strength (1 kg s−1 ) in the respective grid cell
would produce. For consistency with the forward simulations, we report PES values for a so-called footprint layer
0–100 m above ground. Folding (i.e., multiplying) the PES
footprint with the distribution of the emission flux densities
(in units of kg m−2 s−1 ) from the FFC and BB inventories
yields a so-called potential source contribution (PSC) map,
that is the geographical distribution of sources contributing
to the simulated mixing ratio at the receptor. Spatial integration of the PSC map finally gives the simulated mass mixing
ratio for the flight segment. Since the backward model output was generated at daily intervals, the timing (i.e., the age)
of the contributing emissions is also known.
2.4 AIRS CO retrievals
For comparison with the model results, CO was retrieved
from the Atmospheric InfraRed Sounder (AIRS) in orbit onboard NASA’s Aqua satellite. All AIRS retrievals for a given
day were binned to a 1◦ ×1◦ grid to produce daily CO maps.
The prelaunch AIRS CO retieval algorithm was employed
using the AFGL standard CO profile as the first guess and
the AIRS team retrieval algorithm PGE v4.0. Here we plot
AIRS upper tropospheric CO mixing ratios for a reference
height of 350 hPa since both FLEXPART and the aircraft in
situ measurements indicate the Asian plume was transported
in the upper troposphere. The AIRS CO retrievals are consistent with this, but lack sufficient vertical specificity to be
conclusive (McMillan et al., 2005, 20071 ).
1 McMillan, W. W., Warner, J. X., McCourt Comer, M., Maddy,
E., Chu, A., Sparling, L., Eloranta, E., Hoff, R., Sachse, G., Barnet,
C., Razenkov, I., and Wolf, W.: AIRS views of transport from 1023 July 2004 Alaskan/Canadian fires: Correlation of AIRS CO and
MODIS AOD and comparison of AIRS CO retrievals with DC-8 in
situ measurements during INTEX-NA/ICARTT, J. Geophys. Res.,
submitted, 2007.
www.atmos-chem-phys.net/7/913/2007/
A. Stohl et al.: Asian pollution over Europe
3
917
Campaign execution
a) 24 March 2006, 12-15 UTC
The EUFAR (European Fleet for Airborne Research) program () provides scientists from European institutes with access to research aircraft. The first author of this paper was awarded 14 flight hours on the German
Falcon research aircraft for a project called MEGAPLUME,
for which we wanted to target a pollution plume from an
American megacity over Europe. However, alternative targets were kept in mind from the beginning since the limited
range of the aircraft, the short campaign duration of five days
and the small number of flight hours dictated a plume-ofopportunity approach.
A major pollution plume from Asia was predicted by
FLEXPART to arrive over Europe on 24–25 March 2006. In
addition, pollution from North America was predicted in the
vicinity of the Asian plume. The forecasts were not favorable for sampling a North American megacity plume, and so
we decided to target the Asian plume and to also sample the
adjacent pollution from North America. The Asian plume
was forecasted to arrive over Europe late on 24 March and
to have already passed over it on 25 March in the afternoon,
thus leaving a rather short window of opportunity. The aircraft had to be back at its home base in Oberpfaffenhofen,
southern Germany, on 24 March in the evening, and could
be used on 25 March – a Saturday – only during the morning. Given these operational constraints, it was decided to
fly a long mission on 24 March, with shuttle flights to and
from Santiago in northwestern Spain, and a primary research
flight (subsequently called flight A) as far out into the North
Atlantic as possible. This flight was intended to characterize the Asian plume before eventual contamination by European sources and heavy aircraft traffic over the continent,
as well as before the plume was leaving the zonal flow over
the Atlantic and arriving at the rear of the trough over Central Europe, where there is often mixing with stratospheric
air. On 25 March, a single flight from Oberpfaffenhofen to
northeastern Spain and back (subsequently called flight B)
was made.
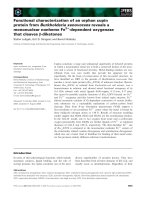
Figure 1 shows the two flight tracks superimposed on maps
of the total columns of the Asian CO tracer at about the time
of the flights from the post-mission FLEXPART simulations.
The 60-h forecast used for the flight planning was very similar. According to the model simulations, flight A reached the
leading edge of the Asian pollution plume whereas flight B
traversed the plume. Flight A suffered from limitations imposed by the Air Traffic Control. It was intended to fly
a triangular pattern with one segment perpendicular to the
plume orientation but this was not possible. Furthermore, the
Falcon was not allowed to ascend higher than 9000 m since
above this altitude it would have entered the air space of the
organized flight routes of the transatlantic air traffic. Nevertheless, as will be shown next, both flights were successful.
www.atmos-chem-phys.net/7/913/2007/
b) 25 March 2006, 9-12 UTC
Fig. 1. Total columns of the Asian FFC CO tracer for (a) 24
March 2006 at 12:00–15:00 UTC and (b) 25 March 2006 at 09:00–
12:00 UTC. Superimposed are the tracks of flights A and B, respectively, with shading from white (0 m asl) to black (13 km a.s.l.). The
airports at Santiago (S) and Oberpfaffenhofen (OP) and way points
(P1, P2 and P3) are marked.
4
Results
4.1 Meteorological conditions and transport from Asia to
Europe
Figure 2 shows the transport history of the Asian pollution
plume, as simulated forward in time with FLEXPART, and
Fig. 3 shows corresponding maps of CO retrieved from the
AIRS measurements for a reference altitude of 350 hPa. This
altitude was chosen for the AIRS retrievals because most of
the transport occurred in the upper troposphere where the
Asian plume is also easier to distinguish from other lowlevel plumes. Between 10 and 17 March (not shown), the
air mass arriving over Europe on 24–25 March had travelled from India to China at low altitudes, taking up copious
amounts of emissions en route. The plume had left the east
Atmos. Chem. Phys., 7, 913–937, 2007
918
A. Stohl et al.: Asian pollution over Europe
(a)
(e)
(b)
(f)
(c)
(g)
(d)
(h)
Fig. 2. Total columns of the Asian CO tracer at 12:00 UTC on (a) 18 March, (b) 19 March, (c) 20 March, (d) 21 March, (e) 22 March, (f)
23 March, (g) 24 March, and (h) 25 March. Note the different color scales in the left and right panels. Overlayed with labeled gray contours
is the geopotential height [m] at 300 hPa. The regions shown are 10–70◦ N for all plots and 110◦ E–140◦ W for panels (a–c), 180–70◦ W
for panels (d–e), and 90◦ W–20◦ E for panels (f–h). White circles (superimposed numbers give the days back in time) mark the retroplume
centroid positions of the FLEXPART backward calculation from the measured plume maximum on 24 March (see Fig. 8).
Atmos. Chem. Phys., 7, 913–937, 2007
www.atmos-chem-phys.net/7/913/2007/
A. Stohl et al.: Asian pollution over Europe
(a)
919
(e)
20060318 daily average
20060322 daily average
60 N
°
60 N
°
40° N
40° N
°
20° N
20 N
120° E
140° E
(b)
160° E
180° E
160° W
140° W W
180°
160° W
140° W
(f)
20060319 daily average
120° W
100° W
80° W
20060323 daily average
60 N
°
60 N
°
°
40 N
°
40 N
°
°
20 N
20 N
°
°
120 E
°
140 E
(c)
°
160 E
°
180 E
°
160 W
140 W
°
°
80 W
60 W
(g)
20060320 daily average
°
40 W
°
°
20 E
°
20 E
°
20 W
°
20 E
0
20060324 daily average
60° N
60° N
°
40 N
°
40 N
20° N
20° N
°
°
120 E
°
140 E
(d)
°
160 E
°
180 E
°
160 W
140 W
°
°
80 W
60 W
(h)
20060321 daily average
°
40 W
°
20 W
°
0
20060325 daily average
60° N
60° N
40° N
40° N
20° N
°
20° N
°
180 W
°
160 W
70
80
140 W
90
°
120 W
100
110
120
130
350 mb CO Mixing Ratio (ppbv)
°
°
100 W
140
°
80 W
150
°
80 W
160+
70
60 W
80
90
°
40 W
°
20 W
100
110
120
130
350 mb CO Mixing Ratio (ppbv)
°
0
140
150
160+
Fig. 3. CO retrieved for a reference altitude of 350 hPa from daily AIRS measurements for (a) 18 March, (b) 19 March, (c) 20 March, (d)
21 March, (e) 22 March, (f) 23 March, (g) 24 March, and (h) 25 March. The regions shown are identical to those in Fig. 2. Grey areas mark
regions without data coverage or where retrievals were not successful due to cloud obscuration.
www.atmos-chem-phys.net/7/913/2007/
Atmos. Chem. Phys., 7, 913–937, 2007
920
A. Stohl et al.: Asian pollution over Europe
(a)
(b)
(c)
Fig. 4. Vertical cross sections of the Asian CO tracer [ppbv] (a) at
140◦ E on 18 March, (b) at 160◦ E on 19 March, and (c) at 30◦ W on
24 March, all at 12:00 UTC. The positions of the vertical sections
are shown as white lines in the corresponding panels of Fig. 2.
Atmos. Chem. Phys., 7, 913–937, 2007
coast of China at levels below 3 km on 17 March and was
located between 30◦ and 40◦ N over and southeast of Japan
on 18 March (Fig. 2a). The white circle in Fig. 2a labels the
position of the observed plume maximum, projected backward in time (for explanation, see later) to the date shown, to
identify the part of the plume sampled later by the Falcon. A
trough and its associated cold front were approaching from
the northwest and started to lift the leading part of the plume
to levels between 3 and 8 km altitude (Fig. 4a). The CO retrieved from AIRS shows a maximum above 160 ppb to the
east of southern Japan and confirms the export of pollution
from Asia (Fig. 3a). However, clouds obscured large parts of
the plume from satellite detection, and the trailing part of the
plume was still well below the 350 hPa reference height on
18 March.
One day later, on 19 March, the trough had intensified and
almost passed Japan (Fig. 2b). At this time the plume was
located entirely in the cyclone’s WCB, and its leading part
– the part finally sampled over Europe – was already in the
upper troposphere (Fig. 4b) where it moved northeast-, then
east- and southeastwards in a rapid upper tropospheric air
stream on the following two days (Fig. 2c and 2d). It looks
as if the plume merged with a second plume that was located
at 160◦ E on 18 March (Fig. 2a) and that was travelling into
the same direction on 19 and 20 March. However, this second plume moved at low levels and much slower than the
one of interest here and was quickly overtaken by it. The
AIRS retrievals for 19 March suffered from the cloudiness
in the WCB and only hint at a major pollution outflow event
(Fig. 3b) but on 20 (Fig. 3c) and 21 March (Fig. 3d), the
plume was fully exposed to the satellite measurements and
confirms the transport of the plume across the North Pacific.
AIRS-retrieved CO mixing ratios are larger than 150 ppbv in
a pollution stream extending over more than 5000 km.
On 21 March, the upper tropospheric plume already approached the Californian coast (Fig. 2d and Fig. 3d). While
a part of the plume descended to mid-tropospheric levels
and moved southeastward behind the trough over the Californian coast, another part stayed in the upper troposphere,
traveled rapidly around the trough and crossed the central
U.S. on 22 March (Fig. 2e and Fig. 3e). Then it got into
a strong, nearly zonal flow along about 35◦ N (Fig. 2f) and
crossed the North Atlantic within 2 days (Fig. 2g and 2h;
Fig. 3g and Fig. 3h), still moving at upper tropospheric levels (Fig. 4c). In total, the journey from the east coast of Asia
to the west coast of Europe took only 7 days. Finally, on 25
March the plume arrived over western France (Fig. 2h and
Fig. 3h) behind a trough that had been located west of Spain
on 23 March (Fig. 2f) and had traversed Spain between 23
and 24 March (Fig. 2g). Even over Europe on 25 March
(Fig. 3h), the Asian CO plume can still be clearly identified
in the AIRS CO retrievals. Additional features in the AIRS
map over major European population centers must actually
come from lower levels in the troposphere and are the result of the broad averaging kernel used in the AIRS retrieval.
www.atmos-chem-phys.net/7/913/2007/
A. Stohl et al.: Asian pollution over Europe
200603241300 MSG−WV062
−30
−20
234 K
231 K
228 K
225 K
0
−10
0
a) 24 March 2006
10
10
36 38 40 42 44 46 48 50
237 K
−10
50 48 46 44 42 40 38 36
240 K
921
−30
−20
200603251115 MSG−WV062
−8 −4 0
4
8
12
16
234 K
231 K
228 K
225 K
50 48 46 44 42 40 38 36
237 K
36 38 40 42 44 46 48 50
240 K
−8
−4
0
4
8
12
b) 25 March 2006
16
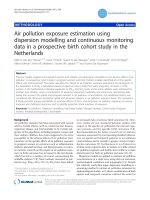
Fig. 5. Equivalent blackbody temperature of the METEOSAT-8
WV 062 channel centered in the water vapor absorption band on
24 March at 13:00 UTC (top) and on 25 March at 11:15 UTC (bottom). The routes of flight A and B are superimposed as grey lines,
and the position of the aircraft at the time of the image is marked by
a cross.
Overall, the comparison between the FLEXPART simulation
and the AIRS retrievals shows excellent agreement over the
entire transport history, indicating a very high accuracy of the
simulated transport.
Polluted air masses from North America were located below the Asian plume in the mid-troposphere. These North
American air masses had left the East coast of the U.S. on 21
March and arrived over Spain and France at about the same
time as the Asian plume but at lower altitudes. In the AIRS
retrievals for 23 March (Fig. 3f), this North American plume
can be seen east of about 40◦ W, ahead of the Asian plume,
with lower mixing ratios than measured in the Asian plume.
Figure 5 shows the equivalent blackbody temperature of
the METEOSAT-8 WV 062 channel centered in the water
vapor absorption band, for the times of flights A and B. In
a cloud-free mid-latitude standard atmosphere the dominating part of the signal results from approximately 300 hPa.
If the air is dry, lower and thus warmer layers contribute to
the signal. The ice particles of cirrus clouds emit with their
own temperature and show up as cold, structured areas. On
24 March, the Asian plume (Fig 1) was co-located with a
dry upper tropospheric air mass (Fig. 5, top), with the predicted plume shape being similar to that of the dry region.
www.atmos-chem-phys.net/7/913/2007/
Fig. 6. Time-height curtains through the Asian FFC CO tracer along
the tracks of (a) flight A on 24 March 2006, and (b) flight B on 25
March 2006. The black line shows the flight altitude. Times of
ascents/descents from/to airports in Santiago (S) and Oberpfaffenhofen (OP) and arrivals at way points (P1, P2 and P3) are marked.
However, the measurements were made in the leading part
of the plume where cirrus cloud fields were present. Over
southwestern France and the Mediterranean (0–10◦ E, about
40◦ N), the air was very dry on 24 March, indicating the descent of stratospheric air into the troposphere on the rear of
the trough (compare with Fig. 2g). The stratospheric intrusion related to this trough was encountered by flight B on the
next day near the region with the warm temperatures seen
in Fig. 5 (bottom) just to the west of the aircraft position
marked with a cross. As we shall see, on 25 March, some
of the Asian pollution was located between the stratosphere
above and the stratospheric intrusion below and was mixing
with both of them.
Atmos. Chem. Phys., 7, 913–937, 2007
922
A. Stohl et al.: Asian pollution over Europe
Fig. 7. Comparison of time series of modeled CO tracers from the backward simulations (colored bars, left axes) with measured CO (black
lines, right axes) for flight A on 24 March 2006. Note that the axes are labelled inside the figure, with “CO t” corresponding to the modeled
CO tracer and “CO” corresponding to the measured CO. Measured CO is shown in every panel, whereas the colored bars are (a) BB CO
tracer, (b) sum of all three regional FFC CO tracers, (c) BB+FFC CO tracer, (d) BB+FFC CO tracer. Model results shown in panels (a–c)
were produced by driving FLEXPART with ECMWF analyses, and those shown in panel (d) were produced using GFS data. The colors in
a) and b) give the age (i.e., time since emission) of the CO tracers according to the top label bar, whereas in (c) and (d) the colors separate
regional FFC tracers and BB according to the bottom label bar. The grey line shows the flight altitude.
4.2 Identification of flight segments influenced by the
Asian pollution
4.2.1 Flight A
Figure 6 shows the mixing ratios of the Asian CO tracer obtained from the forward model simulation interpolated onto
curtains along the flight tracks. According to the model results, the aircraft encountered the Asian plume in the middle
section (i.e., farthest to the west) of flight A (Fig. 6a). The
Atmos. Chem. Phys., 7, 913–937, 2007
simulated plume was located mainly between 8 and 11 km
and was underflown most of the time. Nevertheless, as we
will see later, the Asian plume was sampled several times,
in the general region where the model places it, albeit at too
high altitudes.
Figure 7 shows regional CO tracer mixing ratios obtained
from the series of backward simulations along flight A.
FLEXPART, based on the ECWMF data (Fig. 7c), predicts
a single strong encounter of the Asian FFC plume (shown
in blue) between 12:30 and 13:00 UTC but weaker “Asian
www.atmos-chem-phys.net/7/913/2007/
A. Stohl et al.: Asian pollution over Europe
923
a) Column-integrated potential emission sensitivity
b) Footprint potential emission sensitivity
c) CO potential source contribution
Fig. 8. Retroplume results from the backward simulation for the segment from 12:46–12:48 UTC (altitude of 315 hPa) of flight A on 24
March 2006. Shown are (a) the column integrated PES, (b) the footprint PES, and (c) the PSC for FFC CO over Southeastern Asia. The
numbers on the plots give the daily retroplume centroid positions (only up to 10 days back in panels a and b), the aircraft position is shown by
an asterisk at about 20◦ W. Black dots in panels (a) and (b) show MODIS fire detections on days when the column-integrated PES (footprint
PES) in the corresponding grid cell on that day exceeded 8 ns m kg−1 (5 ps kg−1 ). If a fire detection occurred in a pixel with forest as the
main land cover type, a smaller red dot is superimposed.
influence” along most of the flight. The FLEXPART results
using the alternative GFS input data (Fig. 7d) are similar but
suggest the plume maximum earlier along the flight track.
Both model versions predict North American FFC CO tracer
(shown in red in Fig. 7c and 7d) for the first and last hour of
the flight.
www.atmos-chem-phys.net/7/913/2007/
The age (i.e., time since emission) of the North American
pollution (Fig. 7b) is less than a week, whereas the Asian
plume is between 7 and 15 days old, with smaller contributions up to the maximum simulated age of 20 days. The
minimum age marks the time when the plume left the Asian
seaboard, on 17 March. FLEXPART also suggests that BB
Atmos. Chem. Phys., 7, 913–937, 2007
924
A. Stohl et al.: Asian pollution over Europe
Fig. 9. Same as Fig. 7 but for flight B on 25 March 2006.
contributed slightly more CO to the Asian plume (Fig. 7a)
than FFC (Fig. 7b), but this result is highly uncertain due
to the lack of information on the actual areas burned. We
shall see later that the actual BB contribution was probably
smaller.
Figure 7 also shows the measured CO mixing ratios along
the flight track. They show considerably more variability
than the model results and four maxima in the general region
of the Asian plume (from 12:00–14:00 UTC). The biggest
maximum occurred at exactly the same time as simulated
using the ECMWF data but the other maxima are not captured by the model simulations. As shown in the curtain
plots (Fig. 6), the model placed the Asian plume above the
flight track. For instance, the measured CO peaks from about
13:30–14:00 UTC are 2 km underneath a simulated plume
Atmos. Chem. Phys., 7, 913–937, 2007
maximum. Given that the measurements were all made close
to the leading edge of the Asian plume, in a region with
very strong concentration gradients (see Fig. 1), the partial
disagreement between the model and the measurements is
not surprising. In agreement with the measurements, the
model predicts the lowest CO concentrations at 12:00 UTC,
between the Asian plume and the moderately strong North
American plume. The simulated maximum CO tracer mixing ratios of the combined FFC and BB emissions (Fig. 7c)
slightly overpredict the observed CO enhancements in the
Asian plume, probably because of an overestimate of the BB
emissions.
Figure 8 shows the retroplume results from the ECMWF
backward simulation for the period from 12:46–12:48 UTC,
which yielded the highest Asian FFC CO tracer mixing
www.atmos-chem-phys.net/7/913/2007/
NA-I
BG-I
I BG-II
II BG-III III IV
160
140
0.5
120
100
0.3
0.4
0.2
80
60
0.1
40
CO (ppbv)
0.6
NA-II
180
160
140
120
100
80
60
40
1100
NA-I
1200
1230
BG-I
I BG-II
1300
1330
0
1430
1400
II BG-III III IV
NA-II
90
80
70
60
50
1100
Altitude
1130
1130
CO (ppbv)
1200
1230
NOy (ppbv)
1300
1330
Time
NO (ppbv)
1400
RH (0.1)
Ozone (ppbv)
CO (ppbv)
180
925
NOy, NO, RH, Altitude
A. Stohl et al.: Asian pollution over Europe
40
1430
O3 (ppbv)
Fig. 10. Time series of CO, NO, NOy , O3 and RH over liquid water measured during flight A on 24 March 2006. Flight altitudes are shown
in relative units. The time series were smoothed by calculating 20-s running means from the original 1-s data. Periods with encounters of
North American pollution are marked with yellow background and are labelled NA-I and NA-II. Four penetrations of the Asian plume are
highlighted with turquoise background and are labelled I-IV. Three “background” periods are labelled BG-I, BG-II and BG-III.
ratio. The PES integrated over the entire atmospheric column
(Fig. 8a) illustrates the pathway of the polluted air mass. The
retroplume was well confined (i.e., almost followed a single
trajectory) for 6 days back, as the transport occurred in the
upper troposphere in a narrow latitude band from 30–50◦ N.
The retroplume centroid positions are marked at daily intervals, and these markers were also shown in the plots of the
forward tracer simulation (Fig. 2). The Asian seaboard was
reached 7 days back when the retroplume touched down into
the PBL and spread considerably further back in time, due to
boundary layer turbulence.
The footprint PES plot (Fig. 8b) shows almost no signal
before the retroplume reached Asia as the transport from
Asia occurred in the upper troposphere (most of the weak signals over the North Atlantic and North Pacific are older than
6 days). Only after the retroplume descended in the WCB
(backward in time) into the Southeast Asian PBL, high footprint emission sensitivity values can be found over China,
India and other countries in Southeast Asia. Also shown in
Fig. 8 are the locations of active fires detected on days when
the retroplume passed over them and produced a minimum
PES of 5 ps kg−1 in the footprint layer (Fig. 8b) or a minimum column-integrated PES of 8 ns m kg−1 (Fig. 8a). These
www.atmos-chem-phys.net/7/913/2007/
threshold values were chosen subjectively in order to show
fires only where they would produce a noticeable PSC, given
typical estimated fire emission strengths. Most of the fires
were detected on agricultural lands in Myanmar and Thailand. The size of these fires is not known and, thus, the emission strength is highly uncertain. However, the Asian pollution plume likely contained a mixture of FFC and BB emissions, which is typical for pollution outflow from Southeast
Asia (Russo et al., 2003). Figure 8c, the PSC map resulting from the folding of the footprint PES map with the FFC
emission inventory, suggests that FFC emissions from a vast
region contributed to the pollution plume. The retroplumes
started from other flight segments in the simulated Asian
plume (also those using the alternative GFS data) showed
almost the same source region and a very similar transport
route but lower footprint PES (and, thus, smaller PSC) values.
4.2.2 Flight B
During flight B on 25 March, the aircraft travelled from
southern Germany to northeastern Spain, where it descended
to near the surface, ascended to the maximum altitude of
Atmos. Chem. Phys., 7, 913–937, 2007
926
A. Stohl et al.: Asian pollution over Europe
Table 2. Mean and excess trace gas mixing ratios during the periods NA-I, NA-II, background periods BG-I, BG-II and BG-III, and Asian
plume encounters I–IV of flight A as defined in Fig. 10, and during the Asian plume encounters I–V, as well as periods S-I, S-II and BL as
defined in Fig. 12.
Flight
Period
Mean
CO,
ppbv
Excess
CO,
ppbv
Mean
O3 ,
ppbv
Excess
O3 ,
ppbv
Mean
NO,
pptv
Mean
NOy ,
ppbv
Mean
NO/NOy
ratio
A
NA I+II
BG-I
BG-II
BG-III
I
II
III
IV
124
108
121
121
137
149
132
133
9
−7
6
6
22
34
17
18
56
53
49
48
50
57
55
55
8
5
1
0
2
9
7
7
17
34
30
20
33
33
25
17
0.28
0.26
0.21
0.25
0.26
0.36
0.36
0.34
0.07
0.13
0.14
0.08
0.12
0.09
0.07
0.05
I–IV mean
138
23
54
6
27
0.33
0.08
I
II
III
IV
V
S-I
S-II
BL
144
152
146
142
145
88
92
150
9
17
11
7
10
–
–
–
66
61
59
74
65
169
159
47
16
11
9
24
15
–
–
–
56
43
11
50
87
162
204
816
0.57
0.52
0.43
0.58
0.53
1.16
1.00
3.87
0.10
0.08
0.03
0.09
0.16
0.14
0.20
0.21
B
Table 3. Trace gas correlations during the periods NA-I, NA-II, and Asian plume encounters I–IV of flight A as defined in Fig. 10, and
during the Asian plume encounters I–V, as well as periods S-I, S-II and BL as defined in Fig. 12. Squared correlation coefficients (r2 ) and
slopes of the regression lines are reported.
Flight
Period
A
NA I+II
I
II
III
IV
−2.31×10⁻³
4.87×10⁻³
4.13×10⁻³
4.32×10⁻³
4.15×10⁻³
I–IV mean
I
II
III
IV
V
S-I
S-II
BL
−0.73×10⁻³
5.69×10⁻³
4.40×10⁻³
1.88×10⁻³
1.01×10⁻³
−9.6×10⁻³
−12.5×10⁻³
241.6×10⁻³
r2
4.49×10⁻³
B
NOy / CO
0.03
0.24
0.78
0.98
0.79
−0.39
0.31
0.30
0.24
0.22
r2
0.11
0.73
0.75
0.75
0.22
0.25
0.01
0.37
0.97
0.09
0.01
0.74
0.81
0.93
11 km, and then flew back at 9.1 km, the altitude of the
highest CO mixing ratios found during the first flight leg.
This flight traversed the central part of the simulated Asian
plume, for which the model gives a wide vertical distribution from about 5.5 to 11 km, with the highest mixing
Atmos. Chem. Phys., 7, 913–937, 2007
O3 / CO
−0.35
0.07
0.23
−0.62
−0.25
−2.70
−2.62
−0.11
O3 / NOy
66.7
44.9
61.3
56.3
76.8
r2
0.37
0.38
0.67
0.79
0.59
59.8
0.17
0.02
0.42
0.21
0.18
0.94
0.90
0.30
61.8
45.3
53.7
181.6
5.4
210.2
177.3
−0.4
0.27
0.64
0.53
0.61
0.01
0.69
0.88
0.26
ratios at the level of the return leg (Fig. 6b). Figure 9
shows the modeled CO tracer and measured CO mixing ratios along the flight. According to the model using the
ECMWF data input (Fig. 9c), the Asian plume was penetrated on three sections of the flight: from 09:45–10:30 UTC
www.atmos-chem-phys.net/7/913/2007/
A. Stohl et al.: Asian pollution over Europe
0.55
0.5
0.45
NOy (ppb)
0.4
0.35
0.3
0.25
NA
I
II
III
IV
0.2
0.15
100
110
120
130
140
150
160
170
180
CO (ppb)
90
NA
I
II
III
IV
80
O3 (ppb)
(first descent), from 11:00–11:10 UTC (ascent to maximum
altitude), and from 11:20–12:00 UTC (level flight back).
The model suggests the aircraft to have been in the stratosphere at the two highest sections of the flight (model products not shown here but available from />∼andreas/MILAGRO ETC/), probed North American pollution between about 3 and 5 km, and flown through a mixture
of fresh European and aged North American pollution below
3 km. The Asian pollution plume was sandwiched between
the stratosphere above and the North American pollution below. The alternative simulations using the GFS data (Fig. 9d)
reveal a similar picture but give lower Asian CO tracer mixing ratios. The retroplumes in the Asian plume are very similar to the ones for the previous day (see Fig. 8) and indicate
the same source region, and the age distribution of the FFC
emissions (Fig. 9b) is consistent with a 1-day aging. Again,
the model suggests considerable influence from BB (Fig. 9a).
The CO measurements (Fig. 9) generally confirm the
FLEXPART scenario. There are very low CO levels (60–
90 ppbv) in the stratospheric sections of the flight, strongly
enhanced CO values in the Asian plume sections as well as
in the boundary layer, and moderate CO values in the North
American plume. The measured CO values in the North
American plume are consistent with the values observed on
the previous day (130–140 ppbv), and the highest CO values
in the Asian plume (about 170 ppbv) are also similar to the
previous day.
927
70
60
50
40
100
110
120
130
140
CO (ppb)
150
160
170
180
4.3 Chemical composition in the Asian pollution plume
4.3.1 Flight A – unperturbed Asian pollution
Figure 10 shows the time series of the flight altitude, the relative humidity (RH), CO, NO, NOy and O3 measured during
flight A. For the further analysis, we subdivide the time series in several periods. Two periods, labelled NA-I and NA-II
and marked with a yellow background contain North American pollution. Four periods, which contain mostly Asian
pollution (periods I–III) and possibly a mixture of Asian
and North American pollution (period IV) are highlighted
with a turquoise background. For periods I–III, the potential temperature (not shown) was almost exactly the same
(320±1 K), whereas for period IV it was about 3 K lower.
This indicates that the pollution measured during periods I–
III originated from the same source region but for period IV
the source region may have been different. FLEXPART suggests this to be still mainly Asian pollution but because of the
model uncertainties, a North American origin or a mixture of
contributions from both regions cannot be excluded for flight
segment IV. For comparison purposes, we also label three
sequences less influenced by the Asian pollution (BG-I, BGII, BG-III). The periods NA-I, NA-II and I-IV span a large
range of values, which makes them particularly suitable for
correlation analyses.
www.atmos-chem-phys.net/7/913/2007/
Fig. 11. Scatter plots of NOy versus CO (top) and O3 versus CO
(bottom) for various sections of flight A, with added regression lines
through the data where correlations are significant. The data are
shown for the Asian plume penetrations I–IV, and combined North
American plume encounters NA-I and NA-2, as indicated by the
colors and as defined in Fig. 10.
Table 2 lists the mean mixing ratios of CO, O3 , NO and
NOy for the selected periods. For CO and O3 , the excess values over the subjectively determined background values of
115 ppbv and 48 ppbv, respectively are reported, too. The assumed background mixing ratios were derived from the data
measured during periods BG-I, BG-II and BG-III outside the
major plume sections. CO background mixing ratios at the
low latitudes from where this air mass originated are normally lower than those measured. Thus, these “background”
air masses themselves must have been influenced to some
extent by Asian emissions and, therefore, the excess values
are conservative estimates of the impact of the Asian emissions. CO is strongly enhanced, on average by 17–34 ppbv,
during the Asian plume penetrations I–IV, with a peak enhancement of more than 60 ppbv during period II. NOy mixing ratios are also elevated: Average values range between
0.26 and 0.36 ppbv for periods I–IV, and peak values are
Atmos. Chem. Phys., 7, 913–937, 2007
928
close to 0.5 ppbv. O3 mixing ratios are not particularly high
(50–57 ppbv on average) but clearly enhanced by 2–9 ppbv
over the background. Nevertheless, the enhancements stand
out from the background variability, and peak O3 mixing ratios during period II reach almost 70 ppbv, 22 ppbv above the
background.
Standard linear regression analyses of 1-s CO, NOy and
O3 data were made and the Pearson correlation coefficients were calculated for the different periods marked in
Fig. 10. Table 3 gives the corresponding correlation parameters and Fig. 11 shows scatter plots of NOy versus
CO and O3 versus CO data, with superimposed regression
lines. There are strongly positive correlations between CO
and NOy for periods I–IV (squared correlation coefficients
r2 between 0.73 and 0.98), with highly consistent slopes of
NOy / CO=0.0045±0.0004 (Table 3). The NOx /CO emission ratio in rural areas of Asia may be as low as 0.03 (Wang
et al., 2002), which is much less than the 0.14–0.3 for FFC
emissions in North America reported by Parrish et al. (1991),
but the observed NOy / CO values are almost an order of
magnitude lower than that. This indicates that some 90%
of the NOy emitted was removed from the atmosphere before the measurement. This is in agreement with previous
findings (Stohl et al., 2002b, for conditions downwind of
North America) (Koike et al., 2003; Miyazaki et al., 2003b;
Takegawa et al., 2004, for conditions downwind of Asia), that
NOy is very efficiently scrubbed from the atmosphere upon
export from the boundary layer. Although most of the NOy
was removed and only 5–12% of the remaining NOy was in
the form of NO (Table 2), the mean NO levels measured during periods I–III (25–33 pptv) are likely still sufficiently high
for this upper tropospheric air mass to be in a net O3 production regime (e.g., Reeves et al., 2002).
There is no correlation (r2 =0.03) between CO and NOy
for periods NA-I and NA-II. Some of the data even show
a negative NOy /CO correlation (Fig. 11), which indicates a
stratospheric origin. Overall, the NOy /CO correlations for
sequences NA-I and NA-II suggest the presence of tropospheric background air weakly perturbed by emissions in
North America (FLEXPART produces CO enhancements of
only 15–30 ppbv due to North American FFC emissions) and
occasional stratospheric influence.
The O3 /CO correlations (Fig. 11 and Table 3) confirm the
above interpretation. Periods NA-I and NA-II show a large
scatter of the data, with an overall negative O3 /CO slope. In
contrast, periods I–IV have relatively tight O3 /CO correlations (r2 ranging from 0.22 to 0.75) and O3 / CO slopes
of 0.24–0.30. Again, the similarity of the slopes suggests a
common origin of the air masses I–IV. Under the assumptions that both CO and O3 are conserved during transport
and if mixing with surrounding air can be neglected, the
O3 / CO slopes give the number of O3 molecules formed
per CO molecule emitted. For aged North American FFC
plumes in the North Atlantic region, Parrish et al. (1998) reported average O3 / CO values of 0.25–0.40, and for the
Atmos. Chem. Phys., 7, 913–937, 2007
A. Stohl et al.: Asian pollution over Europe
Azores, Honrath et al. (2004) reported a rather high value
of 1.0 (both for summer conditions). For aged BB plumes,
the O3 / CO values are normally lower (e.g., 0.05–0.11
according to Wotawa and Trainer, 2000). The O3 / CO
slopes of 0.24–0.30 in the Asian plume are at the lower end
of the values reported for FFC emissions but they are consistent with O3 / CO slopes of 0.2–0.5 observed in Asian
pollution plumes over North America (Price et al., 2004). In
summary, the O3 formation efficiency based on CO was not
particularly high in our case, which could be due to the lower
NOx /CO emission ratio in Asia than elsewhere (Wang et al.,
2002), or an admixture of BB emissions. O3 is also tightly
correlated (r2 ranging from 0.38 to 0.79) with NOy for periods I–IV (Table 3), and the O3 / NOy slopes range from
45 to 77, which is comparable to the slope of 60 reported by
Miyazaki et al. (2003a) in the Asian outflow in spring.
4.3.2 Flight B – Asian pollution mixing with stratospheric
air
Figure 12 shows the time series of the trace gas measurements for flight B. Five flight segments (I–V, highlighted in
turquoise in Fig. 12) have been identified as penetrations of
the Asian plume, during two periods the aircraft flew in the
stratosphere (S-I, S-II, highlighted in yellow), and one period marks the descent into the boundary layer at the point of
return (BL, pink). The CO data bear clear signatures of the
Asian plume penetrations, with average CO concentrations
being actually somewhat higher than on the previous day,
although the enhancements stand out somewhat less clearly
because of a higher background (Table 2). Figure 13 shows
NOy /CO and O3 /CO scatter plots, and Table 3 summarizes
the correlation parameters. Periods S-I and S-II have negative NOy / CO and O3 / CO slopes, which are characteristic for stratospheric air. Segment BL has a very large
NOy / CO slope and a slightly negative O3 / CO slope,
which is characteristic of fresh emissions where NOy removal and O3 formation have not occurred yet (note that
NOy mixing ratios of up to 10 ppbv were measured in the
BL, which are not shown in Fig. 12 and 13).
The NOy /CO scatter plot also reveals frequent encounters
of aircraft exhaust plumes, which are characterized by large
enhancements in NOy and NO but small CO signals. This is
most noticeable during period S-II but also during periods I
and V. Notes made by the mission scientist (B. Weinzierl)
during the flight document the frequent encounter of aircraft
contrails at the higher flight levels.
Of the Asian plume penetrations I–V, only period III has a
chemical composition that is comparable to the Asian plume
observed during flight A. During period III, the observed
mixing ratios of CO, O3 , NO and NOy are all very similar to the values observed on the previous day (Table 2)
and also the trace gas correlations are almost the same (Table 3). The potential temperatures (310–315 K) are about 5–
10 K lower than those measured in the Asian plume on the
www.atmos-chem-phys.net/7/913/2007/
160
140
I
II
III
1
V
S-I
0.8
0.6
120
100
0.4
80
40
0900
180
160
140
120
100
80
60
40
0900
Altitude
0.2
BL
60
CO (ppb)
IV
S-II
0
0930
1000
1030
I
III
II
1100
1130
IV
1200
1230
V
S-I
100
90
80
70
60
BL
Ozone (ppb)
CO (ppbv)
180
929
NOy, NO, RH, Altitude
A. Stohl et al.: Asian pollution over Europe
50
S-II
0930
1000
CO (ppbv)
1030
1100
1130
Time
NOy (ppbv)
NO (ppbv)
40
1200
RH (0.1)
1230
O3 (ppbv)
Fig. 12. Same as Fig. 10, but for flight B on 25 March 2006. Possible Asian plume penetrations are numbered I–V and highlighted by a
turquoise background, stratospheric flight sections are labelled S-I and S-II and highlighted in yellow, and the descent into the boundary
layer is labelled BL and highlighted in pink, respectively.
day before, indicating that not exactly the same air mass was
flown through. However, a radiational cooling of about 1–
2 K/day in clear-sky conditions and more in the presence of
cirrus clouds can partly explain the decrease. The remaining
periods I, II, IV and V are characterized by higher O3 and
NOy mixing ratios, as well as small or negative O3 / CO
and NOy / CO slopes and low correlation coefficients, despite the fact that the high CO mixing ratios indicate polluted
conditions. The reason for this is that the Asian pollution
plume was mixing with stratospheric air at almost the same
potential temperatures (mostly 315 K but up to 321 K in segment IV) as measured in segment III. Most of the data points
for periods I, II, IV and V in the O3 /CO (and less clearly, also
in the NOy /CO) scatter plot are lying above the regression
line for period III and to the right of the regression lines for
periods S-I and S-II. This is a clear signature of the mixing
between polluted and stratospheric air, reminiscent of similar cases presented by Parrish et al. (2000) and Cooper et al.
(2004a).
Figure 14 presents a plot of O3 and CO versus altitude
for a short period of the flight from the end of segment IV
to the beginning of segment S-II, which clearly shows the
mixing between polluted and stratospheric air. This profile
was obtained just to the west of the position marked with a
www.atmos-chem-phys.net/7/913/2007/
cross in the water vapor satellite image (Fig. 5, bottom), in
a generally very dry upper tropospheric air mass. Between
6 and 8 km, both O3 and CO increase with altitude as the
aircraft ascended into the Asian pollution plume. At about
8.7 km, a thin layer of stratospheric origin is embedded in the
Asian plume, with low CO and high O3 mixing ratios. CO
increased and O3 decreased again above this layer before the
aircraft finally ascended into the stratosphere above 10 km.
Interestingly, O3 and CO are strongly anticorrelated between
the layer of stratospheric origin and the stratosphere, even
though the highest CO values occur there at 9 km. This can
only be interpreted as the result of mixing between stratospheric air masses and the Asian pollution plume.
While the chemical data clearly shows the effect of the
mixing, it would be interesting to know whether this mixing
has occurred earlier, or was still in progress as the aircraft
performed the sounding. The mission scientist (B. Weinzierl)
reported that the ascent was bumpy, suggesting active turbulence. Also shown in Fig. 14 are the potential temperature
and wind velocity (FF). There are several altitudes
where the profile indicates that the thermal stratification of
the atmosphere was only weakly stable, neutral, or in some
cases maybe even slightly unstable, e.g., between about 8 km
and the layer of stratospheric origin. The unstable layers are
Atmos. Chem. Phys., 7, 913–937, 2007
930
A. Stohl et al.: Asian pollution over Europe
2
Θ (K)
312
1.8
314
316
318
320
322
324
326
11
1.6
10
Altitude (km)
NOy (ppb)
1.4
1.2
1
0.8
0.6
0.4
S-I
S-II
BL
I
II
IV
V
III
8
Ri
Θ
FF
CO
O3
7
60
80
100
120
CO (ppb)
140
220
160
180
160
6
180
S-I
S-II
BL
I
II
IV
V
III
200
O3 (ppb)
9
60
80
100
120
140
CO (ppb), O3 (ppb), FF (m/s + 80 m/s)
160
Fig. 14. Vertical profile of CO, O3 , , and wind velocity (FF) measured during flight B between 11:00 and 11:13 UTC. Furthermore,
altitudes with Ri<0.2 are marked with red dots.
140
180
10000
NA-I
BG-I I BG-II
II BG-IIIIII IV
NA-II
120
1000
140
80
120
CO
60
40
100
100
60
80
100
120
140
160
180
CO (ppb)
80
10
Number concentration (scm-3)
160
100
60
Fig. 13. Scatter plots of NOy versus CO (top) and O3 versus CO
(bottom) for various segments of flight B. The data are shown for
the Asian plume penetrations I–V, stratospheric sections S-I and SII, and the boundary layer flight segment BL, as indicated by the
colors and as defined in Fig. 12. Regression lines are shown for
segments S-I, S-II, BL and III, which feature tight correlations.
possibly an artefact of the slantwise ascent of the aircraft and
a short horizontal flight segment. However, the deeper neutral or only slightly stable layers must be real. In addition,
there is substantial wind shear in some of these layers.
In order to identify turbulent layers, we calculated the
Richardson number (Stull, 1988)
40
1100
1130
Altitude
CO
1200
1230
NUC
AITK
1300
1330
1400
1
1430
ACC
Fig. 15. Time series of the number concentrations of nucleation
(NUC), Aitken (AITK) and accumulation (ACC) mode particles
measured during flight A on 24 March 2006. Flight altitudes are
shown in relative units. The time series were smoothed by calculating 20-s running means from the original 1-s data. Periods with
encounters of North American pollution are marked with yellow
background and are labelled NA-I and NA-II. Four penetrations of
the Asian plume are highlighted with turquoise background and are
labelled I–IV. Three “background” periods are labelled BG-I, BG-II
and BG-III.
g
z
Ri =
u
z
2
+
v
z
2
(1)
where g is the acceleration due to gravity, u and v are the
zonal and meridional wind components, is the average potential temperature of two subsequent measurements, and z
is the altitude. To reduce the effect of instrumental noise,
Ri was calculated on the basis of 10-s averages. Values of
Ri smaller than about 0.21 to 0.25 indicate an almost 100%
probability of the occurrence of turbulence, since even an
Atmos. Chem. Phys., 7, 913–937, 2007
originally laminar flow would become turbulent at these values (Stull, 1988). The altitudes with Ri<0.2 are marked with
red dots in Fig. 14. According to this analysis, turbulent layers occurred within the Asian plume below 7 km, just below
the layer of stratospheric origin at 8 to 8.5 km, and below
the tropopause at around 10 km. Note that Ri<0.2 is a very
conservative threshold for the occurrence of turbulence, especially when working with the 10-s data. Thus, turbulence
probably also occurred at other altitudes or in deeper layers.
www.atmos-chem-phys.net/7/913/2007/
A. Stohl et al.: Asian pollution over Europe
4.4 Aerosol characterization
Regarding the aerosol characterization, we focus our analysis on flight A because the frequent encounter of aircraft
contrails and the large variability of the measured data obtained during flight B made it difficult to determine some of
the aerosol parameters. Figure 15 presents the time series
of the number concentrations of nucleation mode, Aitken,
and accumulation mode particles measured during flight A,
and Table 4 lists the mean values and 90-percentiles of various aerosol parameters for different segments of flight A.
The segments of the Asian plume penetrations I–IV are the
same as used previously (Fig. 10) but the periods NA-I, NAII and BG-I, BG-II, BG-III could not be used to determine
average aerosol parameters because the PSAP measurements
require a constant flight altitude. Furthermore, some of these
sequences contained cloudy periods, which had very different aerosol characteristics than the cloud-free periods. Therefore, for comparison with the Asian plume values in Table 4
we present averages over two periods with less influence
from Asian pollution, one non-cloudy sequence (FT, from
11:52:25 to 11:58:59 UTC, corresponding approximately to
BG-I in Fig. 15), and one sequence in cirrus clouds (FT cirrus, from 13:01:30 to 13:07:15 UTC, corresponding to the
first part of BG-III in Fig. 15).
The nucleation mode and Aitken particle number concentrations are lowest in the relatively clean cirrus cloud sequence and highest in the also relatively clean FT sequence
(Table 4). The high concentrations in the cloud-free FT sequence are likely the result of new particle formation, which
is known to be particularly effective in the outflow of clouds
(Perry and Hobbs, 1994), and the FT air mass was lifted in
www.atmos-chem-phys.net/7/913/2007/
NA
BG
I
II
III
IV
1000
-3
Number concentration (scm )
This shows that the turbulent mixing was still active when the
measurements were taken. Asian pollution was also mixed
into the stratosphere, since the CO mixing ratios at the highest flight altitudes, already in the stratosphere, were clearly
above the normal stratospheric mixing ratios. In fact, much
lower CO mixing ratios were found at 11 km a few minutes
after the vertical profile shown in Fig. 14 was completed (see
Fig. 12). The meteorological situation was favorable for this
mixing to occur, since stratospheric air masses descended
on the rear of the trough located over Europe on 25 March
(Fig. 2h).
Pollution from Eastern Asia is very often lifted by warm
conveyor belts to altitudes near the tropopause (Stohl, 2001;
Eckhardt et al., 2004), which was also the case here. Eckhardt et al. (2004) found in their model study that approximately 6% of the mass of the warm conveyor belts ascending
over the North Pacific can be found in the stratosphere after
5 days. Thus, we suggest that the mixing of stratospheric
air into the Asian pollution in the troposphere, as well as
the mixing of Asian pollution into the stratosphere, both of
which were observed during flight B, are characteristic features of Asian pollution plumes.
931
100
10
1
100
110
120
130
140
CO (ppb)
150
160
170
180
Fig. 16. Scatter plot of the number concentrations of accumulation mode aerosols versus CO for various sections of flight A, with
added regression lines through the data where correlations are significant. The data are shown for the Asian plume penetrations I–IV,
and combined North American plume encounters NA-I and NA-2,
as well as combined “background” conditions BG-I, BG-II and BGIII as defined in Fig. 10. For period II, a 1.5-min segment containing an unexplained spike in the accumulation mode aerosol number
concentrations (see Fig. 15) was removed from the correlation analysis.
the WCB. Compared to the FT segment, the Aitken and, particularly, the nucleation mode particles are suppressed during the Asian plume penetrations I–IV. A correlation analysis with CO (Table 5) reveals no systematic dependence
of nucleation mode and Aitken particles on the CO levels:
There is little correlation for periods I and IV, a strong positive correlation for period II, and a strong negative correlation for period III, as can also be seen in Fig. 15. Thus, it
seems that new particle formation was generally suppressed
in the Asian pollution plume, likely due to the high concentrations of transported larger particles (see below). However,
the actual variability in nucleation mode particles within the
plume cannot be explained by simple correlations with CO
and, thus, does not primarily depend on the pollution load.
Other factors, such as the degree of previous cloud processing, the relative humidity, and occasional encounters of cirrus
clouds during period II, seem to have been more important.
Accumulation mode particles are strongly enhanced during the Asian pollution plume penetrations I–IV, with mean
number concentrations about a factor of three higher than
during periods FT and “FT cirrus” (Table 4). The mean
concentrations are also higher than during the rest of the
flight, except for a maximum during period BG-III, which
is probably related to a cirrus cloud encounter where breaking ice crystals disturb the PCASP measurements, and except
for the high concentrations in the boundary layer just after
the take-off and before landing (Fig. 15). There are strong
positive correlations of accumulation mode particle number
Atmos. Chem. Phys., 7, 913–937, 2007
932
A. Stohl et al.: Asian pollution over Europe
Table 4. Mean and 90-percentile (P90) particle number concentrations for the Asian plume encounters I–IV of flight A (see Fig. 10). For
comparison, a non-cloudy period with less influence from Asian pollution (FT, from 11:52:25 to 11:58:59 UTC, corresponding approximately
to BG-I in Fig. 10) and a relatively clean sequence in cirrus clouds (FT cirrus, from 13:01:30 to 13:07:15 UTC, corresponding to the first
part of BG-III in Fig. 10) are also shown. Values in parenthesis give the standard deviation of the average over the analysed time sequence,
i.e., they reflect atmospheric variability. Number concentration values are given for standard conditions (273 K, 1013 hPa) which correspond
to altitude invariant mixing ratios.
Period
II
III
IV
mean
AITK
P90
AITK
mean
ACC
P90
ACC
scm−3
scm−3
scm−3
scm−3
scm−3
110
(68)
215
(105)
204
(55)
214
(70)
168
524
(235)
888
(324)
1261
(167)
1101
(337)
728
26
(18)
40
(12)
30
(17)
31
(16)
52
I–IV mean
FT
342
(38)
46
(18)
341
262
285
186
FT cirrus
mean
AITK
nonvol
scm−3
1260
1427
1613
944
396
1312
(93)
270
(56)
67
68
46
53
32
1420
328
P90
AITK
nonvol
scm−3
Fnonvol σap
(AITK)
%
Mm−1
102
(44)
207
(71)
255
(42)
216
(61)
P90
NUC
scm−3
I
mean
NUC
165
20
(5)
24
(3)
21
(5)
21
(7)
0.25
286
327
296
195
12
(5)
10
(10)
20
0.40
0.70
22
150
(14)
40
(12)
18
n.a.#
166
49
11
(1)
15
(3)
<0.10
<0.10
# For sequence II, the PSAP signal was corrupted by cirrus cloud encounters.
Table 5. Correlations between the number concentrations of nucleation mode, Aitken, and accumulation mode aerosols, respectively, and
CO during the periods NA-I, NA-II, and Asian plume encounters I–IV of flight A as defined in Fig. 10. Squared correlation coefficients (r2 )
and slopes of the regression lines are reported. For period II, a 1.5-min segment containing an unexplained spike in the accumulation mode
aerosol number concentrations (see Fig. 15 was removed from the correlation analysis.
Period
NUC/ CO
scm−3 ppbv−3
r2
AITK/ CO
scm−3 ppbv−3
r2
ACC/ CO
scm−3 ppbv−3
r2
NA-I
NA-II
I
II
III
IV
−8.1
47.5
1.3
4.6
−2.0
−2.4
0.11
0.09
0.08
0.57
0.45
0.18
−14.6
16.5
6.76
16.3
−9.8
−12.2
0.02
0.02
0.13
0.74
0.68
0.21
0.1
16.5
1.5
0.8
1.1
1.1
0.00
0.07
0.57
0.51
0.84
0.80
concentrations with CO during all Asian plume encounters
(Table 5) with consistent slopes of 1.1±0.35 scm−3 ppbv−3
CO. A scatter plot (Fig. 16) shows that these tight correlations occur only during the Asian plume encounters, whereas
the data for the remainder of the flight are poorly correlated
(see also Table 5 and Fig. 15). The correlation coefficient for
period II is the lowest of all found for the Asian plume encounters. This is probably related to cirrus cloud encounters
during that period. In summary, this provides clear evidence
for the long-range transport of accumulation mode aerosols
from Asia to Europe.
Atmos. Chem. Phys., 7, 913–937, 2007
Figure 17 shows the aerosol number and volume size distributions from the accumulation mode to the coarse particle
mode, for the Asian plume penetrations I–IV and for the FT
segment. The greater concentrations of accumulation mode
aerosols in the Asian plume extend to a size of about 0.5 µm.
For larger particle sizes, the periods I and FT show larger
particle concentrations than periods II, III and IV. In fact,
the period I and FT size distributions indicate the presence
of a relatively large number of super-micron particles, whose
contribution to the total particle volume (and particle mass) is
comparable to those of the accumulation mode aerosols. The
www.atmos-chem-phys.net/7/913/2007/
A. Stohl et al.: Asian pollution over Europe
933
Fig. 17. Average aerosol size distributions for the Asian plume penetrations during sequences I, II, III and IV of flight A, and for a relatively
clean sequence (FT) as specified in Table 4. Number densities are shown in the top panel, and volume densities in the bottom panel.
FLEXPART retroplumes suggest that the air masses sampled
during periods FT and I originated from slightly further north
in Asia than the air masses sampled later. In particular, they
travelled over potential dust emission areas such as the Gobi
and Takla-Makan deserts and, thus, are more likely to have
picked up desert dust than the air masses flown through in
segments II, III and IV (see modeling products available at
ETC/). In summary, we conclude that the air masses encountered during
period FT contained mostly desert dust, periods II, III, and IV
contained mostly anthropogenic pollution aerosols in the accumulation mode, and period I contained a mixture of both.
In fact, in Asia it is quite typical that anthropogenic pollution mixes with desert dust (Arimoto et al., 2006). It is also
known that the dust can be transported over intercontinental
distances (Husar et al., 2001), and Asian dust-pollution mixtures have also been observed over North America (Price et
al., 2004).
The fraction of non-volatile Aitken particles in the Asian
plume (20–24%) is about twice as high as for the background period FT and 50% higher than during “FT cirrus”
(Table 4). Furthermore, the light absorption coefficient in the
www.atmos-chem-phys.net/7/913/2007/
Asian plume (Table 4) is enhanced (0.25–0.70 Mm−1 , corresponding to 0.04–0.09 µg m−3 EBC) compared to the background conditions (<0.1 Mm−1 ). Since BC is an important
component of the non-volatile fraction of the aerosols and
is also responsible for the bulk of the light absorption, we
conclude that BC was enhanced in the Asian plume. The
observed fraction of non-volatile Aitken particles is typical
for FFC emissions. Engler et al. (2006) report, e.g., a number fraction of 17% for non-volatile particles in an urban
environment. On the other hand, previous observations in
BB plumes transported from North America to Europe indicate that most of the Aitken particles were internally mixed
and had a non-volatile core, i.e., a much larger fraction of
non-volatile Aitken particles (Petzold et al., 20072 ). Thus,
the contribution of BB to the aerosols observed in the Asian
plume was probably small.
2 Petzold, A., Weinzierl, B., Huntrieser, H., Stohl, A., Real, E., et
al.: Perturbation of the European free troposphere aerosol by North
American forest fire plumes during the ICARTT-ITOP experiment
in summer 2004, Atmos. Chem. Phys. Discuss., in preparation,
2007.
Atmos. Chem. Phys., 7, 913–937, 2007
934
5
A. Stohl et al.: Asian pollution over Europe
Conclusions
For the first time, we have intentionally flown a research aircraft over Europe into a pollution plume originating from
Asia, which had travelled over an almost hemispheric-scale
distance across the North Pacific, North America, and the
North Atlantic to Europe. The aircraft carried a large suite of
instruments for trace gas and aerosol measurements, which
allowed a detailed characterization of the chemical composition and aerosol content of the Asian pollution plume. The
plume was sampled on two subsequent days, on the first day
west of Spain in an otherwise largely unperturbed environment; on the second day, over Southern Europe, when the
plume was already mixing with stratospheric air masses and
was also contaminated by aircraft emissions over the continent. Our conclusions from this study are the following:
– There was excellent agreement between the transport
of the Asian pollution plume as simulated by FLEXPART and CO retrieved from AIRS for the entire transport event. The FLEXPART forecasts were accurate
enough to successfully guide the aircraft into this pollution plume, which had travelled over an almost hemispheric distance. Though the internal plume variability
was not well resolved by the model and the plume was
predicted at somewhat too high altitudes, the geographical location of the plume was well predicted. The Asian
plume was found on both days and, during each flight,
was penetrated several times.
– On the first day, CO was increased by 17–34 ppbv on average (maximum 60 ppbv) during different plume penetrations, and O3 was increased by 2–9 ppbv on average
(maximum 22 ppbv), over a background that was itself
likely elevated by Asian emissions. NOy concentrations
were also clearly increased (0.26–0.36 ppbv).
– Trace gas correlations between CO, NOy and O3 were
all positive for flight A, indicating net ozone formation
in the Asian plume. The observed O3 / CO slopes
of 0.22–0.30 indicate a moderate ozone production efficiency, in agreement with previous observations in
Asian pollution plumes. The very low NOy / CO
slopes of 0.0041–0.0049 indicate that most of the NOy
emitted in Asia had already been removed from the air
mass before the aircraft sampled it.
– Nucleation mode and Aitken particles were reduced
in the Asian pollution plume, probably due to large
concentrations of pre-existing transported accumulation
mode aerosols. The accumulation mode aerosols were
clearly enhanced in the pollution plume and well correlated with CO. The aerosol light absorption coefficient
and the fraction of non-volatile Aitken particles were
also enhanced, pointing towards increased BC levels in
the Asian plume. Furthermore, in parts of the Asian
Atmos. Chem. Phys., 7, 913–937, 2007
plume but also in some neighboring cleaner air masses
large concentrations of coarse particles were found, suggesting transport of desert dust from Asia.
– On the second day, the Asian pollution plume was observed to be mixing with stratospheric air. While stratospheric air was mixing into the tropospheric pollution
plume, the Asian pollution was also mixing into the
stratosphere. The mixing was due to turbulence which
was still active at the time of the flight, as is suggested
by the measured vertical profiles of potential temperature and derived Richardson numbers, as well as turbulence encounters reported by the mission scientist on
board the aircraft. The correlations between the trace
gases O3 , CO and NOy clearly show the effect of this
mixing. This may be a characteristic feature of Asian
pollution plumes because over the North Pacific Ocean
they are typically transported into the upper troposphere
where the chances of mixing with stratospheric air are
largest.
Acknowledgements. We would like to thank M. Lichtenstern,
P. Stock, H. Ră ba (DLR-IPA) and the crew of the DLR-FB for their
u
help in acquiring this data set. We thank the University of Maryland
for providing their global land cover dataset, as well as the MODIS
fire detections from their ftp server />The flight hours were sponsored by the European Commission in
the framework of EUFAR, and the research was supported by the
Norwegian Research Council (project 169839/D 15). We thank the
reviewers for their comments.
Edited by: R. Cohen
References
Andreae, M. O., Berresheim, H., Andreae, T. W., et al.: Vertical
distribution of dimethylsulfide, sulfur dioxide, aerosol ions, and
radon over the North-East Pacific Ocean, J. Atmos. Chem., 6,
149–173, 1988.
Arimoto, R., Kim, Y. J., Kim, Y. P., Quinn, P. K., Bates, T. S., et al.:
Characterization of Asian dust during ACE-Asia, Glob. Planet.
Change, 52, 2356, 2006.
Arnott, W. P., Moosmă ller, H., Sheridan, P. J., Ogren, J. A.,
u
Raspet, R., Slaton, W. V., Hand, J. L., Kreidenweis, S. M.,
and Collett Jr., J. L.: Photoacoustic and filter-based ambient
aerosol light absorption measurements: Instrument comparisons
and the role of relative humidity, J. Geophys. Res., 108, 4034,
doi:10.1029/2002JD002165, 2003.
Auvray, M. and Bey I.: Long-range transport to Europe: Seasonal
variations and implications for the European ozone budget, J.
Geophys. Res., 110, D11303, doi:10.1029/2004JD005503, 2005.
Berntsen, T. K., Karlsdottir, S., and Jaffe, D. A: Influence of Asian
emissions on the composition of air reaching the North Western
United States, Geophys. Res. Lett., 26, 22 171–22 174, 1999.
Bond, T. C., Anderson, T. L., and Campbell, D.: Calibration and
intercomparison of filter-based measurements of visible light absorption by aerosols, Aerosol Sci. Technol., 30, 582–600, 1999.
www.atmos-chem-phys.net/7/913/2007/
A. Stohl et al.: Asian pollution over Europe
Bond, T. C. and Bergstrom, R. W.: Light absorption by carbonaceous particles: An investigative review, Aerosol Sci. Technol.,
40, 27–67, 2006.
Cooper, O. F., C., Parrish, D., Dunlea, E., Hă bler, G., Fehsenfeld,
u
F., Holloway, J.,Oltmans, S., Johnson, B., Wimmers, A., and
Horowitz, L.: On the life cycle of a stratospheric intrusion and its
dispersion into polluted warm conveyor belts, J. Geophys. Res.,
109, D23S09, doi:10.1029/2003JD004006, 2004.
Cooper, O. R., Forster, C., Parrish, D., Trainer, M., Dunlea, E., Ryerson, T., Hă bler, G., Fehsenfeld, F., Nicks, D., Holloway, J., de
u
Gouw, J., Warneke, C., Roberts, J. M., Flocke, F., and Moody, J.:
A case study of transpacific warm conveyor belt transport: Influence of merging airstreams on trace gas import to North America,
J. Geophys. Res., 109, D23S08, doi:10.1029/2003JD003624,
2004.
Damoah, R., Spichtinger, N., Forster, C., James, P., Mattis, I.,
Wandinger, U., Beirle, S., and Stohl, A.: Around the world in
17 days – hemispheric-scale transport of forest fire smoke from
Russia in May 2003, Atmos. Chem. Phys., 4, 1311–1321, 2004,
/>Eckhardt, S., Stohl, A., Wernli, H., James, P., Forster, C., and
Spichtinger, N.: A 15-year climatology of warm conveyor belts,
J. Climate, 17, 218–237, 2004.
ˇ
Emanuel, K. A. and Zivkovi´ -Rothman, M.: Development and evalc
uation of a convection scheme for use in climate models, J. Atmos. Sci., 56, 1766–1782, 1999.
Engler, C., Rose, D., Wehner, B., Wiedensohler, S. A.,
Br/”uggemann, E., Gnauk, T., Spindler, G., Tuch, T., and Birmili, W.: Size distribution of non-volatile particle residuals
(Dp <800 nm) at a rural site in Germany and relation to air mass
origin, Atmos. Chem. Phys. Discuss., 6, 5505–5542, 2006,
/>Feldpausch, P, Fiebig, M., Fritzsche, L., and Petzold, A.: Measurement of ultrafine aerosol size distributions by a combination of
diffusion screen separators and condensation particle counters, J.
Aerosol Sci., 37, 577–597, doi:10.1016/j.jaerosci.2005.04.009,
2006.
Fiebig, M.: The tropospheric aerosol at mid-latitudes – microphysics, optics and climate forcing illustrated by the LACE 98
field study, Doctoral thesis Ludwig-Maximilians-University Munich, DLR Research report FB 2001-23, 259 pages, 2001.
Fiebig, M., Petzold, A., Wandinger, U., Wendisch, M., Kiemle, C.,
Stifter, A., Ebert, M., Rother, T., and Leiterer, U.: Optical closure
for an aerosol column: Method accuracy, and inferable properties
applied to a biomass-burning aerosol and its radiative forcing, J.
Geophys. Res., 107, 8130, doi:10.1029/2000JD000192, 2002.
Forster, C., Wandinger, U., Wotawa, G., James, P., Mattis, I., Althausen, D., Simmonds, P., O’Doherty, S., Kleefeld, C., Jennings, S. G., Schneider, J., Trickl, T., Kreipl, S., Jă ger, H., Stohl,
a
A.: Transport of boreal forest fire emissions from Canada to Europe, J. Geophys. Res., 106, 22 887–22 906, 2001.
Forster, C., Cooper, O., Stohl, A., Eckhardt, S., James, P., Dunlea, E., Nicks Jr., D. K., Holloway, J. S., Hă bler, G., Parrish,
u
D. D., Ryerson, T. B., and Trainer, M.: Lagrangian transport
model forecasts and a transport climatology for the Intercontinental Transport and Chemical Transformation 2002 (ITCT
2k2) measurement campaign. J. Geophys Res. 109, D07S92,
doi:10.1029/2003JD003589, 2004.
Forster, C., Stohl, A., and Seibert, P.: Parameterization of convec-
www.atmos-chem-phys.net/7/913/2007/
935
tive transport in a Lagrangian particle dispersion model and its
evaluation, J. Appl. Meteor., in press, 2007.
Frost, G. J., McKeen, S. A., Trainer, M., Ryerson, T. B., Neuman,
J. A., et al.: Effects of changing power plant NOx emissions on
ozone in the eastern United States: Proof of concept, J. Geophys
Res., 111, D12306, doi:10.1029/2005JD006354, 2006.
Gerbig, C., Kley, D., Volz-Thomas, A., Kent, J., Dewey, K., and
McKenna, D. S.: Fast response resonance fluorescence CO measurements aboard the C-130: Instrument characterization and
measurements made during North Atlantic Regional Experiment
1993, J. Geophys. Res., 101, 29 229–29 238, 1996.
Giglio, L., Descloitres, J., Justice, C. O., and Kaufman, Y.: An
enhanced contextual fire detection algorithm for MODIS, Rem.
Sens. Environ., 87, 273–282, 2003.
Grousset, F., Ginoux, P., Bory, A., and Biscaye, P.: Case study of
a Chinese dust plume reaching the French Alps, Geophys. Res.
Lett., 30, 1277, doi:10.1029/2002GL016833, 2003.
Hansen, M., DeFries, R., Townshend, J. R. G., and Sohlberg, R.:
Global land cover classification at 1 km resolution using a decision tree classifier, Intern. J. Rem. Sensing., 21, 1331–1365,
2000.
Haywood, J. M., Osborne, S. O., Francis, P. N., Keil, A., Formenti,
P., Adreae, M. O., and Kaye, P. H.: The mean physical and optical properties of regional haze dominated by biomass burning
aerosol measured from the C-130 aircraft during SAFARI 2000,
J. Geophys. Res., 108, 8473, doi:1029/2002JD002226, 2003.
Honrath, R. E., Owen, R. C., Val Martin, M., Reid, J. S., Lapina,
K., Fialho, P., Dziobak, M. P., Kleissl, J., and Westphal, D. L.:
Regional and hemispheric impacts of anthropogenic and biomass
burning emissions on summertime CO and O3 in the North Atlantic lower free troposphere, J. Geophys. Res., 109, D24310,
doi:10.1029/2004JD005147, 2004.
Hudman R. C., Jacob, D. J., Cooper, O. R., Evans, M. J., Heald,
C. L., et al.: Ozone production in transpacific Asian pollution plumes and implications for ozone air quality in California,
J. Geophys. Res., 109, D23S10, doi:10.1029/2004JD004974,
2004.
Huntrieser, H., Heland, J., Schlager, H., Forster, C., Stohl, A.,
Aufmhoff, H., Arnold, F., Scheel, H. E., Campana, M., Gilge,
S., Eixmann, R., and Cooper, O.: Intercontinental air pollution
transport from North America to Europe: Experimental evidence
from aircraft measurements and surface observations, J. Geophys. Res., 110, DO1305, doi:10.1029/2004JD005045, 2005.
Husar, R. B., Tratt, D. M., Schichtel, B. A., Falke, S. R., Li, F.,
et al.: Asian dust events of April 1998, J. Geophys. Res., 106,
18 317–18 330, 2001.
Jacob, D. J., Logan, J. A., and Murti, P. P.: Effect of rising Asian
emissions on surface ozone in the United States, Geophys. Res.
Lett., 26, 2175–2178, 1999.
Jaffe, D., Anderson, T., Covert, D., Kotchenruther, R., Trost, B.,
Danielson, J., Simpson, W., Berntsen, T., Karlsdottir, S., Blake,
D., Harris, J., Carmichael, G., and Uno, I.: Transport of Asian air
pollution to North America, Geophys. Res. Lett., 26, 711– 714,
1999.
Koike, M., Kondo, Y., Kita, K., Takegawa, N., Masui, Y., et al.:
Export of anthropogenic reactive nitrogen and sulfur compounds
from the East Asia region in spring, J. Geophys. Res., 108(D20),
8789, doi:10.1029/2002JD003284, 2003.
Lawrence, M. G., Rasch, P. J., von Kuhlmann, R., Williams, J., Fis-
Atmos. Chem. Phys., 7, 913–937, 2007
936
cher, H., de Reus, M., Lelieveld, J., Crutzen, P. J., Schultz, M.,
Stier, P., Huntrieser, H., Heland, J., Stohl, A., Forster, C., Elbern,
H., Jakobs, H., and Dickerson, R. R.: Global chemical weather
forecasts for field campaign planning: predictions and observations of large-scale features during MINOS, CONTRACE and
INDOEX. Atmos. Chem. Phys. 3, 267–289, 2003.
Lelieveld, J., Berresheim, H., Borrmann, S., Crutzen, P. J., Dentener, F. J., Fischer, H., Feichter, J., Flatau, P. J., Heland,
J., Holzinger, R., Korrmann, R., Lawrence, M. G., Levin, Z.,
Markowicz, K. M., Mihalopoulos, N., Minikin, A., Ramanathan,
V., de Reus, M., Roelofs, G. J., Scheeren, H. A., Sciare, J.,
Schlager, H., Schultz, M., Siegmund, P., Steil, B., Stephanou,
E. G., Stier, P., Traub, M.,Warneke, C.,Williams, J., and Ziereis,
H.: Global Air Pollution Crossroads over the Mediterranean, Science, 298, 794–799, 2002.
Li, Q. B., Jacob, D. J., Bey, I., Palmer, P. I., Duncan, B. N., Field, B.
D., Martin, R. V., Fiore, A. M., Yantosca, R. M., Parrish, D. D.,
Simmonds, P. G., Oltmans, S. J.: Transatlantic transport of pollution and its effects on surface ozone in Europe and North America, J. Geophys. Res., 107, 4166, doi:10.1029/2001JD001422,
2002.
McMillan, W. W., Barnet, C., Strow, L., Chahine, M. T., McCourt
Comer, M., Novelli, P. C., Krontzi, S., Maddy, E. S., and Datta,
S.: Daily Global Maps of Carbon Monoxide: First Views from
NASA’s Atmospheric Ifrared Sounder, Geophys. Res. Lett., 32,
L11801, doi:10.1029/2004GL012821, 2005.
Miyazaki, Y., Kita, K., Kondo, Y., Koike, M., Ko, M., et al.:
Springtime photochemical ozone production observed in the upper troposphere over east Asia, J. Geophys. Res., 108(D3), 8398,
doi:10.1029/2001JD000811, 2003.
Miyazaki, Y., Kondo, Y., Koike, M., Fuelberg, H. E., Kiley, C.
M., et al: Synoptic-scale transport of reactive nitrogen over
the western Pacific in spring, J. Geophys. Res., 108, 8788,
doi:10.1029/2002JD003248, 2003.
Olivier, J. G. J. and Berdowski, J. J. M.: Global emissions sources
and sinks, in: The Climate System, edited by: Berdowski, J.,
Guicherit, R., and Heij, B. J., pp. 33–78. A.A. Balkema Publishers/Swets & Zeitlinger Publishers, Lisse, The Netherlands. ISBN
90 5809 255 0, 2001.
Parrish, D. D., Trainer, M., Buhr, M. P., Watkins, B. A., and Fehsenfeld, F. C.: Carbon monoxide concentrations and their relation
to concentrations of total reactive oxidized nitrogen at two rural
U.S. sites, J. Geophys. Res., 96, 9309–9320, 1991.
Parrish, D. D., Holloway, J. S., Trainer, M., Murphy, P. C., Forbers,
G. L., and Fehsenfeld, F. C.: Relationships between ozone and
carbon monoxide at surface sites in the North Atlantic region, J.
Geophys. Res., 103, 13 357–13 376, 1998.
Parrish, D. D., Holloway, J. S., Jakoubek, R., Trainer, M., Ryerson,
T. B., Hă bler, G., Fehsenfeld, F. C., Moody, J. L., and Cooper, O.
u
R.: Mixing of anthropogenic pollution with stratospheric ozone:
A case study from the North Atlantic wintertime troposphere, J.
Geophys. Res., 105, 24 363–24 374, 2000.
Perry, K. D. and Hobbs, P. V.: Further evidence for particle nucleation in clear air adjacent to marine cumulus clouds, J. Geophys.
Res., 99, 22 803–22 818, 1994.
Petzold, A., Fiebig, M., Flentje, H., Keil, A., Leiterer, U., Stifter, A.,
Wendisch, M., and Wendling P.: Vertical variability of aerosol
properties observed at a continental site during LACE 98, J. Geophys. Res., 107, 8128, doi:10.1029/2001JD001043, 2002.
Atmos. Chem. Phys., 7, 913–937, 2007
A. Stohl et al.: Asian pollution over Europe
Pfister G., Petron, G., Emmons, L. K., Gille, J. C., Edwards, D.
P., et al.: Evaluation of CO simulations and the analysis of
the CO budget for Europe, J. Geophys. Res., 109, D19304,
doi:10.1029/2004JD004691, 2004.
Price, H. U., Jaffe, D. A., Cooper, O. R., and Doskey, P. V.: Photochemistry, ozone production, and dilution during long-range
transport episodes from Eurasia to the northwest United States,
J. Geophys. Res., 109, D23S13, doi:10.1029/2003JD004400,
2004.
Reeves, C. E., Claire, E., Penkett, S. A., et al.: Potential for photochemical ozone formation in the troposphere over the North
Atlantic as derived from aircraft observations during ACSOE, J.
Geophys. Res., 107, 4707, doi:10.1029/2002JD002415, 2002.
Russo, R. S., Talbot, R. W., Dibb, J. E., Scheuer, E., Seid, G., Jordan, C. E., Fuelberg, H. E., Sachse, G. W., Avery, M. A., Vay,
S. A., Blake, D. R., Blake, N. J., Atlas, E., Fried, A., Sandholm, S. T., Tan, D., Singh, H. B., Snow, J., and Heikes, B.
G.: Chemical composition of Asian continental outflow over the
western Pacific: Results from Transport and Chemical Evolution over the Pacific (TRACE-P), J. Geophys. Res., 108, 8804,
doi:10.1029/2002JD003184, 2003.
Schlager, H., Konopka, P., Schulte, P., Schumann, U., Ziereis, H.,
et al.: In situ observations of air traffic emission signatures in
the North Atlantic flight corridor, J. Geophys. Res., 102, 10 739
10 750, 1997.
Schră der, F. P. and Stră m, J.: Aircraft measurements of sub micromo
o
eter aerosol particles (>7 nm) in the midlatitude free troposphere
and tropopause region, Atmos. Res., 44, 333–356, 1997.
Seibert, P. and Frank, A.: Source-receptor matrix calculation with a
Lagrangian particle dispersion model in backward mode, Atmos.
Chem. Phys., 4, 51–63, 2004,
/>Stohl, A.: A one-year Lagrangian “climatology” of airstreams in the
northern hemisphere troposphere and lowermost stratosphere, J.
Geophys. Res., 106, 7263–7279, 2001.
Stohl, A. (Ed.): Intercontinental Transport of Air Pollutants.
Springer-Verlag, Heidelberg, ISBN: 3-540-20563-2, 325p, 2004.
Stohl, A., Hittenberger, M., and Wotawa, G.: Validation of the
Lagrangian particle dispersion model FLEXPART against large
scale tracer experiment data, Atmos. Environ., 32, 4245–4264,
1998.
Stohl, A. and Thomson, D. J.: A density correction for Lagrangian
particle dispersion models, Boundary-Layer Meteorol., 90, 155–
167, 1999.
Stohl, A. and Trickl, T.: A textbook example of long-range transport: Simultaneous observation of ozone maxima of stratospheric and North American origin in the free troposphere over
Europe, J. Geophys. Res., 104, 30 445–30 462, 1999.
Stohl, A., Eckhardt, S., Forster, C., James, P., and Spichtinger,
N.: On the pathways and timescales of intercontinental air pollution transport, J. Geophys. Res., 107, 4684,
doi:10.1029/2001JD001396, 2002.
Stohl, A., Trainer, M., Ryerson, T., Holloway, J., and Parrish,
D.: Export of NOy from the North American boundary layer
during NARE 96 and NARE 97, J. Geophys. Res. 107, 4131,
doi:10.1029/2001JD000519, 2002.
Stohl, A., Forster, C. Eckhardt, S., Spichtinger, N., Huntrieser, H.,
Heland, J., Schlager, H., Wilhelm, S., Arnold, F., and Cooper, O.:
A backward modeling study of intercontinental pollution trans-
www.atmos-chem-phys.net/7/913/2007/
A. Stohl et al.: Asian pollution over Europe
port using aircraft measurements, J. Geophys. Res., 108, 4370,
doi:10.1029/2002JD002862, 2003.
Stohl, A., Forster, C., Frank, A., Seibert, P., and Wotawa, G.: Technical note: The Lagrangian particle dispersion model FLEXPART version 6.2., Atmos. Chem. Phys., 5, 2461–2474, 2005,
/>Stohl, A., Berg, J. F. Burkhart, T., Fjæraa, A. M., Forster, C., Herber,
A., Hov, Ø, Lunder, C., McMillan, W. W., Oltmans, S., Shiobara,
M., Simpson, D., Solberg, S., Stebel, K., Stră m, J., Tứrseth, K.,
o
Treffeisen, R., Virkkunen, K., and Yttri, K.-E.: Arctic smoke
– record high air pollution levels in the European Arctic due to
agricultural fires in Eastern Europe, Atmos. Chem. Phys., 7, 511–
534, 2007,
/>Stull, R. B.: An Introduction to Boundary Layer Meteorology,
Kluwer Academic Publishers, Dordrecht, 1988.
Takegawa, N., Kondo, Y., Koike, M., Chen, G., Machida, T., et al.:
Removal of NOx and NOy in Asian outflow plumes: Aircraft
measurements over the western Pacific in January 2002, J. Geophys. Res., 109, D23S04, doi:10.1029/2004JD004866, 2004.
Traub, M., Fischer, H., de Reus, M., Kormann, R., Heland, J.,
Ziereis, H., Schlager, H., Holzinger, R., Williams, J., Warneke,
C., de Gouw, J., and Lelieveld, J.: Chemical characteristics assigned to trajectory clusters during the MINOS campaign, Atmos. Chem. Phys., 3, 459–468, 2003,
/>
www.atmos-chem-phys.net/7/913/2007/
937
Trickl, T., Cooper, O., Eisele, H., James, P.,Mă cke, R., and Stohl,
u
A: Intercontinental transport and its influence on the ozone concentrations over central Europe: Three case studies, J. Geophys.
Res., 108, 8530, doi:10.1029/2002JD002735, 2003.
Wang, T., Cheung, T. F., Li, Y. S., Yu, X. M., and Blake, D. R.:
Emission characteristics of CO, NOx , SO2 and indications of
biomass burning observed at a rural site in eastern China, J. Geophys. Res., 107, 4157, doi:10.1029/2001JD000724, 2002.
White, P. W. (Ed.): IFS Documentation, ECMWF, Reading, UK,
2002.
Wild, O. and Akimoto, H.: Intercontinental transport of ozone and
its precursors in a three-dimensional global CTM, J. Geophys.
Res., 106, 27 729–27 744, 2001.
Wotawa, G. and Trainer, M.: The Influence of Canadian Forest Fires
on Pollutant Concentrations in the United States, Science, 288,
324–328, 2000.
Ziereis, H., Schlager, H., Schulte, P., Kă hler, I., Marquardt, R., and
o
Feigl, C.: In situ measurements of the NOx distribution and variability over the eastern North Atlantic, J. Geophys. Res., 104,
16 021–16 032, 1999.
Atmos. Chem. Phys., 7, 913–937, 2007