Expendable Missiles vs. Reusable Platform Costs and Historical Data pdf
Bạn đang xem bản rút gọn của tài liệu. Xem và tải ngay bản đầy đủ của tài liệu tại đây (208.42 KB, 27 trang )
For More Information
Visit RAND at www.rand.org
Explore RAND Project AIR FORCE
View document details
Support RAND
Purchase this document
Browse Reports & Bookstore
Make a charitable contribution
Limited Electronic Distribution Rights
is document and trademark(s) contained herein are protected by law as indicated in a notice appearing
later in this work. is electronic representation of RAND intellectual property is provided for non-
commercial use only. Unauthorized posting of RAND electronic documents to a non-RAND website is
prohibited. RAND electronic documents are protected under copyright law. Permission is required from
RAND to reproduce, or reuse in another form, any of our research documents for commercial use. For
information on reprint and linking permissions, please see RAND Permissions.
Skip all front matter: Jump to Page 16
e RAND Corporation is a nonprot institution that helps improve policy and
decisionmaking through research and analysis.
is electronic document was made available from www.rand.org as a public service
of the RAND Corporation.
CHILDREN AND FAMILIES
EDUCATION AND THE ARTS
ENERGY AND ENVIRONMENT
HEALTH AND HEALTH CARE
INFRASTRUCTURE AND
TRANSPORTATION
INTERNATIONAL AFFAIRS
LAW AND BUSINESS
NATIONAL SECURITY
POPULATION AND AGING
PUBLIC SAFETY
SCIENCE AND TECHNOLOGY
TERRORISM AND
HOMELAND SECURITY
This product is part of the RAND Corporation technical report series. Reports may
include research findings on a specific topic that is limited in scope; present discussions
of the methodology employed in research; provide literature reviews, survey instru-
ments, modeling exercises, guidelines for practitioners and research professionals, and
supporting documentation; or deliver preliminary findings. All RAND reports un-
dergo rigorous peer review to ensure that they meet high standards for research quality
and objectivity.
TECHNICAL REPORT
Expendable Missiles vs. Reusable
Platform Costs and Historical Data
Thomas Hamilton
PROJECT AIR FORCE
Prepared for the United States Air Force
Approved for public release; distribution unlimited
The RAND Corporation is a nonprofit institution that helps improve policy and
decisionmaking through research and analysis. RAND’s publications do not necessarily
reflect the opinions of its research clients and sponsors.
R
®
is a registered trademark.
© Copyright 2012 RAND Corporation
Permission is given to duplicate this document for personal use only, as long as it
is unaltered and complete. Copies may not be duplicated for commercial purposes.
Unauthorized posting of RAND documents to a non-RAND website is prohibited. RAND
documents are protected under copyright law. For information on reprint and linking
permissions, please visit the RAND permissions page (
permissions.html).
Published 2012 by the RAND Corporation
1776 Main Street, P.O. Box 2138, Santa Monica, CA 90407-2138
1200 South Hayes Street, Arlington, VA 22202-5050
4570 Fifth Avenue, Suite 600, Pittsburgh, PA 15213-2665
RAND URL:
To order RAND documents or to obtain additional information, contact
Distribution Services: Telephone: (310) 451-7002;
Fax: (310) 451-6915; Email:
Library of Congress Cataloging-in-Publication Data
Hamilton, Thomas.
Expendable missiles vs. reusable platform costs and historical data / Thomas Hamilton.
p. cm.
Includes bibliographical references.
ISBN 978-0-8330-7455-3 (pbk. : alk. paper)
1. Air warfare—United States—Economic aspects. 2. Air-to-surface missiles—Cost effectiveness. 3. Bombing,
Aerial—United States. 4. Precision guided munitions—United States. 5. United States—Armed Forces—
Weapons systems-—Cost effectiveness. 6. Bombardment. I. Title.
UG633.H356 2012
358.4'2820973—dc23
2012033365
The research described in this report was sponsored by the United States Air Force under
Contract FA7014-06-C-0001. Further information may be obtained from the Strategic
Planning Division, Directorate of Plans, Hq USAF.
iii
Preface
is RAND Project AIR FORCE report documents research performed in scal year 2010,
in support of the Vice Chief of Sta, U.S. Air Force, that analyzed the historical use of air-to-
ground attack. is work was intended to support decisionmaking concerning the need for the
United States to have a substantial capability to conduct air-to-ground attack in the future. In
particular, this report investigates why it is cost-prohibitive to rely exclusively on cruise missiles
or similar expendable weapon systems in the event that the United States faces the possibility
of conicts comparable in duration and intensity to those of the past. e intended audience is
policymakers at all levels of government. e issues addressed in this report are also outlined
in RAND publication WR-778-AF (Hamilton, 2010).
RAND Project AIR FORCE
RAND Project AIR FORCE (PAF), a division of the RAND Corporation, is the U.S. Air
Force’s federally funded research and development center for studies and analyses. PAF pro-
vides the Air Force with independent analyses of policy alternatives aecting the development,
employment, combat readiness, and support of current and future air, space, and cyber forces.
Research is conducted in four programs: Force Modernization and Employment; Manpower,
Personnel, and Training; Resource Management; and Strategy and Doctrine.
Additional information about PAF is available on our website:
/>
v
Contents
Preface iii
Figures and Table
vii
Summary
ix
Expendable Missiles Versus Reusable Platform Costs and Historical Data
1
APPENDIXES
A. Model Assumptions and Methodology 7
B. Data Sources
9
C. Additional Cost Excursions
11
References
15
vii
Figures and Table
FIGURES
S.1. Reusable Versus Expendable Costs and Historical Conicts ix
1.1. Reusable Versus Expendable Cost Indierence Curve
1
1.2. Reusable Versus Expendable Costs and Historical Conicts
3
1.3. Reusable Versus Expendable (log scale)
4
1.4. Reusable Versus Expendable, with B-2 Bomb Capacity and Stando Missile Buy
4
1.5. Reusable Cost Excursions
5
C.1. Case with Doubled Reusable Aircraft Procurement Cost
11
C.2. Case with $3-Billion (procurement) Bomber with 40 Weapons
12
C.3. Case with Doubled Reusable Aircraft Procurement Cost
13
C.4. Case with Doubled Cruise Missile Procurement Cost
13
TABLE
A.1. Cost Assumptions 7
ix
Summary
e purpose of this report is to evaluate the economic wisdom of the United States adopting
policies that rely primarily on expendable weapons, such as cruise missiles, to conduct air-
to-ground strike missions. We examine the historical use of air-to-ground attack by the U.S.
military during and since the Vietnam War and examine when exclusive use of expendable
methods would be cost-prohibitive compared to using reusable weapon platforms. is analy-
sis focuses solely on cost and does not explore the range of capabilities of the dierent weapon
systems. us, conclusions do not address strategies involving a mix of reusable penetrating
aircraft and expendable munitions.
We analyzed campaigns in terms of two parameters: the average intensity of the conict
in average weapons delivered per day and the duration of the conict in days.
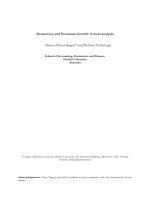
Figure S.1 summarizes both the historical data and our simple model for the sum of devel-
opment and procurement costs. e blue line is the cost indierence curve between conduct-
ing the campaign with long-range cruise missiles and conducting it with a new, 20,000-lb-pay-
load reusable aircraft. e line goes up sharply on the left side of the table, which corresponds
to relatively small campaigns. If the United States only has to prepare for small campaigns, the
Figure S.1
Reusable Versus Expendable Costs and Historical Conflicts
RAND TR1230-S.1
Conflict duration (days)
Intensity (strikes per day)
Equal cost
180
160
140
120
100
80
60
40
20
200
2,5002,0001,5001,0005000 3,000
0
Enduring
Freedom
(B-1 and B-52)
Allied
Force
(total)
Linebacker I
Linebacker II (B-52)
Desert Storm total
Rolling Thunder
(1,320 days duration)
1968 all B-52
Southeast Asia
Iraqi
Freedom
Desert
Storm
(B-52)
Niagara
(Khe Sanh,
B-52)
Deliberate
Force
Infinite
Reach
Desert Fox
Area where reusable is favored
Area where
expendable
is favored
x Expendable Missiles vs. Reusable Platform Costs and Historical Data
development cost of a reusable platform is an unnecessary expense. A few missiles will suce.
On the right side of the chart, the indierence curve becomes at. Whether exclusive reliance
on expendable platforms is cost-prohibitive depends entirely on the length of the conict. is
reects the fundamental fact that there is no point in buying a reusable platform if you are not
going to reuse it. e conict duration at which exclusive reliance on expendable platforms
becomes prohibitive depends on a number of assumptions about the cost, availability, and
utilization rates of weapon systems, but for any realistic possibilities, expendable platforms
become costly for conicts persisting on the order of ten days. Appendix A describes our base-
line cost assumptions. Appendix C describes several alternative cost assumptions.
Note that each of the major conicts in recent history depicted in Figure S.1 has lasted
longer than ten days. is analysis assumes that a reusable platform will be designed, pur-
chased, and used in only one conict. In reality, U.S. planning should be based on the total
number of days of conict for which the United States needs to be prepared over the lifetime
of a proposed reusable platform. Only if the United States is condent that all possible conicts
over the system lifetime can be ended in a total of less than about ten days is exclusive reliance
on expendable assets prudent.
is conclusion does not imply that expendable assets are not an important part of a
well-designed force mix. ere are important operational advantages to having at least some
expendable weapons that this report does not address.
However, if the United States wishes to maintain the capability to wage air war eciently
for more than a few days, reusable platforms are an important part of an ecient force mix.
is implies that, if the United States has a requirement for a substantial long-range strike
capability and if the existing bomber eet will for some reason, such as age or survivability,
not be able to meet that requirement in the future, the nation should take steps to have appro-
priate weapon systems available when needed. Dening appropriate weapon systems requires
analysis of alternative strategies relying on mixes of currently available expendable and reusable
platforms and/or new weapon systems.
1
Expendable Missiles Versus Reusable Platform Costs and
Historical Data
e purpose of this report is to evaluate the economic wisdom of the United States adopt-
ing policies that rely primarily on expensive expendable weapons, such as cruise missiles, to
conduct air-to-ground strike missions. We examine the historical use of air-to-ground attack
by the U.S. military during and since the Vietnam War and examine when exclusive use of
expendable methods would be cost-prohibitive compared to using reusable weapons platforms.
is analysis focuses solely on cost and does not explore the range of capabilities dierent
weapon systems oer. us, our conclusions do not address strategies involving a mix of reus-
able penetrating aircraft and expendable munitions.
is report does not examine many important aspects of this issue, such as range and
survivability. It is narrowly focused on how scenario properties aect the cost-eectiveness of
alternative approaches to strike.
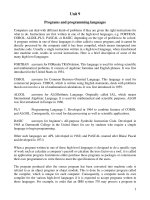
We chose to examine scenarios in the context of two variables. e horizontal axis in
Figure 1.1 represents intensity, dened as the average number of air-to-ground weapons deliv-
Figure 1.1
Reusable Versus Expendable Cost Indifference Curve
RAND TR1230-1.1
Conflict duration (days)
Intensity (strikes per day)
180
160
140
120
100
80
60
40
20
200
2,5002,0001,5001,0005000 3,000
0
Area where reusable is favored
Area where
expendable
is favored
Equal cost
2 Expendable Missiles vs. Reusable Platform Costs and Historical Data
ered per day over the period of the conict. e vertical axis represents the duration of the
conict in days. e blue line is the cost indierence curve.
e specic value of the cost indierence curve is determined by the set of cost assump-
tions detailed in Appendix A. is particular indierence curve was generated by comparing
the costs of a new, 20,000-lb-payload strike aircraft with the costs of cruise missiles red from
a converted commercial airliner. We focused on the general shape and approximate position
of the curve, not on any particular case. Appendix C shows explicitly that the important con-
clusions of this report are robust over a substantial range of specic cost assumptions. e
curve has the character shown whenever a strike system with a high cost per strike, such as an
expendable missile, is compared with a system with a high xed cost but lower cost per use,
such as a reusable aircraft.
1
e particular parameters—intensity and duration—were chosen partly because they are
well dened and readily available for historical events and partly because fairly simple math-
ematical analysis with them produces results that, we hope, provide useful insights.
In particular, the two asymptotes of the blue line have clear meanings. e close to verti-
cal part of the indierence curve on the far left side of the graph represents the case in which
very few total munitions are being used in the conict. If only a few strikes are required, the
requisite munitions can be purchased for less than the development cost of a new aircraft.
e increasingly at part of the line on the right side of the graph represents the case
in which the aircraft buy is suciently large that the total program cost is not dominated by
development costs. In this case, whether exclusive reliance on expendable platforms is cost-
prohibitive depends entirely on the length of the conict. One way to look at this issue is to
reect that there is little value in buying reusables if one is not going to reuse them. Reusable
systems will rarely be justied if one is condent that one does not need the capability to wage
war for more than a few days.
It is also important to note that looking at scenarios in this way undervalues the utility
of reusable platforms. An important quality of reusables is that they can be used in more than
one scenario. Indeed, if a modern aircraft has a lifetime of 30 or more years, it is likely to be
used in more than one conict.
Conversely, if a conict will last a long time, relying primarily on expendable munitions
becomes cost-prohibitive. e conict duration for which exclusive reliance on expendable
platforms becomes prohibitive depends on a number of assumptions about the cost, availabil-
ity, and utilization rates of weapon systems, but for any realistic possibilities, expendable plat-
forms become costly for conicts persisting on the order of ten days.
Furthermore, if a conict is fought using primarily expendables, it is possible that, even if
the United States wins the conict, the U.S. arsenal of expendable munitions at the conict’s
conclusion would be signicantly depleted, requiring additional procurement and possibly cre-
ating temporary risk to U.S. security. is analysis does not look at that eect.
Figure 1.2 is the same as the preceding gure, except that data from a range of historical
cases are added. e position of each mark on the horizontal axis represents the historical aver-
age number of weapons delivered per day, while the vertical position represents the number of
days the conict lasted. Details and sources of the data are described in Appendix B.
1
Strictly speaking, we are comparing a system with a relatively expensive penetrating platform and relatively cheap muni-
tions, such as glide bombs, against a system with a relatively cheap nonpenetrating aircraft, such as a commercial derivative,
carrying relatively expensive munitions, such as long-range cruise missiles.
Expendable Missiles Versus Reusable Platform Costs and Historical Data 3
As shown in Figure 1.2, some of the data points represent only munitions delivered by
bombers (B-52s in Vietnam and Desert Storm, and both B-52s and B-1s in Afghanistan). e
others represent all munitions delivered by air.
Figure 1.3 contains exactly the same data as the previous chart. Both axes have been
changed from linear to logarithmic. is form makes it easy to see that the indierence curve
is the sum of two simple lines. One line is proportional to the inverse of intensity. It reects the
fact that, if the war can be won with a small number of weapons, a development program for a
reusable aircraft is an unnecessary expense. e other line is at and simply reects the number
of days of war necessary for a reusable platform to justify its procurement.
e algebra underlying these two straight lines is described in detail in Appendix A.
Figure 1.4 is the same graph as in Figure 1.3 with added lines illustrating the bomb capac-
ity of the existing B-2 force and a possible stando missile buy. e chart shows that, if the
existing B-2 force were aggressively employed with theater basing, it would be able to support
the intensity of munitions delivery historically seen in Enduring Freedom and Allied Force.
is is not the same thing as saying it would have all the same capabilities as the forces histori-
cally employed, just that it could deliver sucient munitions at a sucient rate, the one capa-
bility we are studying. However, the existing eet is much too small to support the intensity of
operations of air delivery in Iraqi Freedom or B-52 operations in Desert Storm.
e green line shows the capability of a force able to successfully carry out 3,000 cruise
missile strikes. (Of course, this is not the same thing as possessing only 3,000 cruise missiles;
some targets would require more than physical weapons as a result of operational mistakes,
mishaps, etc., as well as the need to keep a reserve.) Such a force would not have enough muni-
tions to support either Enduring Freedom or Allied Force, although it would be more than
adequate for Desert Fox and the other smaller operations in the lower left corner.
Figure 1.2
Reusable Versus Expendable Costs and Historical Conflicts
RAND TR1230-1.2
Conflict duration (days)
Intensity (strikes per day)
Equal cost
180
160
140
120
100
80
60
40
20
200
2,5002,0001,5001,0005000 3,000
0
Enduring
Freedom
(B-1 and B-52)
Allied
Force
(total)
Linebacker I
Linebacker II (B-52)
Desert Storm total
Rolling Thunder
(1,320 days duration)
1968 all B-52
Southeast Asia
Iraqi
Freedom
Desert
Storm
(B-52)
Niagara
(Khe Sanh,
B-52)
Deliberate
Force
Infinite
Reach
Desert Fox
Area where reusable is favored
Area where
expendable
is favored
4 Expendable Missiles vs. Reusable Platform Costs and Historical Data
e point here is not to compare B-2s and cruise missiles but to make the observation
that, while both systems can eciently handle a range of important conicts, many historical
conicts have simply been too large for either our current B-2 eet or the hypothetical 3,000-
strike cruise missile force.
Figure 1.3
Reusable Versus Expendable (log scale)
RAND TR1230-1.3
Conflict duration (days)
Intensity (strikes per day)
Equal cost
Equal weapons
Constant days
1,000
100
10
10,000
1,00010010 10,0001
1
Enduring
Freedom
(B-1 and B-52)
Allied
Force
(total)
Linebacker I
Linebacker II (B-52)
Desert Storm total
Rolling
Thunder
1968 all B-52
Southeast Asia
Iraqi
Freedom
(total)
Desert
Storm
(B-52)
Niagara
(Khe Sanh,
B-52)
Deliberate
Force
Infinite
Reach
Desert
Fox
Figure 1.4
Reusable Versus Expendable, with B-2 Bomb Capacity and Standoff Missile Buy (log scale)
RAND TR1230-1.4
Conflict duration (days)
Intensity (strikes per day)
Equal cost
Equal weapons
Constant days
1,000
100
10
10,000
1,00010010 10,0001
1
Enduring
Freedom
(B-1 and B-52)
Allied
Force
(total)
Linebacker I
Linebacker II (B-52)
Desert Storm total
Rolling
Thunder
1968 all B-52
Southeast Asia
Iraqi
Freedom
(total)
Desert
Storm
(B-52)
Niagara
(Khe Sanh,
B-52)
Deliberate
Force
Infinite
Reach
Desert
Fox
B-2 limit
(200 strikes per day)
Expendable
limit
(3,000 strikes)
Expendable Missiles Versus Reusable Platform Costs and Historical Data 5
In Figure 1.5, we use the methodology described above to make easy cost excursions.
Since the height of the sloping line is proportional to the system design and development
(SDD) of the strike aircraft, we can readily see the eect of doubling the aircraft SDD. e
dotted line above the sloped line shows the movement in that component of the indierence
curve.
Similarly, movement in the horizontal line reects the results of doubling the per unit
cost for the reusable aircraft. With this chart, it is easy to see that, for expendable weapons to
become cost-competitive with reusable aircraft for the Desert Storm B-52 scenario, aircraft-
per-unit costs would have to double three times, that is, increase by a factor of eight.
e same eect, cost neutrality in the Desert Storm B-52 case, could also be achieved by
reducing weapons procurement costs by a factor of eight. We concluded from this that the fun-
damental economics of the relative advantage of expendable and reusable platforms in the sort
of campaigns in which U.S. airpower has been used historically are not aected by changes
in cost of less than an order of magnitude. at is, precise cost data are not necessary to make
correct general policy decisions.
It is important to emphasize that this analysis has looked at a very limited set of questions.
What are the fundamental economic drivers in deciding between expendable and reusable
aircraft? Obviously, important issues of range and survivability have not been considered. e
ability of penetrating aircraft to support intelligence, surveillance, and reconnaissance has not
been considered. Finally, this sort of analysis is fundamentally biased against reusable aircraft
because it only considers reusing them within a particular scenario. e important fact that
reusable aircraft can be reused in multiple scenarios is omitted from this formal analysis.
Despite these possible biases against reusable aircraft, we conclude that if the United
States wishes to maintain the capability to wage air war eciently for more than a few days,
reusable platforms are an important part of an ecient force mix. is implies that, if the
Figure 1.5
Reusable Cost Excursions
RAND TR1230-1.5
Conflict duration (days)
Intensity (strikes per day)
Equal cost
Equal weapons
Constant days
Double SDD
Double
procurement
1,000
100
10
10,000
1,00010010 10,0001
1
Enduring
Freedom
(B-1 and B-52)
Allied
Force
(total)
Linebacker I
Linebacker II (B-52)
Desert Storm total
Rolling
Thunder
1968 all B-52
Southeast Asia
Iraqi
Freedom
(total)
Desert
Storm
(B-52)
Niagara
(Khe Sanh,
B-52)
Deliberate
Force
Infinite
Reach
Desert
Fox
6 Expendable Missiles vs. Reusable Platform Costs and Historical Data
United States has a requirement for a substantial long-range strike capability and if the exist-
ing bomber eet will, for some reason, such as age or survivability, not be able to meet that
requirement in the future, the nation should take steps to make appropriate weapon systems
available when needed. Dening appropriate weapon systems requires analysis of alternative
strategies relying on mixes of currently available expendable and reusable platforms and/or new
weapon systems.
is conclusion does not imply that expendable assets are not an important part of a well-
designed force mix. ey are necessary for some important missions (for reasons not discussed
in this report) but are simply too expensive to largely or entirely replace reusable penetrating
aircraft in wars of even moderate duration.
7
APPENDIX A
Model Assumptions and Methodology
We generated the baseline indierence curve presented in this report with the assumptions
detailed below. e model is quite simple and concentrates on the main dierences between
reusable and expendable systems. Dierent assumptions will, of course, produce dierent
indierence curves, but the curve’s general shape and dependence on key parameters will not
change.
Similarly, more sophisticated models including learning curves, discount rates, etc., will
show the same general qualitative behavior.
Assumptions
In addition to the numbers in Table A.1, we worked with the following assumptions:
• New reusable is long range, stealthy, with 20,000-lb payload.
• Aircraft launching expendables is modied commercial transport.
Methodology
e algebra we use to generate the indierence curves is simple.
Assume the cost of a system consists of its SDD cost, which is xed regardless of how
many units are procured, its infrastructure cost, such as aircraft purchases, which is deter-
mined by the force size which in turn is determined by the intensity of conict the system
Table A.1
Cost Assumptions
New
Reusable
Expendable
Carrier
SDD ($M) 20,000 5,000
Platform procurement ($M) 600 100
Weapon procurement ($M) 0.050 2
Weapons per platform (number) 20 50
Weapons per strike (number) 1 2
Sortie rate 1.3 1
8 Expendable Missiles vs. Reusable Platform Costs and Historical Data
will support, and its expendable costs, such as weapons and fuel, which is determined by the
product of the conict intensity and duration:
If we equate the cost of a penetrating aircraft system with the cost of a stando missile
system, we get
where Inf
M
is the unit cost of infrastructure for the missile-based system, etc.
Using ΔSDD to represent (SDD
M
– SDD
A
) and so forth, we subtract the left side from the
right, yielding
Dividing by ΔExp × I and rearranging terms yields
at is, the indierence curve has one term proportional to (1/I) determined by the ratio of
SDD to expendable costs, and one constant term determined by the ratio of infrastructure to
expendable costs. is is precisely what we see on the graphs.
To illustrate how this works out numerically in the baseline case we start by computing
DSDD. is is $20 billion – $5 billion, or $15 billion. Computing ΔExp is a little more com-
plicated since the expendable requires more weapons per strike:
To compute ΔInf we look at the aircraft cost per strike divided by the sortie rate:
We then compute the coecients and nd that the number of days of combat for which
expendable and reusable systems are equally ecient is
Or,
where I is the intensity measured in strikes per day.
So if the intensity is higher that a few thousand strikes per day the rst term is small and
the critical issue is whether the war will last, in this case, more than 5.75 days.
Cost = SDD + Infrastructure×Intensity + Expendables×Intensity×Duration.
SDD
M
+ Inf
M
×I + Exp
M
×I ×D = SDD
A
+ Inf
A
×I + Exp
A
×I ×D,
ΔSDD + ΔInf ×I + ΔExp×I ×D = 0.
D = –
ΔSDD
ΔExp
×
1
I
−
ΔInf
ΔExp
.
ΔExp = 2×$2 million − $50,000, or $3.95 million.
ΔInf =
$600 million
20
⎛
⎝
⎜
⎜
⎜
⎞
⎠
⎟
⎟
⎟
1.3
−
$100 million
50
2
⎛
⎝
⎜
⎜
⎜
⎜
⎜
⎜
⎜
⎜
⎞
⎠
⎟
⎟
⎟
⎟
⎟
⎟
⎟
⎟
⎟
= $23 million.
D = –
$15B
$3.95M
×
1
I
+
$23M
$3.95M
.
D = 3,797×
1
I
+ 5.75,
9
APPENDIX B
Data Sources
Below is a list of historical sources used for the data presented in this study. All data were taken
from readily available unclassied sources. In some cases, particularly in Vietnam, the exact
number of weapons dropped was not available, but the total weight delivered was available. In
such cases, we estimated the number of weapons by assuming that the average weapon weighed
1,000 lbs. e numbers in parentheses are the weapons per day and duration of the conict in
days. ose are the numbers shown on the gures.
• 1968 B-52 total (2,500; 366) (Bowman, 2005, p. 74).
• Niagara (2,857; 77) from 110,000 tons (B-52) (Summers, 1995, p. 136).
• Linebacker I (1,515; 165) from 125,000 tons total (Summers, 1995, p. 180).
• Linebacker II (4,000; 10) from 20,000 tons total (Summers, 1995, p. 180).
• Rolling under (974; 1,320) from 643,000 tons total (Summers, 1995, p. 96).
• Desert Storm B-52 (2,000; 40) (Bowman, 2005, p. 146).
• Deliberate Force (60; 17) (Ripley, 1996, p. 111).
• Innite Reach (75; 1) (Myers, 1998).
• Allied Force (230; 78) (Daalder and O’Hanlon, 2000, pp. 250, 307).
• Desert Fox (173; 4) (Cohen and Zinni, 1998).
• Enduring Freedom (153; 76) (Global Security, 2012).
• Iraqi Freedom (1,343; 22) (Moseley, 2003, p. 11).
11
APPENDIX C
Additional Cost Excursions
is appendix repeats the familiar gure from the body of this report with a few dierent sets
of cost assumptions. e point of this section is to demonstrate that our general conclusion
(that cruise missiles are not a cost-eective solution for future scenarios resembling historical
scenarios) is not dependent on the details of the cost assumptions.
Figure C.1 looks at a case in which the procurement cost of a penetrating strike aircraft
carrying 20 weapons is $1.2 billion instead of the $600 million assumed in the base case. is
causes little change in the position of the left side of the indierence curve but doubles the level
of the right side. at is, if the penetrating aircraft is that expensive, we should only buy it if
we anticipate the need to prepare for conicts lasting more than about 12 days.
Figure C.2 presents an indierence curve for a penetrating aircraft with a unit procure-
ment cost of $3 billion. (at is just the procurement cost. We assumed, as in the baseline,
an additional $20 billion for SDD.) We further assumed that such an aircraft would be able
to carry 40 independently targeted weapons. is indierence curve is very similar to the one
above.
Figure C.1
Case with Doubled Reusable Aircraft Procurement Cost
RAND TR1230-C.1
Conflict duration (days)
Intensity (strikes per day)
Equal cost curve
180
160
140
120
100
80
60
40
20
200
2,5002,0001,5001,0005000 3,000
0
12 Expendable Missiles vs. Reusable Platform Costs and Historical Data
Figure C.3 shows a case in which we have doubled the development cost of a new aircraft,
to $40 billion. is change moves the left side of the indierence curve somewhat to the right,
almost to the point representing bomber operations in Operation Enduring Freedom. e
point is that, if Enduring Freedom is the biggest war for which the nation needs to prepare and
if penetrating aircraft would indeed require such a large development cost, the United States
should be indierent as to whether it buys penetrating aircraft or cruise missiles.
e previous excursions have all made penetrating aircraft more expensive. Figure C.4
illustrates a case in which the cost of cruise missiles is double that of our baseline case. is
lowers the indierence curve signicantly.
e larger point here is that none of these excursions really changed the overall result
much. e cases that were above the curve, major theater wars, were all above the curve in each
case. e limited strike cases, such as Desert Fox, were all below the line in each excursion. So
the overall conclusion of the report, that it is not economically wise to rely primarily on cruise
missiles if one needs to prepare for the sort of conicts that have occurred in the past, remains
the same.
Figure C.2
Case with $3-Billion (procurement) Bomber with 40 Weapons
RAND TR1230-C.2
Conflict duration (days)
Intensity (strikes per day)
Equal cost curve
180
160
140
120
100
80
60
40
20
200
2,5002,0001,5001,0005000 3,000
0
Additional Cost Excursions 13
Figure C.3
Case with Doubled Reusable Aircraft Procurement Cost
RAND TR1230-C.3
Conflict duration (days)
Intensity (strikes per day)
Equal cost curve
180
160
140
120
100
80
60
40
20
200
2,5002,0001,5001,0005000 3,000
0
Figure C.4
Case with Doubled Cruise Missile Procurement Cost
RAND TR1230-C.4
Conflict duration (days)
Intensity (strikes per day)
Equal cost curve
180
160
140
120
100
80
60
40
20
200
2,5002,0001,5001,0005000 3,000
0