THE NEXT 4 BILLION MARKET SIZE AND BUSINESS STRATEGY AT THE BASE OF THE PYRAMID ppt
Bạn đang xem bản rút gọn của tài liệu. Xem và tải ngay bản đầy đủ của tài liệu tại đây (10.86 MB, 164 trang )
@ek\ieXk`feXc=`eXeZ\:figfiXk`fe
Nfic[9Xeb>iflg
D8IB<KJ@Q<8E;9LJ@E<JJJKI8K<>P
8KK?<98J<F=K?<GPI8D@;
K?<E<OK
+9@CC@FED8IB<KJ@Q<8E;9LJ@E<JJJKI8K<>P
8KK?<98J<F=K?<GPI8D@;
K?<E<OK
+9@CC@FE=fliY`cc`fecfn$`eZfd\Zfejld\ij#XdXafi`kpf]k_\nfic[Ëj
gfglcXk`fe#Zfejk`klk\k_\YXj\f]k_\\Zfefd`ZgpiXd`[%
E\n \dg`i`ZXc d\Xjli\j f] k_\`i X^^i\^Xk\ gliZ_Xj`e^
gfn\iXe[k_\`iY\_Xm`fiXjZfejld\ijjl^^\jkj`^e`ÔZXek
fggfikle`k`\j]fidXib\k$YXj\[XggifXZ_\jkfY\kk\id\\k
k_\`ie\\[j#`eZi\Xj\k_\`igif[lZk`m`kpXe[`eZfd\j#Xe[
\dgfn\ik_\`i\ekip`ekfk_\]fidXc\Zfefdp%
8cc\eC%?Xddfe[#N`cc`XdA%BiXd\i#
IfY\ikJ%BXkq#Alc`XK%KiXe#:flikcXe[NXcb\i
Nfic[I\jfliZ\j@ejk`klk\
@ek\ieXk`feXc=`eXeZ\:figfiXk`fe
D8IB<KJ@Q<8E;9LJ@E<JJJKI8K<>P
8KK?<98J<F=K?<GPI8D@;
K?<E<OK
+9@CC@FE
2 0 0 7 | w o r l d r e s o u r c e s i n s t i t u t e
Rights and Permissions
Order Information:
j B63<3FB"07::7=<
M
JgfejfijXe[le[\ini`k\ij
Gi`eZ`gXcle[\ini`k`e^]fiK_\E\ok+9`cc`fe_XjY\\egifm`[\[Ypk_\@ek\ieXk`feXc=`eXeZ\:figfiXk`fe
Xe[k_\@ek\i$8d\i`ZXe;\m\cfgd\ek9Xeb%
8[[`k`feXcÔeXeZ`Xcjlggfik_XjY\\egifm`[\[Yp@ek\c#D`Zifjf]k#k_\J_\cc=fle[Xk`fe#Xe[M`jX@ek\ieXk`feXc%
@ek\ieXk`feXc=`eXeZ\:figfiXk`fe
Nfic[9Xeb>iflg
%j E=@:2@3A=C@13A7<AB7BCB3
M@
K_`ji\gfikfn\j`kj\o`jk\eZ\kfdXepg\fgc\Xe[`ejk`klk`fej#Ylkk_\
le[\icp`e^i\j\XiZ_gifa\Zknflc[efk_Xm\_Xgg\e\[n`k_flkk_\\Xicp#
\ek_lj`Xjk`Z#Xe[jljkX`e\[jlggfikf];feXc[=%K\iip#dXeX^\if]k_\
Dlck`cXk\iXc@em\jkd\ek=le[f]k_\@ek\i$8d\i`ZXe;\m\cfgd\ek9Xeb
@;9 %;fele[\ijkff[\Xicpfe_fn`dgfikXekk_\dXib\kj]fid\[Yp
cfn$`eZfd\ Zfddle`k`\j Xi\ kf k_\ ]le[Ëj `em\jkd\ekjkiXk\^p# Xe[
_\_XjY\\eXeleÕX^^`e^jfliZ\f]X[m`Z\Xe[Xjj`jkXeZ\k_ifl^_flk
k_\i\j\XiZ_%K_ifl^_;feXe[fk_\i@;9Zfcc\X^l\j#k_\@;9dX[\X
jlYjkXek`m\Zfeki`Ylk`fekfk_\[\m\cfgd\ekf]k_`ji\gfik%
Cl`j 8cY\ikf Dfi\ef# gi\j`[\ek f] k_\ @;9# gifm`[\[ `dgfikXek
c\X[\ij_`g% Le[\i _`j ^l`[XeZ\ k_\ @;9# k_ifl^_ `kj Fggfikle`kp ]fi
k_\ DXafi`kp `e`k`Xk`m\# Y\ZXd\ k_\ Ôijk dXafi `ek\ieXk`feXc ÔeXeZ`Xc
`ejk`klk`fekf`eZfigfiXk\X]fZljfek_\YXj\f]k_\\Zfefd`ZgpiXd`[
9FG `ekf e\n gif^iXd jkiXk\^`\j% N\ ^iXk\]lccp XZbefnc\[^\ k_\
@;9]fidXb`e^k_`j i\j\XiZ_XZfie\ijkfe\f]`kj È9l`c[`e^Fggfikl$
e`kp]fik_\DXafi`kpÉZfe]\i\eZ\`eAle\)''-#n_\i\gi\c`d`eXipi\$
j\XiZ_i\jlckj]fiCXk`e8d\i`ZXXe[k_\:Xi`YY\Xen\i\ÔijkglYc`Zcp
gi\j\ek\[%
K_\@ek\ieXk`feXc=`eXeZ\:figfiXk`fe@=: jk\gg\[`ekfgifm`[\
k_\ dXafi ]le[`e^ Xe[ kf ZfccXYfiXk\`e k_\ i\j\XiZ_%D`Z_X\cBc\`e#
m`Z\gi\j`[\ek]fiÔeXeZ`XcXe[gi`mXk\j\Zkfi[\m\cfgd\ekaf`ekcp]fi
k_\Nfic[9XebXe[@=:Xjn\ccXjZ_`\]\Zfefd`jk#@=:#`dd\[`Xk\$
cpi\Zf^e`q\[ `kj gfk\ek`Xc# X^i\\[kf X gXike\ij_`g#Xe[Y\ZXd\k_\
gifa\ZkËjZ_`\]X[mfZXk\%N\Xi\^iXk\]lckf@=:efkfecp]fi`kjÔeXe$
Z`XcjlggfikYlkXcjf]fi`kjjlYjkXek`m\\e^X^\d\ekn`k_k_\gifa\Zk#
`eZcl[`e^XZZ\jjkf[XkX#_\cgn`k_[\m\cfg`e^k_\d\k_f[fcf^p#Xe[
k_fl^_k]lcX[m`Z\`ej_Xg`e^k_\\[`kfi`XcZfek\ek%G\e\cfg\9iffbXe[
=XZle[fDXik`e_Xm\Y\\efliZXi`e^Xe[\]ÔZ`\ekkXjbdXeX^\ijXk
@=:#dXb`e^k_\gXike\ij_`gXle`hl\cp\]]\Zk`m\fe\%
K_\i\j\XiZ_[XkXjkilZkli\jXi\[\i`m\[]ifdk_\nfibf]9iXebf
D`cXefm`Z# c\X[ \Zfefd`jk n`k_ k_\Nfic[ 9XebËj I\j\XiZ_ ;\gXik$
d\ek#Xe[Fc`m`\i;lgi`\q#j\e`fijkXk`jk`Z`XeXe[\Zfefd`jkn`k_k_\
Nfic[9XebËj;\m\cfgd\ek;XkX>iflg%N\Xi\`e[\Yk\[kfYfk_]fi
k_\`i^iXZ`fljg\id`jj`fekflj\k_\`ii\j\XiZ_#dlZ_f]n_`Z__Xjefk
Y\\egi\m`fljcpglYc`j_\[%K_\pgifm`[\[b\\e`ej`^_kj`ekfk_\[XkX
Xe[^l`[XeZ\fe_fnY\jkkfle[\ijkXe[Xe[gi\j\ekk_\d%
I\j\XiZ_
N\nflc[Xcjfc`b\kfk_Xebk_\]fccfn`e^g\fgc\]fik_\`ii\j\XiZ_
Xjj`jkXeZ\1
@=:1K\]\iX9\b\c\Xe[>flk_Xd`GX[Xd
@;91Alc`f>lqdXe#GXm\cCl\e^Xj$J`\iiX#Afj\8ekfe`XD\a`X#BXi\e
DfbXk\#Xe[Afi^\L^Xq
:fek\ekX[m`Z\Xe[i\m`\n
N\Xggi\Z`Xk\Xe[XZbefnc\[^\k_\X[m`Z\f]k_\]fccfn`e^
i\m`\n\ij1
NI@18c\o8Zj#A\ee`\?fdd\c#;Xm`[A_`iX[#:_i`jk`XeCXpb\#
Jd`kXEXb_ff[X#;Xe`\cGiX^\i#:cXpkfeI`^[fe#Xe[=i\[N\cc`e^kfe
@=:&Nfic[9Xeb18c\oGi\b\i#:_i`jk`e\Q_\e$N\`Hl`Xe^#
;`c`gIXk_X#Xe[DXibN`cc`Xdj
:fek\ekX[m`Z\Xe[i\m`\n
<ok\ieXc1IfY\ik8ee`YXc\:`k`^iflg
Cfl`j9ffijk`e9`ccXe[D\c`e[X>Xk\j=fle[Xk`fe
:_i`jk`e\<`YjJ`e^\i<":f
A\]]\ip>Xc`efmjbp@ek\c
Blik?f]]dXeJ_\cc=fle[Xk`fe
9\k_A\eb`ejAf_e=%B\ee\[pJZ_ffcf]>fm\ied\ek
:_i`jkfg_\iA\ee`e^j@;9
8cX`eDXk_pjJl\q
;fd`e`ZDfekX^lLe`m\ij`kpf]:Xc`]fie`X#9\ib\c\p
AXe\E\cjfeAf_e=%B\ee\[pJZ_ffcf]>fm\ied\ek #
:%B%GiX_XcX[Le`m\ij`kpf]D`Z_`^Xe
AXd\jN\ccjN\ccjgi`e^:fejlck`e^
:_i`jkfg_\iN\jkJ_\cc=fle[Xk`fe
;Xm`[N_\\c\iPfibLe`m\ij`kp
>\e\iXcX[m`Z\
=fi^\e\iXcX[m`Z\n\nflc[c`b\kfk_Xeb1
@;918eX$D`kX9\kXeZflik#JlqXee\;lip\X#
Ef_iXI\p[\DXilcXe[X#Xe[;Xe`\cJ_\g_\i[
@=:&Nfic[9Xeb1;fl^9Xie\j#BXk_c\\e9\\^c\#GXfcf9\cc`#
IfY\ik9lZbc\p#DXi`e\cX;X[f#M`m`\e=fjk\i#A\[=i`\[dXe#
<c\eX>X^`\mX$G\kifmX#DXkk_\n>Xdj\i#
EX[`e\J_Xdfleb`>_XeeXd#@mX@c`\mX?Xd\c#8gi`c?Xi[`e^#
DXik`e?fckdXee#8[XBXi`eX@qX^l`ii\#I%DlbXd`BXi`lb`#
<c`qXY\k_C`kkc\Ô\c[#8cX`eCfZljjfc#<dd\kkDfi`Xikp#
M`eZ\ekGXcdX[\#8e[i\XIpXe$I`qm`#Gi\dJXe^iXlcX#
BXk_\i`e\JZfkk#JlqXee\Jd`k_#B\\jmXe[\iD\\i#Xe[
GXki`Z`XM\\m\ij$:Xik\i%
<ok\ieXc19i`XeI`Z_Xi[jfeN`qq`k
NI@gifa\ZkdXeX^\i
8cc\eC%?Xddfe[
9ffb[\j`^e
;\j`^e1Ccfp[>i\\eY\i^;\j`^e#CC:
@e]fidXk`fe>iXg_`Zj1>\iXc[Hl`ee&>%Hl`ee@e]fidXk`fe;\j`^e
:fgp\[`k`e^
8c`jfeJkife^
G_fkfZi\[`kj
:fm\ig_fkf1Alc`\?flZb&:fiY`j
?\Xck_BXi\eBXjdXljb`&:fiY`j
@K:8eXkfc`pIXb_`dYXp\m&Nfic[9Xeb
NXk\i9\eaXd`eCfnp&:fiY`j
KiXejgfikXk`feZflik\jpf]<D98IHNfic[I\jfliZ\j@ejk`k`lk\
?flj`e^>`[\feD\e[\cc&:fiY`j
<e\i^pIlgXb;\:_fn[_li`&I\lk\ij&:fiY`j
=ff[A\_X[E^X&8Zk`fe8`[&:fiY`j
=`eXeZ\>`[\feD\e[\cc&:fiY`j
8Zbefnc\[^d\ekj
j B63<3FB"07::7=<
M@@
:FEK<EKJ
(
;8K8>L@;<
)
<O<:LK@M<JLDD8IP
()
:?8GK<I(@EKIF;L:K@FE8E;D8IB<KFM<IM@<N
*+
:?8GK<I)K?<?<8CK?D8IB<K
+)
:?8GK<I*K?<@E=FID8K@FE8E;
:FDDLE@:8K@FEJD8IB<K
,)
:?8GK<I+K?<N8K<ID8IB<K
-'
:?8GK<I,K?<KI8EJGFIK8K@FED8IB<K
-/
:?8GK<I-K?<?FLJ@E>D8IB<K
:?8GK<I.K?<<E<I>PD8IB<K
//
:?8GK<I/K?<=FF;D8IB<K
0-
:?8GK<I0K?<=@E8E:@8CJ<IM@:<JD8IB<K
('+
I<=<I<E:<J
('-
8GG<E;@O8@E:FD<;8K8
(()
8GG<E;@O9<OG<E;@KLI<;8K8
((+
:FLEKIP;8K8K89C<J
%j E=@:2@3A=C@13A7<AB7BCB3
M@@@
j B63<3FB"07::7=<
(
;XkX>l`[\
International dollars (purchasing power parity exchange rates) are used throughout this report
unless otherwise specified. Market figures and household income and expenditure measured by
household surveys are given in 2005 international dollars.
Current US dollars means 2005 dollars.
For convenience, however, BOP income figures used to describe BOP income segments or the
BOP and mid-market income cut-offs are measured in 2002 international dollars (purchasing
power parity dollars or PPP), since 2002 is the reference year to which the surveys used in this
analysis were normalized. The BOP population segment is defined as those with annual incomes
up to and including $3000 per capita per year (2002 PPP). The mid-market population segment
is defined as those with annual incomes above $3,000 and up to and including $20,000 PPP. The
high income segment includes annual incomes above $20,000 PPP. The report and accompany-
ing country tables use annual income increments of $500 PPP within the BOP to distinguish six
BOP income segments, denoted as BOP500, BOP1000, BOP1500, etc.
In 2005 international dollars, the cutoff for the BOP and the mid-market population segments
are $3,260 and $21,731.
I\^`feXcX^^i\^Xk\j
Aggregate data are presented for four developing regions—Africa, Asia (including the Middle
East), Eastern Europe, and Latin America and the Caribbean as well as for the world as a whole.
The report refers to surveyed countries, which includes 110 countries for which household sur-
vey data were available. (See Appendix A for a list of countries by developing region and for ad-
ditional countries.) The report also refers to measured countries as those for which standardized
survey data on household expenditures were available. (See Appendix B for a list of countries by
region.)
DXib\k:fdgfj`k`fe
The report analyzes market composition in terms of total annual income or expenditures by
BOP income segments. The graphics representing the data, in 2005 PPP dollars, are scaled to
produce figures of workable size, but show accurately the relative total household spending by
income segment.
?flj\_fc[<og\e[`kli\j
The report also analyzes household spending in terms of average annual per household expen-
ditures. Again, the graphics representing the data are scaled, but show accurately the relative
household spending for each BOP income segment.
LiYXe&IliXc8eXcpj`j
The report illustrates the market composition by urban and rural locations, both for the total
BOP market and by BOP income segment. The graphics representing the data are scaled, but
show accurately the relative urban and rural spending.
j B63<3FB"07::7=<
<O<:LK@M<JLDD8IP
K_\
@e]fidXk`feXe[
:fddle`ZXk`fej
DXib\k
<O<:LK@M<JLDD8IP
3F31CB7D3AC;;/@Gj B63<3FB"07::7=<
*
Four billion low-income people, a majority of the world’s pop-
ulation, constitute the base of the economic pyramid. New
empirical measures of their behavior as consumers and their
aggregate purchasing power suggest significant opportunities for
market-based approaches to better meet their needs, increase
their productivity and incomes, and empower their entry into
the formal economy.
The 4 billion people at the base of the economic pyramid (BOP)—all
those with incomes below $3,000 in local purchasing power—live in rela-
tive poverty. Their incomes in current U.S. dollars are less than $3.35 a
day in Brazil, $2.11 in China, $1.89 in Ghana, and $1.56 in India.
1
Yet to-
gether they have substantial purchasing power: the BOP constitutes a $5
trillion global consumer market.
The wealthier mid-market population segment, the 1.4 billion people
with per capita incomes between $3,000 and $20,000, represents a $12.5
trillion market globally. This market is largely urban, already relatively
well served, and extremely competitive.
In contrast, BOP markets are often rural—especially in rapidly growing
Asia—very poorly served, dominated by the informal economy, and, as a
result, relatively inefficient and uncompetitive. Yet these markets rep-
resent a substantial share of the world’s population. Data from national
household surveys in 110 countries show that the BOP makes up 72%
of the 5,575 million people recorded by the surveys and an overwhelm-
ing majority of the population in Africa, Asia, Eastern Europe, and Latin
America and the Caribbean—home to nearly all the BOP.
Analysis of the survey data—the latest available on incomes, expendi-
tures, and access to services—shows marked differences across countries
in the composition of these BOP markets. Some, like Nigeria’s, are con-
centrated in the lowest income segments of the BOP; others, like those in
Ukraine, are concentrated in the upper income segments. Regional dif-
ferences are also apparent. Rural areas dominate most BOP markets in
%j E=@:2@3A=C@13A7<AB7BCB3
+
Africa and Asia; urban areas dominate most in Eastern Europe and Latin
America.
Striking patterns also emerge in spending. Not surprisingly, food
dominates BOP household budgets. As incomes rise, however, the share
spent on food declines, while the share for housing remains relatively
constant—and the shares for transportation and telecommunications
grow rapidly. In all regions half of BOP household spending on health
goes to pharmaceuticals. And in all except Eastern Europe the lower in-
come segments of the BOP depend mainly on firewood as a cooking fuel,
the higher segments on propane or other modern fuels.
That these substantial markets remain underserved is to the detri-
ment of BOP households. Business is also missing out. But there is now
enough information about these markets, and enough experience with
viable business strategies, to justify far closer business attention to the
opportunities they represent. Market-based approaches also warrant far
more attention in the development community, for the potential ben-
efits they offer in bringing more of the BOP into the formal economy and
in improving the delivery of essential services to this large population
segment.
89FGGfikiX`k
The development community has tended to focus on meeting the needs
of the poorest of the poor—the 1 billion people with incomes below $1
a day in local purchasing power. But a much larger segment of the low-
income population—the 4 billion people of the BOP, all with incomes
well below any Western poverty line—both deserves attention and is the
appropriate focus of a market-oriented approach.
The starting point for this argument is not the BOP’s poverty. Instead,
it is the fact that BOP population segments for the most part are not inte-
grated into the global market economy and do not benefit from it. They
also share other characteristics:
•
Significant unmet needs. Most people in the BOP have no bank
account and no access to modern financial services. Most do not
own a phone. Many live in informal settlements, with no formal
title to their dwelling. And many lack access to water and sanita-
tion services, electricity, and basic health care.
•
Dependence on informal or subsistence livelihoods. Most
in the BOP lack good access to markets to sell their labor, handi-
3F31CB7D3AC;;/@Gj B63<3FB"07::7=<
,
crafts, or crops and have no choice but to sell to local employers or
to middlemen who exploit them. As subsistence and small-scale
farmers and fishermen, they are uniquely vulnerable to destruc-
tion of the natural resources they depend on but are powerless to
protect (World Resources Institute and others 2005). In effect,
informality and subsistence are poverty traps.
•
Impacted by a BOP penalty. Many in the BOP, and perhaps most,
pay higher prices for basic goods and services than do wealthier
consumers—either in cash or in the effort they must expend to
obtain them—and they often receive lower quality as well. This high
cost of being poor is widely shared: it is not just the very poor who
often pay more for the transportation to reach a distant hospital or
clinic than for the treatment, or who face exorbitant fees for loans
or for transfers of remittances from relatives abroad.
Addressing the unmet needs of the BOP is essential to raising welfare,
productivity, and income—to enabling BOP households to find their own
route out of poverty. Engaging the BOP in the formal economy must be a
critical part of any wealth-generating and inclusive growth strategy. And
eliminating BOP penalties will increase effective income for the BOP.
Moreover, to the extent that unmet needs, informality traps, and BOP
penalties arise from inefficient or monopolistic markets or lack of atten-
tion and investment, addressing these barriers may also create significant
market opportunities for businesses.
Perhaps most important, it is the entire BOP and not just the very poor
who constitute the low-income market—and it is the entire market that
must be analyzed and addressed for private sector strategies to be effec-
tive, even if there are segments of that market for which market-based
solutions are not available or not sufficient.
KXb`e^XdXib\k$YXj\[XggifXZ_kfgfm\ikpi\[lZk`fe
Analysis of BOP markets can help businesses and governments think
more creatively about new products and services that meet BOP needs
and about opportunities for market-based solutions to achieve them.
For businesses, it is an important first step toward identifying business
opportunities, considering business models, developing products, and
expanding investment in BOP markets. For governments, it can help
%j E=@:2@3A=C@13A7<AB7BCB3
-
focus attention on reforms needed in the business environment to allow
a larger role for the private sector.
BOP market analysis, and the market-based approach to poverty re-
duction on which it is based, are equally important for the development
community. This approach can help frame the debate on poverty reduc-
tion more in terms of enabling opportunity and less in terms of aid. A
successful market-based approach would bring significant new private
sector resources into play, allowing development assistance to be more
targeted to the segments and sectors for which no viable market solu-
tions can presently be found.
There are distinct differences between a market-based approach
to poverty reduction and more traditional approaches. Traditional ap-
proaches often focus on the very poor, proceeding from the assumption
that they are unable to help themselves and thus need charity or public
assistance. A market-based approach starts from the recognition that
being poor does not eliminate commerce and market processes: virtu-
ally all poor households trade cash or labor to meet much of their basic
needs. A market-based approach thus focuses on people as consumers
and producers and on solutions that can make markets more efficient,
competitive, and inclusive—so that the BOP can benefit from them.
Traditional approaches tend to address unmet needs for health care,
clean water, or other basic necessities by setting targets for meeting those
needs through direct public investments, subsidies, or other handouts.
The goals may be worthy, but the results have not been strikingly suc-
cessful. A market-based approach recognizes that it is not just the very
poor who have unmet needs—and asks about willingness to pay across
market segments. It looks for solutions in the form of new products and
new business models that can provide goods and services at affordable
prices.
Those solutions may involve market development efforts with ele-
ments similar to traditional development tools—hybrid business strat-
egies that incorporate consumer education; microloans, consumer
finance, or cross-subsidies among different income groups; franchise or
retail agent strategies that create jobs and raise incomes; partnerships
with the public sector or with nongovernmental organizations (NGOs).
Yet the solutions are ultimately market oriented and demand driven—
and many successful companies are adopting such strategies.
3F31CB7D3AC;;/@Gj B63<3FB"07::7=<
.
Perhaps most important, traditional approaches do not point toward
sustainable solutions—while a market-oriented approach recognizes
that only sustainable solutions can scale to meet the needs of 4 billion
people.
>ifn`e^`ek\i\jk#^ifn`e^jlZZ\jj`e9FGdXib\kj
Business interest in BOP markets is rising. Multinational companies have
been pioneers, especially in food and consumer products. Large national
companies have proved to be among the most innovative in meeting the
needs of BOP consumers and producers, especially in such sectors as
housing, agriculture, consumer goods, and financial services. And small
start-ups and social entrepreneurs focusing on BOP markets are rapidly
growing in number. But perhaps the strongest and most dramatic BOP
success story is mobile telephony.
Between 2000 and 2005 the number of mobile subscribers in devel-
oping countries grew more than fivefold—to nearly 1.4 billion. Growth
was rapid in all regions, but fastest in sub-Saharan Africa—Nigeria’s sub-
scriber base grew from 370,000 to 16.8 million in just four years (World
Bank 2006b). Household surveys confirm substantial and growing mobile
phone use in the BOP population, which has clearly benefited from the
access mobile phones provide to jobs, to medical care, to market prices, to
family members working away from home and the remittances they can
send, and, increasingly, to financial services (Vodafone 2005).
A strong value proposition for low-income consumers has translated
into financial success for mobile companies. Celtel, an entrepreneurial
company operating in some of the poorest and least stable countries in
Africa, went from start-up to telecom giant in just seven years. Acquired
for US$3.4 billion in 2005, the company now has operations in 15 African
countries and licenses covering more than 30% of the continent.
Not all sectors have found their footing in BOP markets yet. Privatized
urban water systems, for example, have encountered financial and politi-
cal difficulties in developing countries, and the result has been neither
better service for low-income communities nor success for the compa-
nies. The energy sector has similarly had only limited success in providing
affordable off-grid electricity or clean cooking fuels to rural BOP com-
munities. But even these sectors have seen encouraging new ventures,
and further development of technology and business models may expand
BOP markets.
%j E=@:2@3A=C@13A7<AB7BCB3
/
Dfm`e^kfnXi[Xdfi\_fjg`kXYc\\em`ifed\ek]fiYlj`e\jj
The operating and regulatory environments in developing countries can
be challenging. Micro and small businesses especially face disadvantages.
If they are informal, they cannot get investment finance, participate in
value chains of larger companies, or sometimes even legally receive ser-
vices from utilities. Condemned to remain small, they cannot generate
wealth or many jobs. Nor do they contribute to the broader economy by
paying taxes.
Most face barriers to joining the formal economy in the form of anti-
quated regulations and prohibitive requirements—dozens of steps, delays
of many months, capital requirements beyond attainment for most of the
BOP. In El Salvador, for example, starting a legitimate business used to
take 115 days and many separate procedures—until recent reforms re-
duced the effort to 26 days and allowed registration with four separate
agencies in a single visit. But even for legitimate small businesses, invest-
ment capital is generally unavailable and supporting services scarce.
Fortunately, there is growing recognition of the importance of remov-
ing barriers to small and medium-size businesses and a growing toolbox
for moving firms into the formal economy and creating more efficient
markets. And as the World Bank and International Finance Corporation
(IFC) show, in their annual Doing Business reports, there is also mount-
ing evidence that the tools work. In El Salvador five times as many busi-
nesses register annually since its reforms. Many countries, including
China, have dropped minimum capital requirements. The pace of reform
is accelerating, with more than 40 countries making changes in the most
recent year surveyed.
2
Coupled with reform is growing attention to enterprise development
initiatives focusing on BOP markets and investment capital for small and
medium-size businesses. Several international and bilateral development
agencies are launching investment funds to support the growth of small
and medium-size enterprises across the developing world. These efforts,
and the growing private sector interest in investing in such enterprises
in developing countries, explicitly recognize that an expanded private
sector role and a bottom-up market approach are essential development
strategies.
3F31CB7D3AC;;/@Gj B63<3FB"07::7=<
0
N_Xk9FGdXib\kjcffbc`b\
Total household income of $5 trillion a year establishes the BOP as a
potentially important global market. Within that market are large varia-
tions across regions, countries, and sectors in size and other character-
istics.
Asia (including the Middle East) has by far the largest BOP market:
2.86 billion people with income of $3.47 trillion. This BOP market repre-
sents 83% of the region’s population and 42% of the purchasing power—a
significant share of Asia’s rapidly growing consumer market.
Eastern Europe’s $458 billion BOP market includes 254 million peo-
ple, 64% of the region’s population, with 36% of the income.
In Latin America the BOP market of $509 billion includes 360 million
people, representing 70% of the region’s population but only 28% of total
household income, a smaller share than in other developing regions.
Africa has a slightly smaller BOP market, at $429 billion. But the BOP
is by far the region’s dominant consumer market, with 71% of purchas-
ing power. It includes 486 million people—95% of the surveyed popula-
tion.
Sector markets for the 4 billion BOP consumers range widely in size.
Some are relatively small, such as water ($20 billion) and information
and communication technology, or ICT ($51 billion as measured, but
probably twice that now as a result of rapid growth). Some are medium
scale, such as health ($158 billion), transportation ($179 billion), housing
($332 billion), and energy ($433 billion). And some are truly large, such
as food ($2,895 billion).
3
Evidence of BOP penalties emerges in several sectors. Wealthier
mid-market households are seven times as likely as BOP households to
have access to piped water. Some 24% of BOP households lack access
to electricity, while only 1% of mid-market households do. Rural BOP
households have significantly lower ICT spending and are significantly
less likely to own a phone than rural mid-market households or even
urban BOP households—consistent with the broad lack of access to ICT
services in rural areas.
%j E=@:2@3A=C@13A7<AB7BCB3
('
9FGYlj`e\jjjkiXk\^`\jk_Xknfib
Why are some enterprises succeeding in meeting BOP needs, and others
are not? Successful enterprises operating in these markets use four broad
strategies that appear to be critical:
•
Focusing on the BOP with unique products, unique services, or
unique technologies that are appropriate to BOP needs and that
require completely reimagining the business, often through sig-
nificant investment of money and management talent. Examples
are found in such sectors as water (point-of-use systems), food
(healthier products), finance (microfinance and low-cost remit-
tance systems), housing, and energy.
•
Localizing value creation through franchising, through agent
strategies that involve building local ecosystems of vendors or
suppliers, or by treating the community as the customer, all of
which usually involve substantial investment in capacity building
and training. Examples can be seen in health care (franchise and
agent-based direct marketing), ICT (local phone entrepreneurs
and resellers), food (agent-based distribution systems), water
(community-based treatment systems), and energy (mini-hydro-
power systems).
•
Enabling access to goods or services—financially (through sin-
gle-use or other packaging strategies that lower purchase barri-
ers, prepaid or other innovative business models that achieve the
same result, or financing approaches) or physically (through novel
distribution strategies or deployment of low-cost technologies).
Examples occur in food, ICT, and consumer products (in packaging
goods and services in small unit sizes, or “sachets”) and in health
care (such as cross-subsidies and community-based health insur-
ance). And cutting across many sectors are financing strategies that
range from microloans to mortgages.
•
Unconventional partnering with governments, NGOs, or groups
of multiple stakeholders to bring the necessary capabilities to the
table. Examples are found in energy, transportation, health care,
financial services, and food and consumer goods.
Enterprises may—and often do—use more than one of these strategies
serially or in combination.
3F31CB7D3AC;;/@Gj B63<3FB"07::7=<
((
<e[efk\j
In this report current U.S. dollars means 2005 dollars. Unless otherwise noted, however, market information is
given in 2005 international dollars (adjusted for purchasing power parity); for convenience, BOP and mid-market
income cutoffs are given in international dollars for 2002 (the base year to which household surveys used in the
analysis for the report have been normalized). U.S. dollars are generally denoted by US$, international dollars by $.
The tools are available in the World Bank and IFC’s annual Doing Business reports, along with country ratings of
progress on reform. For the most recent results, see World Bank and IFC (2006).
The analysis of market size starts with household expenditure data from 36 countries for which recorded
expenditures have been mapped into standard spending categories. (The underlying surveys may vary from
country to country and across time, however, so that information collected may not be directly comparable.) The
analysis estimates the size of sector markets in each region by extrapolating from these measured countries to a
broader set of surveyed countries for which BOP income data exist. This approach assumes that the ratio of sector
expenditure to total household expenditure will be similar in the two sets of countries within a region. It also
assumes that total household income equals total household expenditure.
1.
2.
3.
%j E=@:2@3A=C@13A7<AB7BCB3
()
:?8GK<IFE<
@ekif[lZk`fe
Xe[DXib\k
Fm\im`\n
7<B@=2C1B7=<j B63<3FB"07::7=<
(*
In an informal suburb of Guadalajara, Mexico, a growing family is
struggling to expand their small house. Help arrives from a major
industrial company in the form of construction designs, credit,
and as-needed delivery of materials, enabling rapid completion
of the project at less overall cost.
In rural Madhya Pradesh, an Indian farmer gains access to soil
testing services, to market price trends that help him decide what
to grow and when to sell, and to higher prices for his crop than
he can obtain in the local auction market. The new system is an
innovation of a large grain-buying corporation, which also
benefits from cost saving and more direct market access.
A South African who lives in an impoverished, crime-ridden neighbor-
hood of Johannesburg has no bank account, cannot order items from a
distant store, and is sometimes robbed of her pay packet. She finds that
a new financial service offered by a local start-up company allows her
mobile phone to become a solution—her pay is deposited directly to her
phone-based account, she can make purchases via an associated debit
card, and she carries no cash to steal.
In a small community outside Tianjin, China, a small merchant whose
children have been repeatedly sickened by drinking water from a heav-
ily-polluted river is distraught. He finds help not from the overwhelmed
municipal government but from a new, low-cost filtering system, devel-
oped by an entrepreneurial company, which enables his family to treat
its water at the point of use.
Four billion people such as these form the base of the economic
pyramid (BOP)—those with incomes below $3,000 (in local purchasing
power). The BOP makes up 72% of the 5,575 million people recorded by
available national household surveys worldwide and an overwhelming
majority of the population in the developing countries of Africa, Asia,
Eastern Europe, and Latin America and the Caribbean—home to nearly
all the BOP.
9FGdXib\kÇ,ki`cc`fe
KFK8C9P@E:FD<J<>D<EK
9FG*'''
9FG),''
9FG)'''
9FG(,''
9FG('''
9FG,''
%j E=@:2@3A=C@13A7<AB7BCB3
(+
=fliY`cc`feg\fgc\]fidk_\YXj\f]k_\\Zfefd`ZgpiXd`[9FG Ç
k_fj\n`k_`eZfd\jY\cfn*#'''`ecfZXcgliZ_Xj`e^gfn\i %
This large segment of humanity faces significant unmet needs and
lives in relative poverty: in current U.S. dollars their incomes are less than
$3.35 a day in Brazil, $2.11 in China, $1.89 in Ghana, and $1.56 in India. Yet
together they have substantial purchasing power: the BOP constitutes a
$5 trillion global consumer market.
The wealthier mid-market population segment, the 1.4 billion people
with per capita incomes between $3,000 and $20,000, represents a $12.5
trillion market globally. This market is largely urban, already relatively
well served, and extremely competitive.
BOP markets, in contrast, are often rural—especially in rapidly grow-
ing Asia—very poorly served, dominated by the informal economy, and
as a result relatively inefficient and uncompetitive. The analysis reported
here suggests significant opportunities for more inclusive market-based
approaches that can better meet the needs of those in the BOP, increase
their productivity and incomes, and empower their entry into the formal
economy.
The analysis draws on data from national household surveys in 110
countries and an additional standardized set of surveys from 36 countries.
Using these data—on incomes, expenditures, and access to services—it
characterizes BOP markets regionally and nationally, in urban and rural
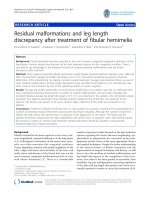
areas, and by sector and income level. The results show striking patterns
in spending. Food dominates BOP household budgets. As incomes rise,
however, the share spent on food declines, while the share for housing
remains relatively constant—and the share for transportation and tele-
communications grows rapidly.
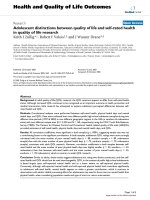
The composition of these BOP markets differs markedly across coun-
tries. Some, like Nigeria’s, are concentrated in the lowest income seg-
ments of the BOP; others, like those in Ukraine, are concentrated in the
upper income segments. Regional differences are also apparent. Rural
areas dominate most BOP markets in Africa and Asia; urban areas domi-
nate most in Eastern Europe and Latin America and the Caribbean.
9FG
,''
9FG
('''
9FG
(,''
9FG
)'''
9FG
),''
9FG
*'''
K_\j_Xi\f]@:K`eZi\Xj\j/$]fc[
]ifdk_\cfn\jkkfk_\_`^_\jk
9FGj\^d\ekj
K_\j_Xi\f]]ff[[\Zc`e\j
kfknf$k_`i[jk_\j_Xi\f]k_\gffi\jk
+
*
)
(
'%,
J?8I<F=J<:KFIJG<E;@E>
@E;<O<;KFK?<J?8I<F=K?<GFFI<JKJ<>D<EK
D\o`ZfÇ
j\Zkfij_Xi\jmXipn`k_`eZfd\
=ff[
?flj`e^
KiXejgfikXk`fe
@:K
7<B@=2C1B7=<j B63<3FB"07::7=<
(,
N_XkËje\n`ek_`jXeXcpj`j6
The underlying proposition that business activities can help reduce pov-
erty is not new. Many books and influential reports have outlined both
the need and the preconditions for a greater role for the private sector in
development (see, for example, Commission on the Private Sector and
Development 2004).
This report adds two important missing elements: a detailed if pre-
liminary economic portrait of the BOP—based on recorded incomes and
expenditures—and an overview of sector-specific business strategies
from successful enterprises operating in BOP markets. These data and
the record of experience back the calls for broader business engagement
with the BOP. Moreover, a guide to BOP markets is timely because signifi-
cant new investment—public and private—is being committed to serving
the BOP.
This work builds on concepts introduced by Hart and Prahalad (2002),
Prahalad and Hammond (2002), Prahalad (2005), and Hart (2005) and
explored by a growing number of authors (Banerjee and Duflo 2006;
Kahane and others 2005; Lodge and Wilson 2006; Wilson and Wilson
2006; Sullivan 2007). Based on their own definitions of the BOP, these
analysts have offered preliminary estimates of the BOP population vary-
ing from 4 billion to 5 billion. Providing an empirical foundation and a
consistent, worldwide set of baseline data is one motivation for the analy-
sis reported here. The analysis, with a focus on documenting BOP income
and expenditures, parallels similar efforts by Hernando De Soto to docu-
ment their assets (see box 1.1).
The development community has tended to focus on meeting the
needs of the poorest of the poor—the 1 billion people with incomes below
$1 a day (in local purchasing power). This analysis argues that a much
larger segment of the low-income population—the 4 billion people of
the BOP, all with incomes well below any Western poverty line—both
deserves our concern and is the appropriate focus of a market-oriented
approach.The starting point for the analysis is not just the BOP’s relative
poverty. Instead, it is the fact that BOP populations for the most part are
E`^\i`X
KFK8CJG<E;@E>9P@E:FD<J<>D<EK
9FG*'''
9FG),''
9FG)'''
9FG(,''
9FG('''
9FG,''
LbiX`e\
KFK8CJG<E;@E>9P@E:FD<J<>D<EK
9FG*'''
9FG),''
9FG)'''
9FG(,''
9FG('''
9FG,''
8j`X
LI98E ILI8C
CXk`e8d\i`ZX
LI98E
ILI8C
)*
*) -/
KfkXc9FGjg\e[`e^Yp`eZfd\
j\^d\ek#liYXeXe[iliXc