Authors libby rittenberg 192
Bạn đang xem bản rút gọn của tài liệu. Xem và tải ngay bản đầy đủ của tài liệu tại đây (449.38 KB, 1 trang )
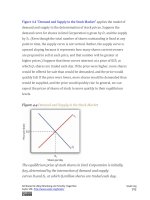
Figure 4.4 "Demand and Supply in the Stock Market" applies the model of
demand and supply to the determination of stock prices. Suppose the
demand curve for shares in Intel Corporation is given by D1 and the supply
by S1. (Even though the total number of shares outstanding is fixed at any
point in time, the supply curve is not vertical. Rather, the supply curve is
upward sloping because it represents how many shares current owners
are prepared to sell at each price, and that number will be greater at
higher prices.) Suppose that these curves intersect at a price of $25, at
which Q1 shares are traded each day. If the price were higher, more shares
would be offered for sale than would be demanded, and the price would
quickly fall. If the price were lower, more shares would be demanded than
would be supplied, and the price would quickly rise. In general, we can
expect the prices of shares of stock to move quickly to their equilibrium
levels.
Figure 4.4 Demand and Supply in the Stock Market
The equilibrium price of stock shares in Intel Corporation is initially
$25, determined by the intersection of demand and supply
curves D1and S1, at which Q1million shares are traded each day.
Attributed to Libby Rittenberg and Timothy Tregarthen
Saylor URL: />
Saylor.org
192
