ACCOUNTING FOR CHANGES IN BIODIVERSITY AND ECOSYSTEM SERVICES FROM A BUSINESS PERSPECTIVE potx
Bạn đang xem bản rút gọn của tài liệu. Xem và tải ngay bản đầy đủ của tài liệu tại đây (1.37 MB, 63 trang )
A
CCOUNTING FOR CHANGES IN BIODIVERSITY AND ECOSYSTEM
SERVICES FROM A BUSINESS PERSPECTIVE
Preliminary guidelines towards a Biodiversity Accountability Framework
Joël HOUDET
Charlotte PAVAGEAU
Michel TROMMETTER
Jacques WEBER
November 2009
Cahier n° 2009-44
ECOLE POLYTECHNIQUE
CENTRE NATIONAL DE LA RECHERCHE SCIENTIFIQUE
DEPARTEMENT D'ECONOMIE
Route de Saclay
91128 PALAISEAU CEDEX
(33) 1 69333033
mailto:
hal-00434450, version 1 - 23 Nov 2009
A
CCOUNTING FOR CHANGES IN BIODIVERSITY AND ECOSYSTEM
SERVICES FROM A BUSINESS PERSPECTIVE
Preliminary guidelines towards a Biodiversity Accountability Framework
Joël HOUDET
1
Charlotte PAVAGEAU
2
Michel TROMMETTER
3
Jacques WEBER
4
Cahier n° 2009-44
Abstract:
Biodiversity refers to the dynamics of interactions between organisms in changing
environments. Within the context of accelerating biodiversity loss worldwide, firms are under
increasing pressures from stakeholders to develop appropriate tools to account for the nature
and consequences of their actions, inclusive of their influences on ecosystem services used by
other agents. This paper presents a two-pronged approach towards accounting for changes in
biodiversity and ecosystem services from a business perspective. First, we seek to analyze
how Environmental Management Accounting (EMA) may be used by firms to identify and
account for the interactions between their activities and biodiversity and ecosystem services
(BES). To that end, we use dairy farming as a case study and propose general
recommendations regarding accounting for changes in biodiversity and ecosystem services
from a management accounting perspective. Secondly, after discussing the corporate
reporting implications of the main environmental accounting approaches, we propose the
underlying principles and structural components of a Biodiversity Accountability Framework
(BAF) which would combine both financial and BES data sets; hence, suggesting the need for
changes in business accounting and reporting standards. Because this would imply significant
changes in business information systems and corporate rating practices, we also underline the
importance of making the associated technological, organizational and institutional
innovations financially viable. The BAF should be designed as an information base, co-
constructed with stakeholders, for setting up and managing new modes of regulation
combining tools for mitigating BES loss and remunerating BES supply.
Keywords :
Accounting, business, biodiversity, ecosystem services, indicators, management accounting, financial
accounting, reporting, corporate social responsibility, standards, biodiversity accountability framework.
JEL classification
M20, M40, Q20
1
CREED – AgroParisTech, Ecole doctorale ABIES – UMR 8079 ESE – Orée du Fg Poissonnière, 75010 Paris
Corresponding author. Tel .:+33 (0) 1 48 24 31 39 e-mail address:
2
AgroParisTech – Engref, 19 rue du Maine, 75732 Paris cedex 15
3
INRA, UMR GAEL INRA – UPMF, BP 47 Grenoble cedex 9 – Department of Economics Ecole Polytechnique, Route de Saclay, 91128
Palaiseau cedex
4
CIRAD, Unité de recherche Ressources Forestières et politiques publiques, rue Scheffer, 75116 Paris
hal-00434450, version 1 - 23 Nov 2009
2
List of abbreviations:
BAF: Biodiversity Accountability Framework
BBII: Business and Biodiversity Interdependence Indicator
BES: biodiversity and ecosystem services
CBD: Convention on Biological Diversity
CSR: Corporate Social Responsibility
EMA: Environmental Management Accounting
ES: ecosystem services
EDS: ecosystem dis-services
hal-00434450, version 1 - 23 Nov 2009
3
1 - INTRODUCTION 4
2 - ACCOUNTING FOR BIODIVERSITY AND ECOSYSTEM SERVICES FROM A MANAGEMENT
ACCOUNTING PERSPECTIVE
6
2.1 Environmental Management Accounting (EMA) 6
2.1.1 General principles 6
2.1.1 Typology of environmental costs and revenues 6
2.1.2 Standard typology of ‘Input – Output’ flows 7
2.1.3 A limited understanding of ‘environmental’ performance or an underdeveloped tool? 8
2.2 Using EMA to account for the interactions between firms and biodiversity: dairy farming as a
case study 8
2.2.1 Defining biodiversity and ecosystem services: what interactions with businesses? 8
2.2.2 Methodology and aims 10
2.2.3 Accounting for material flows of biodiversity 11
2.2.4 Accounting for ecosystem services and their benefits to business 17
2.2.5 Accounting for BES gain(s) and loss(es) 23
2.2.6 Accounting for interactions between firms and other agents with respect to changes in BES
27
3 – ACCOUNTING FOR BIODIVERSITY AND ECOSYSTEM SERVICES FOR REPORTING PURPOSES
30
3.1.1 Corporate Social Responsibility: emerging responsibilities with respect to BES 30
3.1.2 Methodology and aims 32
3.1.3 Environmental reporting: from financial data differentiation to the inclusion of ecological
externalities? 33
3.1.4 Towards a Biodiversity Accountability Framework: changing accounting and reporting
standards to integrate both financial and BES data 38
3.1.5 Making changes financially viable by reforming modes of regulation 46
4- CONCLUSION 49
5- ACKNOWLEDGEMENTS 52
6- LIST OF FIGURES 52
7- LIST OF TABLES 52
8- LIST OF BOXES 52
9- REFERENCES 52
hal-00434450, version 1 - 23 Nov 2009
4
1 - INTRODUCTION
During the past few decades, firms have been under increasing pressures from
stakeholders to reduce their impacts on the environment. Ecological issues have become key
strategic variables for them, notably in terms of disclosures (Cho and Patten, 2007; Cormier et
al., 1993) now mandatory in many countries. Since decision VIII/17 was taken in Curitiba in
March 2006 at COP 8 of the Convention on Biological Diversity (CBD), the business
community has been asked, through the launch of the ‘Business and Biodiversity’ initiative, to
contribute actively to the objectives of the CBD. Supported by the European Commission, this
initiative calls for the adoption of best practices to reduce the impacts of businesses on
biodiversity and promote its conservation. Within the context of the associated environment –
competitiveness debate, biodiversity is usually understood as a new, additional form of
external environmental constraint on business activity (Houdet et al., 2009). It is linked
essentially to regulatory frameworks overseeing where and how businesses can operate,
chiefly through the appraisal of new industrial projects. Businesses make use of cost-benefit
analyses so as to capture the marginal economic value of biodiversity (inclusive of ecosystem
services) for trade-offs purposes: this allows them and their stakeholders to account for
biodiversity and ecosystem services (BES) loss or gain from an economic perspective. Yet,
despite numerous efforts, BES may not easily be translated into a monetary proxy for market
internalization
2
, hence some stakeholders arguing that the total economic value of
biodiversity, though useful, is not sufficient for arbitrage (i.e. the value of ‘remarquable
biodiversity’ cannot rigorously be approximated in monetary terms; Chevassus-au-Louis et
al., 2009). Accordingly, conventional business strategy amounts essentially at identifying,
assessing, monitoring and mitigating the impacts of business activities on (noticed)
biodiversity, especially on its components protected by law or those important to legitimate
stakeholders. For preexisting business activities on the one hand, this would involve at best a
cost-effectiveness approach with respect to negotiated or mandatory ecological goals linked to
changes in business practices. For new business projects on the other hand, mitigation
mechanisms - hybrid tools involving both markets and state regulation, based on a ‘no net
loss’ five-stage approach
3
, are actively being promoted worldwide, whilst various studies
highlight the importance of ecological equivalencies between areas degraded and areas
restored given the difficulties associated with the economic valuation of damages for trade-off
purposes (e.g. Llewellyn 2008; Strange et al., 2002).
Though impact mitigation mechanisms are necessary for the internalization of certain
biodiversity externalities, they fall short of the goal of fully integrating biodiversity into
business strategies and practices. Impact mitigation mechanisms restrict business perceptions
of its interactions with living systems to the management of their negative impacts on BES
(Houdet et al., 2009). Nonetheless, business attitudes, behaviors and strategies regarding
biodiversity are progressively changing. Previous work on the Business and Biodiversity
Interdependence Indicator (BBII) has shown that firms’ perceptions of their interdependences
with biodiversity are highly diverse, regarding to technologies, sales and the management of
2
Concerns are associated with the use of non-market valuation (e.g. contingent valuation) and benefit-transfer
techniques, including their underlying assumptions, the reproduction of protocols and the comparative analysis
of results across time and space (Bonnieux 1998; Kumar and Kumar, 2008; Nelson et al., 2009; Weber 2002).
3
It involves (a) avoiding irreversible losses of biodiversity (prevention), (b) seeking alternative solutions to
minimize losses, (c) using mitigation to restore biodiversity, (d) compensating for residual, unavoidable loss by
providing substitutes of at least similar biodiversity value, and (e) seeking opportunities for enhancement (BBOP
2009; IAIA 2005).
hal-00434450, version 1 - 23 Nov 2009
5
supply chains among many other issues (Houdet 2008). This suggests the emergence of
business strategies and practices which could go beyond impact mitigation and the search of a
compromise between development and conservation. Combining strategies for mitigating
BES loss (Polluter Pays Principle) and remunerating BES supply (Beneficiary Pays Principle)
opens the door to new forms of arbitrage with respect to land use and development (Aretino et
al., 200; Iftikhar et al., 2007; Trommetter et al., 2008), as well as business management and
production processes (Houdet et al., 2009). This approach may see BES maintenance or
provision becoming an integral part of the business plan of the firm, as a core variable among
others for decision-making and management and as a source of new assets, liabilities, skills,
technological and organizational innovations (Houdet et al., 2009).
Yet, a real awareness of the links between business and biodiversity is still of concern
mainly to large corporations and multinationals, the firms most visible to the general public
and those directly involved with living systems such as agribusiness (Houdet 2008; MA
2005). These are the corporations most likely to be subject to pressure from stakeholders,
including non-governmental organizations, local communities and Corporate Social
Responsibility (CSR) rating agencies. Currently available methodologies and tools which aim
to go beyond impact mitigation either follow an approach based on the analysis of risks and
opportunities with respect to ecosystem services (e.g. Ecosystem Services Review - Hanson et
al., 2008, which is appropriate from an investor perspective), or one which seeks to assess
firms’ perceptions of their interdependence with biodiversity (Business and Biodiversity
Interdependence Indicator; Houdet 2008). We posit that these are not sufficient to ensure
rigorous understanding and assessment of the nature and dynamics of interactions between
firm(s) and biodiversity. How may strategies combining mitigating BES loss and
remunerating BES ‘supply’ be fully appropriated by all firms then?
This paper hopes to contribute to the challenge of reconciling business with
biodiversity. To that end, we posit that (a) tools are needed so as to account for business
interactions with BES and that these need to be integrated into (b) (internal) management
information systems so as to guide decision-making and (c) (external) reporting tools for
institutional purposes (e.g. in reference to norms or statutory targets), notably stakeholders’
needs of a corporate responsibility framework inclusive of biodiversity and of ecosystem
services used by others. Accordingly, the aim of this paper is to propose guidelines so as to
account for business interactions with living systems, towards an operational Biodiversity
Accountability Framework (BAF). We first analyze how a management or cost accounting
approach (section 2) may help firms account for biodiversity and ecosystem services (BES),
from the perspective of the business manager who seeks to achieve organizational targets.
Then, we discuss how accounting for BES from a Corporate Social Responsibility (CSR)
perspective may influence business accounting and reporting standards (section 3).
hal-00434450, version 1 - 23 Nov 2009
6
2 - ACCOUNTING FOR BIODIVERSITY AND ECOSYSTEM SERVICES FROM A MANAGEMENT
ACCOUNTING PERSPECTIVE
In section 2, we seek to analyze how Environmental Management Accounting (EMA)
may be used by firms to identify and account for the interactions between their activities and
biodiversity and ecosystem services (BES). After synthesizing the conceptual foundations of
EMA (2.1) and providing a general framework of interactions between business and
biodiversity (2.2.1), we use dairy farming as a case study (2.2.2) and propose general
recommendations regarding accounting for material flows of biodiversity (2.2.3), ecosystem
services and benefits to business (2.2.4), biodiversity gains and losses caused by business
activities (2.2.5) and interactions between firms and other agents with respect to changes in
BES (2.2.6).
2.1 Environmental Management Accounting (EMA)
2.1.1 General principles
Cost or management accounting constitutes the central tool for internal management
decisions, such as product pricing, and is not regulated by law. This internal information
system deals with questions typically pertaining to the production costs for different products
and their selling prices. The main stakeholders in cost accounting are members of different
management positions within a company (Jasch 2003). There is a growing consensus that
conventional accounting practices do not provide adequate information for properly
supporting decision-making in terms of environmental stakes. To fill in this gap,
Environmental Management Accounting (EMA) has been receiving increasing attention
(Jasch 2008; Gale 2006). EMA is broadly defined to be the identification, collection, analysis
and use of two types of information for internal decision making (UNDSD 2001; Savage and
Jasch, 2005), namely (a) monetary information on environment-related costs, earnings and
savings and (b) physical information on the use, flows and destinies of energy, water and
materials (including waste). EMA may be particularly valuable for internal management
initiatives with a specific environmental focus, such as environmental management systems,
product or service eco-design, cleaner production and supply chain management.
2.1.1 Typology of environmental costs and revenues
Identifying and categorizing environmental costs and revenues can be done in various
ways in order to guide action plans and decision-making. These may be associated with
environmental media groups (e.g. air / climate, waste, noise and vibration; SEEA 2003), and
can be ‘sourced’ from different cost and revenue (or earning) categories (de Beer and Friend,
2006; Jasch 2003; Jasch and Lavicka, 2006; UNSD 2001). While revenues comprise sales of
by-products, subsidies, R&D investment grants, and sales of goods and services with an
‘environmental’ purpose (e.g. waste disposal and recycling), the US Environmental Protection
Agency (1995; 1996) distinguishes internal costs from external ones:
• On the one hand, internal environmental costs comprise (a) conventional costs such as
raw materials and capital equipments; (b) potentially hidden costs which result from assigning
environmental costs to overhead pools or overlooking future and contingent costs; (c)
hal-00434450, version 1 - 23 Nov 2009
7
contingent costs, which depend on uncertain future events; and (d) intangible costs, such as
image and ‘relationship’ / public relations costs (e.g. annual environmental reports)
4
.
• On the other hand, external environmental costs may include (a) environmental
impacts or damages for which firms are not legally liable and (b) adverse impacts on human
beings, their property and / or their welfare which cannot always be compensated through
legal means (de Beer and Friend, 2006). These costs relate to environmental externalities
because there is a legal vacuum (Huglo 2007) or no clearly established property rights, as the
Coase Theorem (1960) states. Accounting for such costs is difficult (towards full-cost
accounting; Bebbington et al., 2001; Canadian Institute of Chartered Accountants 1997) and
results are often contested (too arbitrary or partial, not rigorous); though some firms have
attempted to do so (e.g. the environmental report of BSO/Origin includes essentially
externalities linked to GHG; Huizing and Dekker, 1992).
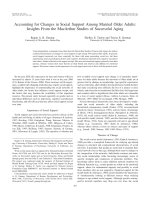
2.1.2 Standard typology of ‘Input – Output’ flows
Table 1: general input-output chart of accounts (UNSD 2001)
5
To assess costs fittingly, an organization must collect both monetary and non-
monetary data regarding materials use, labor hours and other cost drivers. Physical accounting
information is hence critical to the understanding of many environment-related costs. EMA
places a particular emphasis on materials and materials-driven costs because (1) use of
energy, water and materials, as well as the generation of waste and emissions, are directly
related to many of the impacts organizations have on their environment and (2) materials
purchase costs are a major cost driver in many organizations (UNSD 2001). The ‘input side’
of material flow accounts (Table 1) typically includes raw materials, auxiliary materials,
packaging, operating materials, merchandise, energy (gas, coal, biomass, etc.) and water. For
the ‘output side’ of material flow accounts (Table 1), one usually finds products (core
products and by-products) and non-product outputs (waste, waste water and air emissions),
4
Image and relationship costs are not intangible in themselves, but the direct benefits that result from such
expenses often are: e.g. difficulty of assessing the satisfaction of clients or employees.
5
One could argue that recent European directives (e.g. REACH) could significantly enlarge the scope of input-
output flows of an environmental nature that firms could monitor.
hal-00434450, version 1 - 23 Nov 2009
8
which may or may not be sold. On both cases, information is recorded in kilograms, litters or
kilowatt hours, as appropriate.
2.1.3 A limited understanding of ‘environmental’ performance or an underdeveloped tool?
Based on cost-efficient compliance with environmental regulation and self-imposed
environmental policies, EMA is argued to support environmental protection by purposely
targeting the simultaneous reduction of costs and environmental impacts (Savage and Jasch,
2005). To that end, EMA allows firms to develop and use environmental performance
indicators (EPIs) which may be based solely on physical data sets or may combine monetary
and physical data sets to create hybrid EPIs called eco-efficiency indicators
6
. In practice, the
most tangible and important implications for firms implementing this tool are two-pronged:
1. Quantifying the monetary impact that external environmental pressures (taxes, norms,
quotas, stakeholders’ demands) have on the business, by differentiating transactions of an
‘environmental’ nature from others (e.g. end-of-pipe / waste and emissions control costs,
including handling, treatment and disposal, and control-related regulatory compliance costs).
2. Putting a ‘price’ on non-product output (waste) by highlighting the purchase costs of
materials converted into waste and emissions.
However, while a cost-control approach to environmental issues is legitimate from a
business perspective, current EMA does neither fully quantify (a) business influence on BES,
nor (b) BES influence on its activities and production processes. Given the difficulties of
assessing most external costs (see aforementioned typology in sub-section 2.1.1), focus is on
more efficient use of energy, water and materials in business processes. Costs and earnings
pertaining to biodiversity and ecosystem services (BES) are either recorded as impact
mitigation expenses (e.g. remediation / compensation costs related to offsetting damages with
no or limited information in terms of ecological efficiency) or merely ignored (no identified
transactions); though some important drivers of ecosystem change are increasingly recorded
by environmental management systems (e.g. GHG and toxic gas emissions recorded as
physical outputs). How far may EMA - and its cost-control rationale - be expanded so as to
account for the nature and consequences of interactions between business and BES?
2.2 Using EMA to account for the interactions between firms and biodiversity: dairy farming
as a case study
2.2.1 Defining biodiversity and ecosystem services: what interactions with businesses?
Biodiversity refers to the dynamics of interactions between organisms in environments
subject to change. We speak of the fabric of the living world whose component parts are
interdependent and co-evolving. Biodiversity constitutes the engine which drives the
ecosystems of the biosphere and from which humans and firms derive ‘free’ ecosystem
6
The concept of eco-efficiency links monetary and physical EMA for decision making in a systematic manner.
An eco-efficiency indicator relates ‘product or service value’ in terms of turnover or profit to ‘environmental
influence’ in terms of energy, materials and water consumption, as well as waste and emission in terms of
volumes (Verfaillie and Bidwell, 2000).
hal-00434450, version 1 - 23 Nov 2009
9
service benefits
7
. It refers specifically to (a) the genetic diversity and variability within each
species
8
, (b) the diversity and variability of species and their forms of life and (c) the
diversity, heterogeneity and variability of interactions between species and of the ecosystem
structures, functions and processes directly or indirectly generated by living organisms.
As explained by Alain Pavé (2007), “one of the fundamental characteristics of living
systems is their capacity to organize themselves into increasingly complex nested structures:
genomes, cells, organs, organisms, populations, communities and ecosystems”. Their
connections and interactions can be presented as a hierarchy of living systems, with a
qualitative shift as we move from biological systems to ecological ones, since components of
ecological systems do not exhibit genetic coherence. While living systems are diversified,
self-regulating and adaptive, randomness-generating mechanisms (e.g. genetic mixing,
genomic sequence modifications, random gene expression during cell differentiation, finding
a sexual partner and sexual reproduction for many species) are necessary for their survival
and evolution.
The scientific issues around biodiversity are also economic, social and political issues,
each stakeholder having its own perceptions and agenda with respect to (some) BES aspects.
For an environmental NGO, biodiversity may relate to priceless life-forms that need to be
protected, especially those which are rare, endangered or ‘useful’ (e.g. charismatic species for
hunting, fishing or eco-tourism). From a business perspective, BES may be (Houdet 2008):
• A going concern issue (e.g. operational or image risks),
• A source of raw materials, assets, technologies and products,
• A source of revenues (e.g. sales of food products),
• Linked to private production costs (e.g. farming production costs), and
• Linked to social costs and business liabilities, both in terms of (possible) damages to
BES and additional costs incurred by impacted human communities.
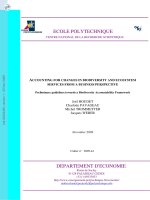
In other words, the interactions between business and BES are complex and evolving,
as are business perceptions of them (Houdet et al., 2009). Figure 1 shows a simplified, general
framework of interactions between BES and businesses, from the perspective of the business
community. It comprises three interacting interfaces:
(Interface 1) The firm seeks to avoid biodiversity and ecosystem dis-services (e.g.
weeds in farms – Zhang et al., 2007; pathogens for the meat-processing industry) and secure
specific / tailored BES benefits (e.g. raw materials, water quantity and quality) by managing
their source(s), delivery channel(s), and / or timing of delivery. To do so, there are various
options available, including (a) securing property rights over uses of and / or access to BES
(e.g. buying parts of a watershed to secure water supply and quality; Déprés et al., 2008), (b)
entering into contractual agreements with other economic agents influencing BES benefiting
it (e.g. payments for doing or not doing something such as paying farmers for specific
agricultural practices; Déprés et al., 2008) and / or (c) purchasing imported ‘artificial’
alternatives (e.g. replacing ES linked to soil ‘quality’ by fertilizers bought from agri-
business). These strategic and investment choices may generate BES externalities. For
instance, option (c) often leads to biodiversity loss (link with interface 3).
(Interface 2) What is the business responsibility towards BES? Changing business
perceptions, strategies, policies, routines, production processes, skills, extra- and intra-
organizational norms, development and investment choices, as well as associated institutional
7
Various definitions and typologies of ecosystem services have been proposed and no compromise has yet been
reached (Fisher et al., 2009; MA 2005; Ruhl et al., 2007).
8
Though humans, in all our cultural, linguistic and organizational diversity, belong to biodiversity (UNESCO
2008), we decide to exclude them from the scope of this article.
hal-00434450, version 1 - 23 Nov 2009
10
frameworks among other variables, all influence firms’ choices and practices regarding BES
(Houdet et al., 2009; link with both interfaces 1 & 3). How, to what extent and under what
rationale can business account for the nature and consequences of their interactions with
BES?
(Interface 3) The business has numerous direct and indirect influences on BES which
may or may not contribute to its revenues (link with interface 1), notably externalities with
respect to other economic agents, whether these influences relate to core business processes
and modes of BES appropriation, changes in land use, land assets controlled, owned or
managed, adjacent properties or livelihoods, the end-of-life of goods and services sold, or the
strategic choices made which may influence the behavior of its suppliers (e.g. purchasing
policy).
2.2.2 Methodology and aims
In section 2, we attempt to assess whether (and how) EMA can help firms identify and
account for the interactions between their business activities and biodiversity and ecosystem
services (BES). This means asking questions such as:
• What influences BES have on business activity, whether positive or negative?
• Reciprocally, what influences, whether positive or negative, the business has on BES?
• What would be the appropriate indicators characterizing such interactions?
• What types of monetary information are involved for decision-making (costs and
revenues)?
While attempting to address these, we choose to focus on the activities of a
hypothetical dairy farm, an agro-ecosystem which produces ‘raw milk’. There is a great
diversity of modes of production linked to this type of business activity. Various management
options are available to the farmer, notably in terms of stocking rate, cattle race selection,
forage budgeting and crop rotation system, grazing patterns, use of fertilizers and waste
management (FAO 2005). Previous environmental accounting studies involving farming
activities have essentially focused on material (inorganic nutrients, pesticides), water and
(Interface 2)
Assessing business
responsibility to BES is
two-pronged:
(a) Managing issues
which fall under its
legal control ;
(b) Managing other
issues through
stakeholder
engagement (suppliers,
local communities).
(Interface 3)
Managing business
impacts on BES,
both positive and
negative
(Interface 1)
Managing BES
sources, delivery
channels, timing
of delivery and
benefits to
business
Figure 1: a simplified and general framework of interactions between
businesses and BES.
hal-00434450, version 1 - 23 Nov 2009
11
energy flows (e.g. Bechini and Castoldi, 2009; Breembroek et al., 1995; Lamberton 2000),
besides expenses of an environmental nature (e.g. input expenses, waste and energy-related
costs). We arbitrarily choose a simple production system:
• Livestock grazing on permanent pastures during a significant part of the year;
• Cattle feed resources during winter provided in part by forage produced on-farm;
• All cattle feed supplements are bought / imported;
• No hydroponic / greenhouse cropping is involved and no milk processing occurs on-
farm.
By making use of this theoretical case study, we aim to provide preliminary
conceptual elements of an accounting framework to be used by any type of business. Current
limitations, challenges and research needs are also underlined. Given the nature of BES, we
choose to break-down our analysis into four complementary stages that attempt to account
for:
(a) Material flows of biodiversity (sub-section 2.2.3),
(b) Ecosystem services and benefits to business (sub-section 2.2.4),
(c) BES gain(s) and loss(es) caused by business activities (sub-section 2.2.5 )and
(d) Interactions between firms and other agents with respect to BES change (sub-section
2.2.6).
2.2.3 Accounting for material flows of biodiversity
By material flows of biodiversity we mean all inputs and outputs linked to living
systems which may be quantified in kilograms (kg), cubic meter (m
3
) or similar ‘physical’
units, whether transformed or untransformed by human activities, resulting from present and
past (e.g. petrol, gas, peat) ecosystem processes. Though they might be composed of
biological elements (e.g. wood, leather), the component parts of machinery, buildings,
vehicles and all similar assets are excluded from the analysis. We classify material flows of
biodiversity into 4 categories, differentiated on the basis that they are either inputs or outputs
and free or purchased: (1) purchased inputs, (2) ‘free’ inputs, (3) sold outputs, (4) unsold
outputs / residues.
(1) Purchased biodiversity inputs may comprise (Table 2):
• Untransformed biological materials (renewable resources): these purchased goods
may be cultivated or harvested, may comprise a single or many species, and may include any
bio-molecule (i.e. organic molecule produced by living organisms). Though they may be
modified in appearance, their composition or component parts remain essentially the same.
• Living organisms: these relate to species which bear certain functional characteristics
and which have been selected for specific business outcomes within the agro-ecosystem.
• Transformed biological materials: these purchased goods are produced by industrial
processes and include biological materials (both untransformed and engineered / synthetic
bio-molecules as well as genetically modified organisms and component parts or extracts)
among various other ecosystem components (e.g. inorganic and mineral components). For
instance, so-called ‘natural products’ of the pharmaceutical industry often belong to this
category (EFPIA 2007).
• Materials derived from transformed biological, non-renewable fossil resources:
these purchased goods are produced by industrial processes involving fossil materials derived
from long-term biogeochemical processes, chiefly products derived from the transformation
of crude oil.
hal-00434450, version 1 - 23 Nov 2009
12
Table 2: a typology of purchased biodiversity inputs for a dairy farm
Types of flow Units Data availability Cost category
Purchased biodiversity inputs
Untransformed biological materials (renewable
resources)
‐ Forage and supplementary feed: hay, silage,
press cakes
‐ Untransformed fertilizers:
composts, animal /
plant manures, humic substances…
‐ Seeds
Kg, ton or
m
3
, as
appropriate,
species name
and
geographic
origin
Purchasing documents ;
‘raw’ materials for
which most information
should be readily
available
Operating supplies
and materials
expenses
Living organisms
‐ Auxiliary insects and micro-organisms (e.g.
‐ Genetically unmodified seeds
‐ Livestock
Kg, number
of
individuals,
as
appropriate,
species name
and
geographic
origin
Purchasing documents ;
‘raw’ materials for
which most information
should be readily
available
Operating supplies
and materials
expenses
Materials derived from transformed biological, non-
renewable fossil resources
‐ Artificial fertilizers
‐ Pesticides
‐ Fuel
L, m
3
or kg,
as
appropriate
for each
component
part, species
name and
geographic
origin
Purchasing documents ;
complete information
may not be
communicated by
suppliers
Operating supplies
and materials
expenses
Transformed biological materials
‐ Fertilizers including ingredients derived from
living organisms (e.g. waste-water sludge
transformed into pellets)
‐ Pesticides including biological ingredients,
derived from living organisms (e.g. plant oils,
insect pheromones)
‐ Transformed cattle feed: composite feed,
proteins
‐ Pharmaceutical products, such anthelmintics,
and vaccines (inoculated pathogens)
‐ Genetically modified (GM) organisms, including
livestock feed and crop seeds
‐ Products containing GM ingredients
L / ml, kg /
μg, or %, m
3
as
appropriate
for each
component
part, species
name and
geographic
origin
Purchasing documents ;
complete information
may not be
communicated by
suppliers
Operating supplies
and materials
expenses
(2) ‘Free’ biodiversity inputs comprise 2 major components: (a) biological resources
cultivated within the farm’s agro-ecosystem and (b) auxiliary biodiversity co-evolving
with the business activity. These may be difficult to differentiate as auxiliary biodiversity is
actively selected for by business routines and practices, whether intentionally or not and
whether consciously or not; depending on the farmer’s knowledge and perceptions (e.g. some
key micro-organisms may be ignored or unknown).
• Biological resources cultivated within the farm’s agro-ecosystem (Table 3): these
material flows relate to biological products intentionally produced by the farm manager. They
hal-00434450, version 1 - 23 Nov 2009
13
are critical to milk production processes but may not all be precisely traced and quantified
(e.g. permanent pasture grasses eaten by livestock, though models may be used to estimate
overall biomass production, especially for cultivated crops; FAO 2005).
Table 3: a typology of biological resources cultivated on a dairy farm
Types of flow Units Data availability Cost category
Untransformed biological materials
‐ Livestock raised for milk production
‐ Forage crops, pasture (mix of species)
‐ Organic fertilizers: manures, crop residues,
composts
‐ Seeds produced for next year’s harvest
Transformed biological materials
‐ Genetically modified species (seeds, crops)
Kg / ton (t), t
/ ha, number
of units, as
appropriate;
species name
Should be quantified by
the farmer
(silage managed via
GIS, CAP documents)
No direct costs ;
farming practices
influence their
production (indirect
costs such as wages
and machinery
capital / operating
expenses)
• Auxiliary / associated biodiversity co-evolving with the business activity: this
category relates to all biodiversity components living within the farm’s agro-ecosystem and
positively contributing to revenue generation (raw milk production in this case). Auxiliary
biodiversity is directly linked to farm management practices and, hence, to most production
costs. Complex interactions between organisms and their inorganic environments preclude us
from determining any specific types of flows at the stage (what would be the relevant flow
units?), though they may involve soil micro, meso and macro-organisms, birds, pollinators
among others. On the other hand, not all biodiversity present within or adjacent to the dairy
farm contributes positively to its production processes. This opens the door to questions
pertaining to functional groups, ecosystem processes, (dis-)services and benefits, which will
be analyzed in the next sub-section (2.2.4).
(3) Sold biodiversity outputs (Table 4) for a dairy farm are relatively straightforward:
various categories of raw milk and, potentially, some by-products of farming activity (e.g.
forage surplus sold to other farmers). Though milk is classified as an untransformed product
according to the EEC rule n°1898/87, it is noteworthy to mention that milk is a ‘product’
resulting from complex agro-ecosystem processes which involve a wide variety of
transformed (e.g. fertilizers developed by the chemical industry, genetically modified
ingredients) and untransformed (e.g. substances generated by interactions between auxiliary
organisms), purchased and free biodiversity inputs. Accordingly, we argue that the
classification of milk products should depend on what has been consumed to produce it (see
recent development with respect to food labeling regarding genetically-modified organisms).
This underlines the difficulty of quantifying all the ecosystem components of any product
throughout their life-cycles. Ideally, accounting for material flows of biodiversity for each
sold output would require data for each of the ‘consumed’ biodiversity inputs involved in its
production, use and disposal (see sub-section 2.2.6 for further analysis).
hal-00434450, version 1 - 23 Nov 2009
14
Table 4: a typology of biodiversity outputs sold by a dairy farm
Types of flow Units Data availability Revenue categor
y
Transformed or untransformed biological materials,
depending on what has been consumed to produce them
‐ Principal product: raw milk (of varying quality for
diverse purposes)
‐ Co-product: forage
L, kg, and / or species
name as appropriate;
% weight / litter for
each component parts
Sale and traceability
documents
Sales
Living organisms as byproducts ; may be genetically
modified or classified as transformed biological outputs if
fed with transformed biological materials
‐ Livestock
‐ Seeds
Number of individuals;
species name and
geographic origin
Sale and traceability
documents
Sales
(4) Biodiversity residues (unsold outputs; Table 5): residues may be classified into various
types. According to the SEEA (2003), there may be solid and liquid waste, air emissions and
water emissions (soluble chemical inputs). For this case study, we look at residues which are
derived from the use, consumption and waste of material flows of biodiversity, including
erosion-associated residues. These flows are readily associated with environmental impacts by
public authorities (FAO 2005), so that farm environmental management systems are
increasingly focusing on their control and reduction (statutory norms, Common Agricultural
Policy - CAP, labeling for food – Moretto 2008; Tucker 2008; Gilbert and Bruszik, 2005).
Quantifying them in physical terms is not always straightforward. A standard EMA approach
would attempt to quantify the share of purchase materials converted into various types of
residues and account for them as non-product outputs (NPO) at purchase value
9
. To minimize
costs, assessments are often based on indirect measurements, results extrapolated from
theoretical yields or punctual direct measurements (e.g. conversion factors for carbon
accounting methodologies). For instance, nitrogen (N), phosphate (P) and potassium (K)
concentrations are often used as indicators of the end-of-life of various types of inputs
(fertilizers, compound feed; Breembroek et al., 1995).
9
For instance, the FAO (2005) proposes the valuation of nutrient loss using the replacement cost method,
arguing that depleted nutrients should be replaced as a means of conserving or restoring the quality or value of
the soil to its former condition for future generations. Nutrients are considered to have an economic value equal
to the market value of an equivalent amount of fertilizer. This economic value is then accounted for within
integrated accounts as depreciation expenses of nutrients / allowance for nutrient replacement.
hal-00434450, version 1 - 23 Nov 2009
15
Table 5: identifying biodiversity resides of dairy farming
Types of flow Units Data availability Cost category
Solid waste
- Plant and animal residues, chemical waste
Kg Highly variable,
depending on
legislation and
environmental
management system
in place
Material purchase
value of NPO,
linked to operating
expenses (waste
management and
disposal)
Liquid waste
‐ Lost milk
‐ Fertilizers and pesticides as dissipated inputs
L, kg / ha /
year, % loss /
concentration
indicators, as
appropriate
Highly variable,
depending on
legislation and
environmental
management system
in place
Material purchase
value of NPO,
waste management
and disposal costs
Air emissions
‐ CO
2
‐ Acid substances (e.g. NH3)
‐ Metallic (e.g. Ni)
‐ Organic compounds (e.g. methane from livestock
and biological decay)
Kg / ha / year,
% loss /
concentration
indicators, as
appropriate
Highly variable,
depending on
legislation and
environmental
management system
in place
Management and
disposal costs and
taxes potentially,
material purchase
value of NPO
Water emissions
- Remains and residues of fertilizers and pesticides
used as inputs
Kg / ha / year,
% loss /
concentration
indicators, as
appropriate
Highly variable,
depending on
legislation and
environmental
management system
in place
Management and
disposal costs and
taxes potentially,
Material purchase
value of NPO
This theoretical case study shows that a business can readily account for various
material flows of biodiversity, especially purchased and sold biodiversity outputs
10
. This
approach allows business to assess its material dependence on material flows of
biodiversity (MFB)
11
. It falls within a standard cost-management approach to their use (i.e.
minimizing non-product output). It also allows for differentiation between MFB which are
under its direct legal control or responsibility and those managed through its supply chains
and customers
12
: this provides some useful information regarding how the business secures
MFB necessary to its production processes, whether using what is produced within / derived
from its land / ecosystem assets or importing outputs derived from / produced in outer-
ecosystems.
Our proposed typology of MFB could be tested on real case studies and be fine-tuned
by applying it to other types of business activities within the same industry (i.e. agribusiness)
or other industrial sectors (e.g. cosmetics, pharmaceuticals, retailing, building). Combining
this MFB typology with the general input-output chart of accounts (Table 1) may constitute an
important step towards accounting for all material ecosystem benefits to business (Box 1
10
This is readily done by some organisations due to the nature of their business (e.g. close links between
biological goods / ingredients and marketing), though other classification typologies may be used according to
stakeholders’ needs (e.g. cosmetics, food retailing).
11
This would include biotechnologies and genetic resources in other business activities.
12
Sold outputs may generate further consumption of material flows of biodiversity by their users (e.g. car engine
conception predetermines user needs in terms of fuel consumption). This relates to a life-cycle approach to
product conception and design.
hal-00434450, version 1 - 23 Nov 2009
16
presents a conventional approach to accounting for MFB loss at the cost of replacement of
non-product output). To reach that aim, the challenge is two-pronged at this stage:
• Accounting for material flows of biodiversity ‘consumed’ by production processes
for both purchased inputs – i.e. materials consumed outside the dairy farm - and sold
outputs - i.e. materials consumed within the dairy farm. This means identifying and
quantifying each input / output at each stage of co-evolving production and ecosystem
processes (further analysis in sub-section 2.2.6).
• Accounting for auxiliary / associated biodiversity co-evolving with the business
activity and for which there is no direct cost (i.e. no purchase; further analysis in sub-
sections 2.2.4 and 2.2.5)
13
.
Box 1: business account divisions and entities for material flows of biodiversity (MFB)
using a conventional EMA approach focused on non-product output management
(modified from FAO 2005)
OPTION 1: INTEGRATED ACCOUNTING BY ADDING SATELLITE ACCOUNTS
Conventional business accounts
Material input-output statement
Balance sheet
Operating statement (budget)
Cash flow statement
Material flow accounts as satellite accounts
Material accounts in physical terms, including MFB
Material accounts in monetary terms, including MFB
OPTION 2: INTEGRATED ACCOUNTING BY NEW LINES ENTRIES (e.g. depreciation expenses /
allowance for replacements of non-product outputs, including that of MFB)
Main accounts
Material input-output statement, including MFB
Integrated balance sheet
Integrated operating statement (Budget)
Intermediate accounts
Material flow asset accounts
Conventional monetary accounts
NB: As previously argued, external environmental pressures with financial impacts on
business activity, such as taxes and waste management costs, are included in conventional
business accounts and can be differentiated from other transactions.
Though this work provides methodological clues to identify (a) what ‘types’ of MFB a
dairy farm directly consumes, (b) how much of each it does consume (weight, volume) and
13
This may be highly difficult for most business activities, except perhaps for ones which rely on individual
species: e.g. accounting for the bacteria biomass on which a waste-water treatment plant relies for “free” water
purification.
hal-00434450, version 1 - 23 Nov 2009
17
(c) at what cost
14
, it fails to fully account for business interactions with ecosystems (next 2
sub-sections), notably its impacts on biodiversity and ecosystem services used by others (sub-
section 2.2.5). Indeed, conventional EMA focuses on material residues of production
processes, irrespective of whether derived from biodiversity inputs or not. Though waste and
emissions are drivers of ecosystem change, they may or may not lead to BES loss. For
instance, this may depend on whether nutrient concentration goes beyond specific thresholds
(e.g. nitrogen in water bodies). Providing information about the component parts of a fertilizer
(e.g. percentage of nitrogen) - though highly useful for policy and management purposes -
does not tell us much about their geographical origin, the materials consumed to produce them
and the consequences of their modes of production and / or appropriation, including the
resulting direct and indirect biodiversity gain(s) or loss(es).
2.2.4 Accounting for ecosystem services and their benefits to business
The previous sub-section underlines that biodiversity plays a critical role in the
production processes of a dairy farm: it influences agro-ecosystem processes, notably as
components of material inputs (purchased biodiversity inputs), cultivated organisms and
auxiliary / associated biodiversity. In addition, dairy farmers derive ecosystem service (ES)
benefits from interacting organisms, ecosystem structures, functions and processes. A business
accounting system which only accounts for the material flows of biodiversity
15
would fail to
fully account for the interactions between business and ecosystems, hence this partial
16
attempt which aims to formalize a preliminary understanding of what an accounting
framework for ES useful to a business activity (a dairy farm) would look like. To that end,
the challenge is two-pronged:
• How can business quantify the contribution of ES to their revenues?
• And reciprocally, how can business quantify their influence on desired ES?
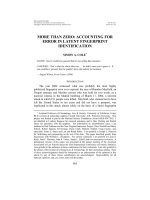
Figure 2 proposes a general understanding of interactions between farming practices,
agro-biodiversity, ecosystem structures, functions, services and benefits to the dairy farmer.
Farming practices directly influence agro-biodiversity (i.e. active selection processes which
favors co-evolutionary dynamics with specific species), which encompasses both biodiversity
components planned by the dairy farmer (e.g. livestock, crops ; depending on management of
purchased inputs and spatial / temporal arrangements) and biodiversity components associated
with the latter (Vandermeer and Perfecto, 1995), whether auxiliary to the business activity
(e.g. crop pollinators) or not (e.g. pathogens, biological invasions; concept of ecosystem
disservices or ‘EDS’
17
- Zhang et al., 2007). Agro-biodiversity contributes to ecosystem
functions (i.e. builds and maintains ecosystem structure: e.g. mosaic of habitats) and enables
ecosystem dynamics (e.g. predator-prey relationships, growth and reproduction cycles) both
of which, in turn, influence ES sources, provision timing, delivery channels, distance delivery,
and delivery timing (Ruhl et al., 2007); and this positively or negatively from the farmer’s
14
If purchased or linked to indirect costs such as wages and capital expenses, as is the case for biological outputs
cultivated within the farm’s agro-ecosystem.
15
A type of ES benefits: i.e. ‘provision services’ according to the Millennium Ecosystem Assessment (2005).
16
Business’ influences on biodiversity and ecosystem services will be discussed in the next sub-section 2.2.5.
17
Ecosystem dis-services may be generated locally (e.g. crop loss due to pathogens / pests or competition
between species for the same resources – weeds; Stoller et al., 1987) or regionally / globally (ES loss at the
landscape level due to activities by other agents such as forest plantation programs that diminish water runoff /
availability to downstream users). We may speak of a continuum of ecosystem services – disservices, contingent
to the differentiated needs of users and associated thresholds between alternative states (e.g. Carpenter et al.,
2002).
hal-00434450, version 1 - 23 Nov 2009
18
perspective
18
. Furthermore, according to Lavorel et al. (2008), ES linked to agricultural
activities may be classified into three categories:
1. Input services, which include: (a) resource input services contributing to resource
production and to physicochemical supports of agricultural production (e.g. soil structure and
fertility) and (b) input services of biotic regulation which ensure the regulation of
interactions between organisms, whether positive or negative to agriculture (e.g. pollination,
protection of livestock’s health, control of pathogens).
2. Production services contributing to agricultural revenue
19
, which relate essentially
to biomass production (vegetal, animal) generating sold outputs (e.g. milk) and co-products,
in terms of quantities, spatial and temporal variability / stability as well as of quality of the
outputs / products.
3. Services produced outside of agricultural revenue which include, for instance, the
control of water quality, carbon sequestration or landscape aesthetical values (tourism).
ES may be used directly (dynamics-based) or indirectly (structure-based) by the dairy
farmer (Costanza et al., 1997; Ruhl et al., 2007), who hence derives various benefits
contributing to its business activities and revenue (category 1 and 2). In addition, services
produced outside of agricultural revenue may benefit other economic agents (category 3), for
instance local / adjacent communities or society at large (i.e. positive externalities).
According to Levin (1998), ecosystems are “prototypical examples of complex
adaptive systems”. Costanza (1996) explains that such systems are characterized by “(1)
strong, usually non-linear interactions among the parts, (2) complex feedbacks loops that
make it difficult to distinguish cause from effect, (3) significant time and space lags;
discontinuities, thresholds and limits, all resulting in (4) the inability to simply ‘add up’ or
aggregate small-scale behaviors to arrive at large-scale results”. In other words, there are no
direct, linear relationships between ecosystem functions, services and benefits, biodiversity
and farming practices: these relationships are many-to-many, which renders complex the task
of precisely understanding the role(s) played by biodiversity, whether favorable or
unfavorable (e.g. weeds, pathogens) to the business activity. For instance, in the case of our
theoretical dairy farm, soil fertility is an essential resource input ES critical to both permanent
pastures and cultivated crops needed by livestock. More precisely, the diversity, abundance,
assemblages and interactions of plant species, mycorrhizae, and other soil organisms
influence organic matter (mineralization, decay) and nutrient (elementary transformation,
solubilisation) dynamics (i.e. availability for plant uptake), which in turn influences both the
quantity and quality of produced milk (Lavorel et al., 2008). Accordingly, biodiversity may be
beneficial to soil fertility (and to other categories of agro-ecosystem services), but some of its
components may also generate damages (e.g. unpalatable species invasion and their ensuing
competition with palatable ones) or may not currently have any significant effect on a specific
ES (i.e. highly uncommon and / or functionally redundant species).
The framework proposed in Figure 2 could be applied and adapted to other types of
businesses (e.g. cosmetics, retailing). In the present context, it may help the dairy farmer
assess (or better formalize its understanding of) the ecosystem services and associated
biodiversity on which its operations (dairy farming) and sales (milk) directly and indirectly
depend, including the delivery mechanisms from source(s) to final use(s) / benefit(s). Though
benefits of some production services contributing to agricultural revenue may be readily
accounted for by the dairy farmer (i.e. material inputs / outputs discussed in the previous sub-
18
Off-farm functional (option / insurance value) and associated biodiversity may also play a role in ES benefits
secured by the dairy farmer (Pascual and Perrings, 2007).
19
These would include material flows of biodiversity, also classified as “provision services” by the Millennium
Ecosystem Assessment (2005).
hal-00434450, version 1 - 23 Nov 2009
19
section), the assessment of the contribution of other types of ecosystem services to the
farmer’s revenue is far from straightforward. This requires the development and use of
appropriate sets of indicators, including structural (indirect), taxonomic (direct), composite
and / or single-parameter indicators (Levrel 2007). For each ecosystem service benefit, one
would identify (and use) indicators of the ecosystem services, functions and structures
involved, as well as of biodiversity components which build and enable them. Yet, such
information is often unavailable and / or costly to obtain, or we may not know exactly what to
look for. Even if beneficial effects of biodiversity are brought to the fore, these are rarely
formulated in terms of amplitude, which would be more than necessary for an assessment of
their usefulness to agricultural production (Lavorel et al., 2008). Lastly, off-farm biodiversity
and sources of ES (e.g. water purification and flood mitigation ; Goldman et al., 2007) would
play a major role in securing on-farm ES delivery, hence the probable need for a landscape
and regional approach for their management (i.e. an individual farm is situated within a
matrix of interconnected ES ‘providers’ and users
20
; Ruhl et al., 2007).
From an EMA perspective, several important points need to be emphasized:
• First, we must emphasize the fact that business benefits derived from ecosystem
services are not based on monetary transactions
21
. Indeed, no one pays ecosystems (or its
component parts) for harvested fish species or the air humans breathe. We may pay other
humans (sole exception to our argument in the previous sentence), whether individuals or
groups of individuals represented by ‘legal persons’ (e.g. companies, partnerships, states), for
the various rights attached directly or indirectly to the use of such ES benefits (e.g. markets
for tradable CO
2
emission quotas, user fees for collecting firewood or for opening and running
an open-pit mine and hence ‘gaining access’ to minerals derived from ecosystem processes
over geologic time scales). With respect to dairy farming, purchased inputs - whether
biological or not - merely refer to transactions meant to secure the use of material ES benefits
delivered elsewhere and imported through contractual agreements with other economic
agents. The monetary units associated with such transactions would correspond to the costs
borne by the contracting party so as to make them available for sale – in addition to a profit
margin. Otherwise, ES benefits derived from the agro-ecosystem managed by the dairy farmer
are secured though farming choices and practices, and their associated expenses; including
those linked to the purchase, use and management of farming inputs and those due to the
management of the temporal and spatial arrangements of agro-biodiversity, both planned and
associated.
20
The delivery of ES benefits may be contingent on other ES whose maintenance depends on both (a) the
practices of other agents and (b) the interactions between these agents and other ES.
21
The focus is not on capturing the economic value of BES: EMA may help differentiate costs and revenues
according to their ‘environmental’ nature or aim, in this case the nature and consequences of the underlying
transactions and associated practices.
hal-00434450, version 1 - 23 Nov 2009
20
• Secondly, land-use spatial and temporal patterns, production models (e.g. projected
outputs, valuation), nutrient management, operating expenditures (materials, labor use, hire
and maintenance of equipment, depreciation of dairy farming related assets), and investment
choices (e.g. land ‘improvement’, equipment, construction) and sales / subsidies are directly
and indirectly linked to the management of ES benefits, whether derived from the farm’s
agro-biodiversity, ecosystem functions and processes (direct relationship with ecosystem
services), purchased from elsewhere (indirect relationship; ES benefits - e.g. ‘natural’
fertilizers - delivered to other agents who chose to trade them with the dairy farmer) and / or
both. The second option is sought when the first is too costly and uncertain given production
aims; the latter being ‘chosen’ and organized according to legal and financial incentive
frameworks in place (e.g. Common Agricultural Policy’s subsidy system in the EU)
22
. Such
trade-offs may fall within a standard EMA framework for assessing which costs and revenues
are related to biodiversity and ecosystem services. Using cost accounting techniques, one may
able to differentiate the direct and indirect costs of arbitrages with respect to alternative
modes of ES benefit appropriation, including spatial / temporal trade-offs (Box 2). Assigning
cost categories to the management of a single ES may be relatively straightforward (e.g.
Gonzalez and Houdet, 2009). However, expenses may influence various ES simultaneously,
hence the need for multi-criteria accounting data differentiation.
• Thirdly, dairy farmers would logically gear their farm management towards choices
and practices which secure important ES benefits at the lowest possible costs, while
satisfying requirements for obtaining subsidies (e.g. conditionality of the CAP in the EU ;
22
In fact, buying inputs produced elsewhere is actively promoted by most institutional frameworks governing
farming activities worldwide (FAO 2005; Roger-Estrade et al., 2008).
hal-00434450, version 1 - 23 Nov 2009
21
Trommetter et al., 2008), and gaining access to markets for their agricultural production (i.e.
milk quality standards / terms of reference). This may or may not favor biodiversity and local
ES sources (within the agro-ecosystem or within its vicinity), as well as their provision
timing, delivery channels and delivery timing. This will depend essentially on whether
farmers have chosen or choose to replace diverse sets of interacting organisms, which are
responsible for the delivery of on-farm production ES contributing to agricultural revenue, by
purchased artificial inputs (i.e. biodiversity-poor intensive agricultural systems
23
; Pascual and
Perrings, 2007). If they choose to favor on-farm functional diversity and their associated
ecosystem services, these could be argued to become ‘usual’ functions or factors of farm
production.
• Fourthly, because they are few or no real opportunities for paid contractual agreements
regarding farming practices already or potentially leading to ecosystem service delivery to
other economic agents, dairy farmers would have few (if no) incentive(s) to promote the
agro-biodiversity linked to services produced outside of agricultural revenue
24
. As argued
by Roger-Estrade et al. (2008), factors playing a role in adopting farming practices favorable
to biodiversity are numerous, variable and contextual to the business activity and to the socio-
ecological system in which the latter takes place: they relate to technical, economic,
institutional and psychological issues.
• Lastly, by combining the assessment of the functional roles played by agro-
biodiversity with that of the influence of farming practices on the latter, farmers may readily
compare alternative production choices or models with respect to functional agro-biodiversity
(spatial and temporal ES trade-offs). This means developing an integrated management
information system based on indicators of interactions (Levrel 2007), which would
combine monetary and physical accounting data (sub-section 2.2.3) with quantitative and
qualitative indicators of important variables identified at each step of framework proposed
in Figure 2 (e.g. temporal and spatial information regarding diversity and abundance of
functional biodiversity). Such sets of indicators may help farmers fine-tune their farm
management system, notably helping them to evaluate the costs of reaching chosen levels of
ecosystem services derived from his managed agro-ecosystem and / or neighbouring ones
25
,
depending on the ES in question, whether voluntarily, in response to customers’ demands (e.g.
labels) and / or to satisfy potential public policies, regulations and / or incentive schemes.
Though expected cost savings may be an attractive motive for reducing purchases of artificial
inputs, the transactional basis (revenue structure) for agricultural revenue generation may
need to evolve so as to compensate for possible concomitant reductions in agricultural
production (livestock biomass, milk) and hence ‘normal’ revenues (sales, subsidies). Box 2
underlines accounting data requirements of a possible step-by-step process for managing ES
benefits to a dairy-farming business.
23
Intensifying some farming practices (e.g. use of fertilizers and pesticides, stocking rate) is correlated to
reduced species richness and increased uniformity of species present for various groups of organisms as well as
major changes in functional characteristics of remaining species (Lavorel et al., 2008).
24
Natura 2000 contractual agreements in Europe can be, in some ways, an exception to this rule (Trommetter et
al., 2008). Indeed, the influence of farming practices on agro-biodiversity is contingent to institutional
frameworks (incentives, subsidies, regulations; Roger-Estrade et al., 2008).
25
This will require cooperating with other landowners and users and possibly the participation of both
independent organizations and governmental ones.
hal-00434450, version 1 - 23 Nov 2009
22
Box 2: managing ES benefits to business – the case of dairy farming: step-by-step
approach and associated accounting data requirements
S
TEP 1 - Identifying / quantifying the relevant ecosystem service (ES) benefit(s) to business,
in terms of desired:
As appropriate:
‐ ‘Quality’;
‐ ‘Quantity’;
‐ Provision / delivery channel(s), distance and timing.
S
TEP 2 - Developing an accounting / information management system for ecosystem service
benefit(s):
Based on three possible modes of ES benefit(s) appropriation:
(a) If ES benefit derived on-farm, indicators would need to be developed for managing:
‐ The ecosystem service(s) contributing to this benefit : e.g. soil fertility contributes to the
‘grazing quality’ of permanent pastures and to the biomass / nutritive quality of
cultivated crop outputs ;
‐ The associated agro-biodiversity (functional groups), agro-ecosystem structures,
functions and processes / dynamics.
(b) If ES benefit(s) derived from surrounding ecosystems, the farmer may need to engage
with land (ES sources) owners, managers and users to:
‐ Develop collective tools / indicators for managing them;
‐ Sign contractual / informal agreements to secure, share and / or pay the contracting
party to manage ES benefits as desired.
(c) If ES benefit(s) secured through purchased artificial inputs, information should be easier
to record; though this may go beyond the legal control or responsibility of the farmer (see
sub-section 2.2.6)
S
TEP 3 – For each mode of ES benefit appropriation (step 2), assessing the associated:
‐ Agricultural production models and practices, including land-use pattern as well as
fertilizer, pesticide, nutrient and sanitary management;
‐ Operating expenditures, and investments;
‐ Revenues (sales, subsidies).
S
TEP 4 - Data analysis for assessing the mode(s) of ES benefit appropriation and associated
transactions:
‐ Expenses linked to each mode of benefit appropriation (see step 3);
‐ Revenues contingent to each mode of benefit appropriation.
Developing appropriate performance indicators (ratios) for qualifying the type of business
activity based on its mode of ES benefit(s) appropriation: e.g. expenses linked to ES
benefit(s) derived on-farm / total expenses, subsidies linked to ES benefit(s) secured through
purchased artificial inputs / total subsidies or total revenues.
STEP 5 – Reframing business strategy (going back to step 1):
Based on current cost and revenue structure and its associated mode of ES benefit(s)
appropriation, develop a short-to-long term business strategy with respect to the
appropriation of ES benefit(s).
hal-00434450, version 1 - 23 Nov 2009
23
Through this theoretical case study, we seek to provide a clearer understanding of
business arbitrages and associated information requirements with respect to ecosystem
services that are useful to its production processes. This could be tested on other types of
business activities which would imply varying modes of appropriation of ES benefits.
Applying it to operating dairy farms may (a) raise farmers’ awareness of the roles played by
on-farm associated biodiversity in terms of ecosystem structures, functions and processes
sustaining ES and (b) highlight alternative options for practices which favor them instead of
relying on purchased artificial inputs usually correlated with the ‘loss’ of both on-farm input
services and services produced outside of farming revenue. To that end, we emphasize the
need for more research into the mapping of ES (Goldman et al., 2007; Nelson et al., 2009;
Ruhl et al., 2007; i.e. sources, delivery distance / channels and uses / users, their associated
timing) and the development of operational sets of ES indicators (benefit quantitative /
qualitative description, agro-biodiversity, ecosystem structures and dynamics involved), as
part of a comprehensive agro-ecosystem management accounting system.
2.2.5 Accounting for BES gain(s) and loss(es)
In this sub-section, we attempt to discuss accounting for biodiversity and ecosystem
services gain(s) and loss(es) linked to a business activity, from the perspectives of both direct
and indirect impacts associated with (a) material flows of biodiversity (MFB) and (b)
business interactions with biodiversity and ecosystem services (BES). We do not seek to
be comprehensive in our analysis of each approach but seek to underline their principles,
advantages, complementarities and limitations. This partially falls within a critical approach
to EMA (Cullen and Whelan, 2006; Milne 1996), as opposed to a conventional or ‘private
cost’ approach used for sub-sections 2.2.3 and 2.2.4.
(a) Direct and indirect impacts associated with material flows of biodiversity
(MFB)
EMA is highly useful to identify and quantify what MFB and other material flows
(including residue outputs which may provide indirect measures of ecosystem change) are
consumed by production processes. It provides the accounting data structure necessary to
inform management and may be used to develop various indicators of:
• Dependence on biodiversity material resources: e.g. ratios of purchases for different
categories of MFB over total purchases (measured in monetary and non-monetary units);
purchases costs of MFB (globaly or for each type) consumed to produce a good over its
selling price (per unit of goods sold or global sales)
26
;
• MFB use efficiency (standard EMA performance indicators), which can be useful if
(comparable) data sets are compared over time: these will help managers assess the efficiency
of the production processes involving MFB.
Yet, these indicators will provide limited information to data users regarding the
biodiversity loss(es) or gain(s) associated with consumed MFB. Various complimentary
approaches need to be underlined:
• Managing non-renewable biological / fossil resources (e.g. fossil fuels) relates
essentially to extracting / exploiting an exhaustible resource (optimal extraction rate;
Hotelling 1931) and the direct and indirect (e.g. leakage) ecosystem impacts (positive and
26
This type of information may be critical to access-and-benefit sharing issues which are currently relevant to
several industries making use of genetic materials.
hal-00434450, version 1 - 23 Nov 2009
24
negative) associated with firms’ modes of appropriation and production (e.g. spatial footprint
of assets, including the loss of habitats / populations on-site and ecological connectedness at
the landscape scale). With respect to the latter, various programs worldwide are ongoing so as
to develop standards and markets for mitigating / offsetting biodiversity loss associated with
new development projects or changes in land-use (e.g. BBOP 2009), with ecological
equivalency methods at the heart of challenges and controversies (Chevassus-au-Louis et al.,
2009; Dunford et al., 2004; Faber-Langendoen et al., 2008; Fennessy et al., 2007; Trommetter
et al., 2008; US NOAA 1995).
• For renewable biological resources, including living organisms, challenges are
associated with the management of their modes of appropriation (e.g. access and benefit
sharing issues) and production (e.g. agricultural techniques) and their associated impacts on
biodiversity and ecosystems, whether positive or negative. This may require the use of
multiple, complementary tools. For instance, various standards (checklists, norms, labels) are
dedicated, wholly or in part, to the ‘sustainable’ management or use of such resources. Firms
may screen goods sold and suppliers according to the standards to which they adhere or which
they respect. This may lead to better stewardship of ecosystems from which businesses derive
MFB. For instance, purchased inputs may be labeled (e.g. FSC - forest management label
promoted by the Forest Stewardship Council, MSC - Fishery management label promoted by
the Marine Stewardship Council), or excluded from the portfolio of supplies on the basis that
concerned species are red-listed by IUCN. Various organizations are also working towards the
development of best practices standard for access and benefit-sharing for biotechnologies and
genetic resources (SECO 2007). Changes in land-use so as to produce renewal biological
resources may generate biodiversity loss, especially if it involves monocultures and artificial
or impermeable infrastructures, and should theoretically be subject to environmental impact
assessments combined with appropriate offset measures; similarly to what is required for the
exploitation of non-renewable biological / fossil resources. A ‘no net loss’ approach is being
promoted, notably by the International Association for Impact Assessment (IAIA 2005) and
Business and Biodiversity Offset Program (BBOP 2009). IAIA’s five-stage approach involves
(a) avoiding irreversible losses of biodiversity (prevention), (b) seeking alternative solutions
to minimize losses, (c) using mitigation to restore biodiversity, (d) compensating for residual,
unavoidable loss by providing substitutes of at least similar biodiversity value, and (e) seeking
opportunities for enhancement.
From this perspective, firms would be able to assess and differentiate the various
costs of managing impacts on biodiversity which relate to their dependence on MFB (e.g.
towards ratios of mitigation expenses over sales revenue contingent to MFB and / or purchase
costs of MFB). These costs could be associated to the direct and indirect impacts on
biodiversity, including that of MFB derived from species harvested from ecosystems (e.g.
fisheries, medicinal plant components), and may involve strategic thinking with respect to
modes of appropriation, production and innovation (Houdet 2008; Houdet et al., 2009).
However, (non-monetary) indicators of changes in biodiversity are still mostly lacking. Those
available often target indirect drivers of ecosystem change, or are merely incomplete in their
coverage of business and biodiversity interactions. For instance, organic food labels prevent
farmers from using ‘artificial’ fertilizers and pesticides. This may have positive impacts on
some functional groups, including organisms auxiliary to farming activities (Burel et al.,
2008). However, landscape heterogeneity (e.g. high densities of heterogeneous hedges), an
aspect currently omitted by such labels, is the key to ensuring the viability of numerous
species, especially which are mobile or require a diversity of habitats for their life-cycles
(Burel et al., 2008; Holzschuh et al., 2007; van Elsen 2000). What’s more, a MFB approach
tends to focus business attention on single species rather than on biodiversity – that is the
hal-00434450, version 1 - 23 Nov 2009