Authors libby rittenberg 739
Bạn đang xem bản rút gọn của tài liệu. Xem và tải ngay bản đầy đủ của tài liệu tại đây (466.51 KB, 1 trang )
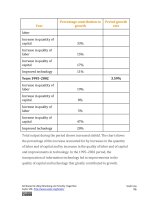
Figure 14.2 Supply and Marginal Factor Cost
The table gives prices and quantities for the factor supply curve plotted
in the graph. Notice that the marginal factor cost curve lies above the
supply curve.
Suppose the monopsony firm is now using three units of the factor at a
price of $6 per unit. Its total factor cost is $18. Suppose the firm is
considering adding one more unit of the factor. Given the supply curve, the
only way the firm can obtain four units of the factor rather than three is to
offer a higher price of $8 for all four units of the factor. That would
increase the firm’s total factor cost from $18 to $32. The marginal factor
cost of the fourth unit of the factor is thus $14. It includes the $8 the firm
pays for the fourth unit plus an additional $2 for each of the three units the
firm was already using, since it has increased the prices for the factor to $8
from $6. The marginal factor cost (MFC) exceeds the price of the factor. We
can plot the MFC for each increase in the quantity of the factor the firm
uses; notice in Figure 14.2 "Supply and Marginal Factor Cost"that
the MFC curve lies above the supply curve. As always in plotting in
Attributed to Libby Rittenberg and Timothy Tregarthen
Saylor URL: />
Saylor.org
739
