Cadmium and lead contents in rice and other cereal
Bạn đang xem bản rút gọn của tài liệu. Xem và tải ngay bản đầy đủ của tài liệu tại đây (111.12 KB, 11 trang )
Ž.
The Science of the Total Environment 281 2001 165᎐175
Cadmium and lead contents in rice and other cereal
products in Japan in 1998᎐2000
Shinichiro Shimbo
a
, Zuo-Wen Zhang
a,b
, Takao Watanabe
c
,
Haruo Nakatsuka
d
, Naoko Matsuda-Inoguchi
d
, Kae Higashikawa
e
,
Masayuki Ikeda
e,
U
a
Department of Food and Nutrition, Kyoto Women’s Uni¨ersity, Kyoto 605-8501, Japan
b
Institute of Occupational Medicine, Chinese Academy of Pre¨enti¨e Medicine, Beijing 100050, PR China
c
Miyagi Uni
¨ersity of Education, Sendai 980-0845, Japan
d
Miyagi Uni¨ersity, Taiwa-cho 981-3298, Japan
e
Kyoto Industrial Health Association, 67 Nishinokyo-Kitatsuboicho, Nakago-Ku, Kyoto 604-8472, Japan
Received 10 March 2001; accepted 3 April 2001
Abstract
Ž.
Cereals, especially rice, are a major source of cadmium Cd intake for general Japanese populations. In
Ž.Ž. Ž. Ž .
1998᎐2000, rice polished , bread loaf , noodle and wheat flour samples 4113 samples in total were collected in 63
cities all over Japan, and analyzed for Cd by inductively-coupled plasma mass spectrometry. Another pollutant
Ž. Ž.
element of lead Pb was determined in parallel. The grand geometric mean for Cd in polished raw uncooked rice
was 50 ngrg, whereas it was 19 ngrg for flour. The value for Pb was 2᎐3ngrg in rice and flour. Calculation for daily
Cd intake via rice, taking advantage of the present findings on Cd contents in rice and wheat together with
administrative area-specific daily consumptions of rice and wheat showed that Cd via rice is much more than Cd via
wheat and that Cd via rice is highest in an area alongside the sea of Japan among the whole country, the observation
being in agreement with the results from a previous food duplicate-based field survey. ᮊ 2001 Elsevier Science B.V.
All rights reserved.
Keywords: Cadmium; Cereal products; Flour; Japan; Lead; Rice; Wheat
U
Corresponding author. Tel.: q81-75-823-0533; fax: q81-75-802-0038.
0048-9697r01r$ - see front matter ᮊ 2001 Elsevier Science B.V. All rights reserved.
Ž.
PII: S 0 0 4 8 - 9 6 9 7 0 1 00844-0
()
S. Shimbo et al. r The Science of the Total En
¨ironment 281 2001 165᎐175166
1. Introduction
Cereals, especially rice that is the staple food
for general Japanese populations, were identified
also as the major source of cadmium intake among
the victims of Itati-itai disease endemic in the
Jinzu River Basin in Japan in the mid 20th cen-
Ž.
tury Environment Agency, 1972 . Rice-originated
Cd intake still accounts for approximately 40% of
Ž.
total Cd burden almost exclusively via foods of
Ž
people in Japan even in recent years Watanabe
.
et al., 2000 .
Accordingly, a nation-wide survey was initiated
to clarify Cd levels in rice and other cereal-based
foods which citizens consume everyday and to
examine if there is any difference in the Cd
contents among areas within the country. Efforts
were made to collect samples that were actually
to be consumed by the residents of the areas.
Ž.
Lead Pb contents were also investigated in par-
allel. The results to be presented in this paper are
based on the survey of the largest scale ever
published from Japan in an open literature.
2. Materials and methods
2.1. Collection of samples
Samples were collected in 1998᎐2000. In prac-
Ž.
tice, 63 cities prefectural capitals or equivalents
in total from northern-most Hokkaido Island to
southern-most Okinawa Islands were selected as
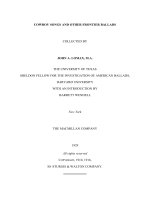
sampling sites. The locations are shown in Fig. 1.
The locations are grouped in terms of administra-
Ž
tive areas for details, see lines in Fig. 1 for
.
borders between areas , each area consists of
four᎐seven prefectures except for Hokkaido and
Okinawa in which there is only one prefecture.
The basic design was such that a volunteer in
Ž.Ž.
Fig. 1. Location of sampling sites in Japan. Each dot shows one sampling site. Lines show Area A Hokkaido , B Tohoku , C
Ž.Ž.Ž .Ž.Ž .Ž .Ž . Ž .
Kanto , D Tokai , E Hokuriku , F Kinki , G Chugoku , H Shikoku , I Kyushu and J Okinawa . Each area consists of
four᎐seven prefectures except for Hokkaido area and Okinawa area, each of which is made of one prefecture.
()
S. Shimbo et al. r The Science of the Total En
¨ironment 281 2001 165᎐175 167
Table 1
Number of samples collected, as classified by area
a
Area Number of Number of samples
sampling sites bbbcc
Raw rice Boiled rice Bread Noodle Flour Total
A 5 119 112 65 46 25 367
B 11 195 202 147 68 76 688
C 8 112 121 57 63 38 391
D 5 104 97 58 56 43 358
E 4 97 93 51 38 34 313
F 9 189 178 107 85 64 623
G 5 91 77 46 41 35 290
H 3 42 47 28 23 22 162
I 11 188 227 131 91 79 716
J 4 61 60 37 19 28 205
Total 65 1198 1214 727 530 444 4113
a
Administrative area; for locations, see Fig. 1.
b
Approximate equal numbers from kitchens and stores.
c
From stores.
charge was identified for a city to collect 10
Ž
samples each of raw and boiled rice both
polished, either from kitchens of residents or
.Ž
stores , bread loaf, either from kitchens of resi-
.Ž
dents or bakeries , noodle thick spaghetti in
.Ž
Japanese style, from stores and flour wheat flour,
.
from stores per site. In practice, however, this
principle was followed in cases of rice and noodle,
but not always so for bread and flour. Three
collectors were assigned for metropolitan Tokyo.
The numbers of samples collected are summa-
rized in Table 1, as classified by area; approxi-
mately equal numbers of raw and boiled rice and
bread samples were collected from kitchens and
stores.
2.2. Sample pretreatment, analytical instruments and
operation conditions
w Ž.x
A portion e.g. 2 g fresh weight of raw rice
was wet-ashed by heating in presence of mineral
Ž
acids as previously described Watanabe et al.,
.Ž.
1992 until clear residue approx. 0.3 ml was
obtained. The residue was then diluted to a
volume of 10 ml by addition of deionized water
and the diluted wet-ash was subjected to analysis
for Cd and Pb by inductively-coupled plasma mass
Ž.
spectrometry ICP-MS .
Ž
The ICP-MS apparatus connected with an
.
autosampler was a product of Seiko Instruments
Ž.
Tokyo, Japan . The system was operated under
the conditions summarized in Table 2. Selection
of isotopes for Cd and Pb determination and
Ž. Ž.
indium In and thallium Tl as internal stan-
dards, preparation of calibration curves and other
analytical conditions are shown in Table 3. The
recovery was approximately 95 and 97% for Cd
and Pb, respectively, and the accuracy when ex-
amined with bovine liver, typical diet and rice
Ž
flour as reference materials was 96᎐118% 104%
.Ž.
on an average for Cd and 96᎐107% 100% for
Pb. The detection limit was 0.1 ngrg for Cd and 1
Ž
ngrg for Pb when a signalrnoise ratio of 2 was
.
taken , which was considered sufficient for Cd
determination but marginally so in the case of Pb
determination which is to be discussed later.
In practice, the autosampler could accommo-
date 50 samples in a series. The determination of
Ž
Cd and Pb in one series including the input of
.
operation conditions to the system took 2.5᎐3h
so that it was possible to measure 100᎐150 sam-
ples per day.
2.3. Chemicals
Ž.
Stock solutions Cd and Pb for certified refer-
()
S. Shimbo et al. r The Science of the Total En
¨ironment 281 2001 165᎐175168
Table 2
ICP-MS operation conditions
Item Specification
System MS analyzer Seiko SPQ 9000 plasma
quadrupole MS analyzer
Autosampler Seiko AT400 autosampler
ICP RF power 1.5 KW
Nebulizer Conventional pneumatic
Plasma gas Argon
Gas flow rate Coolant gas 16 lrmin
Auxiliary gas 1 lrmin
Carrier gas 1 lrmin
Ion sampling Diameter of sampling cone orifice 0.8 mm
Diameter of skimmer cone orifice 0.4 mm
Ž.
Sampling distance torch-interface 10 mm
Mass spectrometry Scan mass range 110᎐210 mrs
Total run time 20 s
Integration 2 s
Cone block vacuum 1.28 Eq 002 Pa
Ion detector vacuum 5.69 Ey 004 Pa
Sample uptake time 60 s
Wash time 60 s
Ž.
ences 1000 ppm and mineral acids of trace
element analysis grades were purchased from
Ž.
Wako Pure Chemicals Osaka, Japan . Standard
Ž.
reference materials of bovine liver NBS 1577b ,
Ž. Ž
typical diet NBS 1548a and rice flour NBS
.
1588 were obtained from the National Institute
Ž
of Standards and Technology Gaithersburg,
.Ž
USA , and that of rice flour NIES 10a, 10b and
.
10c from National Institute for Environmental
Ž.
Sciences Tsukuba, Japan . Deionized water was
prepared by filtration of city water through a
Ž.
Milipore-Q system Milipore, Molshim, France .
2.4. Statistical analysis
Concentrations were expressed on a fresh
weight basis. A preliminary analysis on the dis-
tribution of the concentrations showed that
Ž.
arithmetic standard deviations ASD were often
greater than one-third of the corresponding means
Ž. Ž
AM , as observed previously Watanabe et al.,
.
1996; Zhang et al., 1996 . Thus, a log-normal
Ž
distribution was considered Watanabe et al.,
.
1989, 1996; Zhang et al., 1996 so that geometric
Ž. Ž .
means GM and standard deviations GSD were
taken as representative parameters of distribu-
tion. In calculating GM and GSD, the value below
the detection limit was assumed as if it were half
the detection limit. Student’s unpaired t-test and
Ž.
analysis of variance ANOVA followed by multi-
Ž.
ple comparison Scheffe were employed to detect
significant differences between or among means,
with use of STAT VIEW version 5.
3. Results
3.1. Cadmium contents in rice and cereal products
Ž.
Cd concentrations in rice raw and boiled ,
Ž.
bread loaf, noodle and flour wheat flour are
summarized in Table 4 in terms of GM and GSD;
the number of samples analyzed are given in
Table 1. The grand GM concentrations are 49.7
ngrg for raw rice, 22.4 ngrg for boiled rice, 15.5
ngrg for bread, 4.31 ngrg for noodle and 19.3
ngrg for flour. Because 100 g raw rice should give
Ž
212 g boiled rice when cooked Resources Coun-
.
cil, Science and Technology, 2000 , the ratio in
GM between raw and boiled rice, 49.7r22.4 or
2.2, appeared to be reasonable.
Analysis of Cd contents for possible inter-area
()
S. Shimbo et al. r The Science of the Total En
¨ironment 281 2001 165᎐175 169
Table 3
ICP-MS analysis conditions for cadmium and lead
Item Cadmium Lead
111 208
Selected isotope Cd Pb
Sensitivity High High
Chamber gas None None
115 205
Ž.
Internal standard 5 grlInTl
Ž.
Recovery rate % 94.7 96.6
Ž.
Detection limit ngrg sample 0.1 1
Ž.
Accuracy AM" ASD in grg, ns5
Ž.
Bovine liver NBS 1577b
Ž.
Certified value A 0.50" 0.03 0.129" 0.004
Ž.
Measured value B 0.48" 0.02 0.128" 0.003
Ž.
BrA % 96% 99%
Ž.
Typical diet NBS 1548a
Ž.
Certified value A 0.035" 0.0015 0.044"0.009
Ž.
Measured value B 0.035" 0.004 0.047" 0.004
Ž.
BrA % 100% 107%
Ž.
Rice flour NBS 1588
Ž.
Certified value A 0.029" 0.004 0.045" 0.010
Ž.
Measured value B 0.031" 0.001 0.043" 0.003
Ž.
BrA % 106% 96%
Ž.
Rice flour NIES 10a
Ž.
Certified value A 0.023"0.003 ᎐
Ž.
Measured value B 0.027" 0.001 ᎐
Ž.
BrA % 118% ᎐
Ž.
Rice flour NIES 10b
Ž.
Certified value A 0.32" 0.02 ᎐
Ž.
Measured value B 0.31" 0.01 ᎐
Ž.
BrA % 97% ᎐
Ž.
Rice flour NIES 10c
Ž.
Certified value A 1.82" 0.06 ᎐
Ž.
Measured value B 1.91" 0.11 ᎐
Ž.
BrA % 105% ᎐
variation by ANOVA showed that there was a
Ž. Ž
significant P- 0.01 variation in all cereals and
.Ž.
cereal products except for flour P) 0.10 . Anal-
ysis by multiple comparison disclosed that, in the
case of raw rice, there were a number of pairs of
areas between which the difference was signifi-
Ž.
cant P- 0.05 . Further perusal showed that the
Cd contents in raw rice collected in area E
Ž
located alongside the coast of the sea of Japan;
.
Fig. 1 , 70.1 ngrg as GM, tended to be higher
than the values for rice samples from other areas.
Similar statistical comparison of Cd contents in
boiled rice gave only one pair of areas in which
the Cd contents were significantly different, but
the value for area E was highest of all by simple
comparison, being on line with the observation
with Cd in raw rice. When statistical evaluation
was made separately for boiled rice samples
brought from kitchens and for those bought from
Ž
stores, inter-area difference was significant P-
.
0.01 in the former samples but not in the latter
Ž.
P) 0.10 . Further comparison in area E showed
()
S. Shimbo et al. r The Science of the Total En
¨ironment 281 2001 165᎐175170
Table 4
Cadmium in rice, bread, noodle and flour
ab
w Ž.x
Area Cadmium GM in ngrg GSD in
Raw rice Boiled rice Bread Noodle Flour
Ž. Ž. Ž. Ž. Ž.
A 46.1 1.90 23.2 1.78 16.2 1.10 3.40 2.14 18.7 1.63
d
Ž. Ž. Ž. Ž. Ž.
B 46.0 2.08 21.5 1.89 15.2 1.31 4.18 1.43 18.5 1.31
Ž. Ž. Ž. Ž. Ž.
C 53.8 1.99 23.1 1.77 16.2 1.17 4.06 1.46 20.9 1.48
d
Ž. Ž. Ž. Ž. Ž.
D 45.1 2.11 20.5 2.16 15.0 1.20 4.60 1.63 19.4 1.51
dd
Ž. Ž. Ž. Ž. Ž.
E 70.1 1.81 30.3 1.69 14.9 1.09 4.02 1.50 19.8 1.33
Ž. Ž. Ž. Ž. Ž.
F 55.3 1.95 25.3 1.89 14.7 1.34 4.42 1.40 18.7 1.43
d
Ž. Ž. Ž. Ž. Ž.
G 44.8 1.99 21.9 1.82 16.1 1.12 4.14 1.47 17.0 1.31
Ž. Ž. Ž. Ž. Ž.
H 56.3 1.76 21.4 2.65 16.6 1.10 5.02 1.42 18.0 1.35
dd
Ž. Ž. Ž. Ž. Ž.
I 44.2 2.06 19.3 2.39 15.8 1.16 4.29 1.59 21.2 2.18
d
Ž. Ž. Ž. Ž. Ž.
J 43.0 2.01 20.7 1.86 15.6 1.13 5.29 1.71 19.5 1.52
Ž. Ž. Ž. Ž. Ž.
Total 49.7 2.01 22.4 2.03 15.5 1.22 4.31 1.58 19.3 1.58
UU UU UU UU
c
ANOVA NS
a
Administrative area; for locations, see Fig. 1.
b
All measures were above the detection limit of 0.1 ngrg fresh weight of samples.
c
UU
and
U
for P - 0.01 and 0.05, respectively. NS for P) 0.10.
d
w Ž.x
GMs with the same superscript letters are significantly P- 0.05 by multiple comparison Scheffe different from each other
when compared between areas.
that the value tended to be greater for kitchen-
w Ž. Ž .
brought boiled rice 31.9 ngrg 1.76 as GM GSD
x
for 52 samples than for store-bought boiled rice
w Ž. x
28.3 ngrg 1.58 for 41 samples , although the
Ž.
difference was statistically insignificant P) 0.10 .
Ž.
In contrast, no significant difference P) 0.10
was detected when the multiple comparison test
was applied to wheat products, such as bread,
noodle or flour. Although ANOVA showed sig-
nificant difference in GMs as discussed above, the
ratio of the largest GM over the smallest was
1.13, 1.56 and 1.25 for bread, noodle and flour,
respectively., whereas the ratio was 1.63 for raw
rice.
3.2. Lead contents in rice and cereal products
Pb contents in rice and other cereal products
are summarized in Table 5. Grand GM values for
the products studied are in a range from 1.5 ngrg
for boiled rice to 3.2 ngrg for bread. ANOVA
Ž
disclosed significant differences P- 0.01 for all
.
cases except for noodle for which P - 0.05 among
the 10 areas. The multiple comparison, however,
identified only one or two pairs of areas for which
the inter-area difference was statistically signifi-
Ž.
cant P- 0.05 . It should be noted that the mea-
sures were below the detection limit in substan-
Ž.
tial numbers of cases Table 5 . For example, raw
rice samples with measures below the limit
counted as many as 946 among the total of 1198,
or 79%. The ratio was similarly high for boiled
Ž. Ž.
rice 78% and flour 67% , although lower for
Ž. Ž.
bread 29% and noodle 19% .
3.3. Inter-site difference in Cd in raw rice
Cereal samples, especially raw rice samples,
Ž
were collected in two or more sites or by two or
.
more collectors in several prefectures. Compar-
isons were made to examine if Cd contents in raw
Ž.
rice varied between or among the sites even in
case the sites are located rather close to each
other, i.e. in the same prefecture. In practice, two
sets of samples were available in seven prefec-
tures, three sets in three prefectures and five sets
Ž
in one prefecture Hokkaido Island which is the
.
largest prefecture in space . Difference was ex-
amined by Student’s t-test when only two sample
sets were available in one prefecture and by
ANOVA in case more than two sets were ex-
amined. The statistical evaluation showed no sig-
Ž.
nificant difference P) 0.10 in eight prefectures
Ž.
including Hokkaido Island out of the 11, sug-
gesting that within-prefecture difference was not
substantial in most cases.
()
S. Shimbo et al. r The Science of the Total En
¨ironment 281 2001 165᎐175 171
Table 5
Lead in rice, bread, noodle and flour
ab
w Ž. x
Area Lead GM in ngrg GSD : - DL
Raw rice Boiled rice Bread Noodle Flour
dd
Ž. Ž. Ž. Ž. Ž.
A 1.8 1.32 ;110 1.3 1.83 ; 98 4.9 2.26 ;7 2.8 2.28 ; 7 2.4 1.97 ; 19
d
Ž. Ž. Ž. Ž. Ž.
B 2.3 1.87 ;147 1.7 2.25 ;143 3.2 2.48 ; 44 3.2 2.58 ; 14 3.4 2.00 ;31
Ž. Ž. Ž. Ž. Ž.
C 2.4 2.02 ; 82 1.6 2.11 ; 86 3.8 2.63 ; 12 2.4 3.02 ; 23 3.6 2.54 ; 17
d
Ž. Ž. Ž. Ž. Ž.
D 1.9 1.64 ; 89 1.5 1.98 ; 75 2.1 2.03 ;28 2.9 2.20 ; 10 2.5 1.83 ; 28
Ž. Ž. Ž. Ž. Ž.
E 2.0 1.89 ; 82 1.6 2.12 ; 67 3.1 1.82 ; 9 3.9 2.25 ; 1 1.9 1.50 ; 29
Ž. Ž. Ž. Ž. Ž.
F 2.3 1.90 ;144 1.5 1.95 ;141 2.8 2.47 ; 39 3.0 2.02 ; 10 3.0 2.34 ; 38
Ž. Ž. Ž. Ž. Ž.
G 2.3 2.04 ; 69 1.2 1.60 ; 70 3.7 2.06 ; 7 3.2 2.02 ; 6 2.1 1.70 ; 28
d
Ž. Ž. Ž. Ž. Ž.
H 3.0 2.51 ; 27 1.3 1.65 ; 40 3.4 1.68 ; 3 3.7 2.09 ; 1 2.5 1.85 ; 14
Ž. Ž. Ž. Ž. Ž.
I 2.5 2.25 ;144 1.6 1.95 ;166 3.5 2.94 ; 43 2.8 2.23 ; 18 2.7 2.11 ; 49
d
Ž. Ž. Ž. Ž. Ž.
J 2.0 1.88 ; 52 1.2 1.45 ; 56 1.8 2.15 ;22 1.7 2.38 ; 10 1.8 1.49 ;26
Ž. Ž. Ž. Ž. Ž.
Total 2.2 1.93 ;946 1.5 1.96 ;941 3.2 2.47 ;214 2.9 2.34 ;100 2.7 2.06 ;279
ANOVA
c
UU UU UU U UU
a
Administrative area; for locations, see Fig. 1.
b
Ž.
The number of measures below the detection limit -DL of 1 ngrg fresh weight of samples.
c
UU
and
U
for P - 0.01 and 0.05, respectively.
d
w Ž.x
GMs with the same superscript letters are significantly P- 0.05 by multiple comparison Scheffe different from each other
when compared between areas.
In a further step, Cd contents in raw rice were
classified by prefecture and GM values for indi-
vidual prefectures were compared among each
area. Because area A and J consist of one prefec-
ture each, the comparison was made for eight
areas of B᎐I. The results showed that the within-
Ž
area difference was significant P - 0.01 by
.
ANOVA in six areas out of the eight, whereas it
( .
was insignificant P ) 0.10 for two areas of C and
H; area C embraces several large cities including
Tokyo and area H has only limited rice produc-
tion because the land is mountainous, so that rice
is imported from other areas in Japan to these
two areas. Combining this observation with the
findings on the within-prefecture difference, it is
apparent that detection of geographical differ-
ence in Cd contents in raw rice relates to the
Ž
dimensions of the regions e.g. city, prefecture or
.
area considered for comparison.
4. Discussion
The present study showed that the grand GM
for Cd in rice consumed in Japan was approxi-
mately 50-ngrg raw rice with significant variation
Ž
depending on the areas rice from area E probably
.
being higher than others whereas Cd contents
were lower in three wheat-based food materials
Ž. Ž.
of bread loaf 16 ngrg , noodle 4 ngrg and flour
Ž.Ž.
19.3 ngrg Table 4 with less remarkable inter-
Ž
area variation as shown by the absence of pairs
.
of areas with significant difference . The observed
GM of 50 ngrg for raw rice is in general agree-
ment with the results of a nation-wide mass sur-
Ž.
vey with ) 35 000 samples of 0.06 grg
Ž
Ministry of Agriculture, Forestry and Fishery,
.
2000 when the difference between the geometric
Ž.
the present study and arithmetic means is taken
into account.
Ž.
Pb levels in cereals including rice and wheat
Ž.
were much lower 2᎐3ngrg and levels in many
Ž.
samples were below the detection limit Table 5 .
Thus, the observed GM values for Pb should be
taken as semi-quantitative and not strictly quanti-
tative. This limitation may explain why the ratio
Ž.
in GM of raw rice over boiled rice 2.2r1.5s1.5
does not agree with the expected value of 2.1
Ž.
Resources Council, 2000 .
When compared with the levels in late 1980s
()
S. Shimbo et al. r The Science of the Total En
¨ironment 281 2001 165᎐175172
Ž.
53 ng Cdrg rice, Watanabe et al., 1989 and
Ž.
mid-1990s 53 ng Cdrg rice , the present observa-
tion of 50 ng Cdrg rice suggests that there have
been essentially no changes or only slight reduc-
tion in Cd contents in rice in Japan during the
Ž
past 10 years. In contrast, Pb contents in rice 2᎐ 3
.
ngrg appear to show a gradual decrease from
the levels of approximately 5 ngrg both in late
Ž.
1980s Watanabe et al., 1989 and in mid-1990s
Ž.
Zhang et al., 1996 .
Cd and Pb contents in rice available in various
parts of the world were previously reviewed, and
it was summarized that Cd contents in rice avail-
able in Japan is substantially higher than the
levels in rice from surrounding Asian countries
Ž. Ž
e.g. 15᎐30 ngrg or outside Asia e.g. 20᎐30
ngrg for rice available in Europe; Watanabe et
.
al., 1989, 1996 , whereas the reverse is actually
the case for Pb contents in rice from Japan when
compared with rice from other parts of Asia
Ž.
Watanabe et al., 1989, 1996; Zhang et al., 1996 .
With regard to Cd in flour, both high values of 43
Ž.Ž
ngrg Wolnik et al., 1983 or 8᎐77 ngrg Muller
.
et al., 1996 for flour in Europe and low values of
Ž.
12᎐17 ngrg Watanabe et al., 1998 or 15 ngrg
Ž.
Zhang et al., 1998 for flour in China were re-
ported. The present observation of 19 ng Cdrg
flour is not only closer to the latter levels, but
further in agreement with the values for whole
Ž
wheat grain of 40᎐50 ngrg Cd Bruggemann and
Kumpulainen, 1995; Chaudri et al., 1995; Mench
.
et al., 1997; Conti et al., 2000 or 20᎐100 ngrg
Ž.
Lorenz et al., 1986 , because Cd in wheat grain is
higher in bran and lower in albumen so that Cd
Ž
in flour after milling is much lower e.g. approx.
.Ž
40% than that in the whole grain Zhang et al.,
.
1997 .
The inter-area difference in Cd contents in rice
samples was substantial among raw samples, less
so among kitchen-bought boiled rice and insig-
nificant among store-bought boiled samples. This
observation may deserve discussion because the
findings are probably related to the marketing
system of rice in Japan. In everyday life, each
Ž
family typically non-farming urban family in the
.
case of the present study will purchase rice from
Ž.
local stores to cook mostly by boiling in the
kitchens; in the stores, both locally harvested rice
as well as nation-widely marketed rice are avail-
able. In contrast, store-bought boiled rice is sup-
plied by food processing industries, which will
predominantly utilize widely marketed rice rather
than local rice because they cook rice by a great
batch. Thus, kitchen-bought boiled rice samples
will probably reflect local conditions better than
the store-bought counterparts.
A similar consideration can be applied to ex-
plain rather homogeneous Cd and Pb contents in
Ž.
wheat-based food materials Tables 4 and 5 .
Whereas, the rate of self-sufficiency is nearly
Ž
100% in the case of rice production and there-
.
fore, supply , the rate for wheat is as low as 8% as
Ž
the 3-year average for 1995᎐1997 Ministry of
.
Agriculture, Forestry and Fishery, 1999 . The lat-
ter low rate indicates that the materials for
wheat-based products such as bread and noodle
Ž.
including flour are imported from abroad as-
sumedly in large batches, and therefore, the metal
level in the products will not be related to local
conditions where they are consumed.
When the present observation on raw rice is
compared with the values reported in literature
Ž.
Table 6 following the flow of time, it appears
likely that there has been no substantial changes
in Cd contents in rice in the past 12 years, whereas
Pb contents may have been decreasing gradually.
The methods of analysis employed were, however,
not the same, i.e. flameless atomic absorption was
Table 6
Cadmium and lead contents in raw polished rice, reported in
literature
a
Ž.
Reference Element concentration ngrg
Cadmium Lead
Saito et al., 1988 60 14
Watanabe et al., 1989 53 5
Rivai et al., 1990 21᎐99
Watanabe et al., 1992 41
Watanabe et al., 1993 46
Watanabe et al., 1996 56
Zhang et al., 1996 5
Present study 50 2
a
Geometric means.
()
S. Shimbo et al. r The Science of the Total En
¨ironment 281 2001 165᎐175 173
Ž
used in early day studies Saito et al., 1988;
Watanabe et al., 1989, 1992, 1993; Rivai et al.,
.
1990 , whereas it was ICP-MS in recent studies
Ž.
Watanabe et al., 1996; Zhang et al., 1996 as in
the present study.
Possible health implication of dietary Cd intake
among general Japanese populations has been
Ž.
discussed in a separate paper Ikeda et al., 2000a .
In this connection, it may be worthy to note that
dietary Cd intake is almost the exclusive source of
Ž.
Cd intake Ikeda et al., 2000b and that rice
accounts for approximately 40% of total dietary
Ž.
Cd intake Watanabe et al., 2000 . In a very sharp
contrast, dietary Pb intake of Japanese popula-
Ž
tions is among the lowest of the world Zhang et
.
al., 2000 rice accounting for less than 20% of the
total dietary intake, although Pb intake via respi-
ration of general air is comparable to that via
Ž.
food Ikeda et al., 2000b .
Taking advantage of the published data on
daily consumption of various food items including
Ž
rice and wheat products Ministry of Health and
.
Welfare, 2000 , it is possible to estimate the daily
intake of Cd and Pb via two staple cereals of rice
and wheat. The estimation was made by multipli-
cation of daily consumption with Cd and Pb con-
tents in the cereals. Both data on the rice and
Ž
wheat consumption Ministry of Health and Wel-
.
fare, 2000 and that on Cd and Pb contents in rice
Ž.
and wheat Table 4 are available not only for the
whole country of Japan but for individual admin-
Ž
istrative areas for geographical locations, see Fig.
.
1 , the estimation was made for the whole country
Ž.
shown in the average column in Table 7 as well
Ž
as for individual areas the minimum and the
maximum values among the 10 areas are shown
.
as a range in Table 7 .
On the whole country basis, Japanese people
Ž.
take 1.8 times more rice 165 grday than wheat
Ž
91 grday as raw material, taken as bread, noodle
.
etc. on a weight basis, and this difference is
further expanded to 4.7 times when Cd intake is
Ž
compared 8.2 grday from rice vs. 1.8 grday
.
from wheat because Cd contents are much higher
Ž. Ž.
in rice 50 ngrg than in wheat 19 ngrg . When
the daily Cd intake by Japanese women is con-
sidered to be approximately 25.5 grday
Ž.
Watanabe et al., 2000 ; the value for men should
be somewhat higher than this level because men
.
take more food than women , daily intake of 8.2
and 1.8 gCdrday via rice and wheat, respec-
tively, accounts for 32 and 7% of the total dietary
Cd intake. Pb contents are more or less similar in
rice and in wheat, and contribution of the two
cereals as sources of dietary Pb intake is essen-
Ž.
tially in proportion of the cereal intake Table 7 .
It is further possible to make calculation for
each administrative area. The calculation on the
Ž.
area basis Table 8 shows that the Cd intake via
rice is the highest in area E in agreement with the
Ž
previous observation in a field survey Watanabe
.
et al., 2000 ; this high value is due to the facts
that both rice intake and Cd content in rice are
high in this area. Cd intake via wheat is smaller
Table 7
Intake of cadmium and lead via rice and wheat
Item Rice Wheat
Ž. Ž.
Average Range Average Range
Ž.
Element content ngrg
a
Ž. Ž . Ž .
Daily cereal consumption grday 165 158᎐178 91 67᎐104
Cadmium
Ž. Ž . Ž .
Cd content ngrg 49.7 43.0᎐70.1 19.3 17.0᎐21.2
Ž. Ž . Ž .
Daily Cd intake ngrday 8191 7409᎐12506 1754 1297᎐ 1993
Lead
Ž. Ž . Ž .
Pb content ngrg 2.2 1.8᎐3.0 2.7 1.8᎐3.6
Ž. Ž. Ž.
Daily Pb intake ngrday 363 304᎐478 245 120᎐201
a
Ž.
Cited from Ministry of Health and Welfare 2000 .
()
S. Shimbo et al. r The Science of the Total En
¨ironment 281 2001 165᎐175174
Table 8
Cadmium intake via rice and wheat in various areas
a
Area Rice Wheat
b b
Cadmium Cadmium
Intake Intake
b b
Ž. Ž.
grday grday
Content Intake Content Intake
Ž. Ž . Ž. Ž .
ngrgngrday ngrgngrday
A 168.7 46.1 7777 83.8 18.7 1567
B 175.0 46.0 8050 74.0 18.5 1369
c c
C 158.2 53.8 8511 95.4 20.9 1993
D 167.0 45.1 7532 90.4 19.4 1754
E 178.4 70.1 12 506 76.6 19.8 1517
d d
F 172.6 55.3 9542 104.4 18.7 1877
G 167.4 44.8 7500 95.7 17.0 1627
H 159.2 56.3 8963 94.6 18.0 1703
I 169.7 44.2 7501 84.4 21.2 1789
e e
J 172.3 43.0 7409 66.5 19.5 1297
Total 164.8 49.7 8191 90.9 19.3 1754
a
For locations, see Fig. 1.
b
Ž.
Intakes of rice and wheat are cited from Ministry of Health and Welfare 2000 , and Cd contents in rice and wheat are cited
from the raw rice and flour columns in Table 4.
c
Ž.
The average value for Kanto I and Kanto II areas Ministry of Health and Welfare, 2000 .
d
Ž.
The average value for Kinki I and Kinki II areas Ministry of Health and Welfare, 2000 .
e
Ž.
The value for southern Kyoshu Ministry of Health and Welfare, 2000 .
Ž.
than that via rice Table 7 , but relatively higher
Ž
in the two most urbanized areas of C in which
.
Tokyo, Yokohama and Kawasaki are and F
Ž.
where Osaka, Kobe and Kyoto are , presumably
Ž
with more consumption of bread and noodle Ta-
.
ble 8 . No area-specific data of comparison on Pb
via rice and that via wheat are presented, because
cereal-based Pb intake is limited with small
Ž.
inter-area variations Table 7 .
The present analysis made it clear that varia-
tion in Cd contents in raw rice is significant
among prefectures even when they belong to the
same administrative area. Thus, it is apparently
desirable to make estimation of cereal-based Cd
intake for each prefecture. The data on cereal
consumption on the prefecture basis are, how-
ever, not available unfortunately.
Acknowledgements
A part of this work was supported by research
grants-in-aid from the Environment Agency, the
Government of Japan to S.S. for 1998 to 2000.
References
Bruggemann J, Kumpulainen J. The status of trace elements
in former Federal republic of Germany. Z Lebensm Unters
Forsch 1995;201:1᎐6.
Chaudri AM, Zhao FJ, McGrath SP, Crosland AR. The
cadmium content of British wheat grain. J Environ Qual
1995;24:850᎐855.
Conti ME, Cubadda F, Carcea M. Trace elements in soft and
durum wheat in Italy. Food Addit Contam 2000;17:45᎐53.
Environment Agency, the Government of Japan. Control of
cadmium-induced environmental pollution. Tokyo: Envi-
ronment Agency, 1972:166᎐168, in Japanese.
Ikeda M, Zhang Z-W, Moon C-S, Shimbo S, Watanabe T,
Nakatsuka H, Matsuda-Inoguchi N, Higashikawa K. Possi-
ble effects of environmental cadmium exposure on kidney
function in the Japanese general population. Int Arch
Occup Environ Health 2000a;73:15᎐25.
Ikeda M, Zhang Z-W, Shimbo S, Watanabe T, Nakatsuka H,
Moon C-S, Matsuda-Inoguchi N, Higashikawa K. Exposure
of women in general populations to lead via food and air in
east and southeast Asia. Am J Ind Med 2000b;38:271᎐280.
Lorenz H, Ocker HD, Bruggemann J, Weigert P, Sonneborn
M. Cadmiumgehalte in Getreideproben der Vergangenheit
ᎏ Vergleich zur Gegenwart. Lebensm Unters Forsch
1986;183:402᎐405, in German with English abstract.
Mench M, Braize D, Mocquuot B. Cadmium availability to
wheat in five soil series from the Yonne district, Burgundy,
France. Environ Pollut 1997;95:93᎐103.
()
S. Shimbo et al. r The Science of the Total En
¨ironment 281 2001 165᎐175 175
Ministry of Agriculture, Forestry and Fishery, the Govern-
ment of Japan. 1997 Food balance tables. Tokyo: Agricul-
ture and Forestry Statistics Association, 1999;92᎐95, in
Japanese.
Ministry of Agriculture, Forestry and Fishery, the Govern-
ment of Japan. A press release on pesticides and other
contaminants in rice, 1999. 2000, in Japanese.
Ministry of Health and Welfare, the Government of Japan.
Nutritional Status in Japan 1998. Tokyo: Dai-ichi Shuppan
Press, 2000:73᎐75, in Japanese.
Muller M, Anke M, Hartmann E, Illing-Gunther H. Oral
cadmium exposure of adults in Germany. 1. Cadmium
content of food staffs and beverages. Food Addit Contam
1996;13:359᎐378.
Resources Council, Science and Technology Agency, the Gov-
ernment of Japan. Standard tables of food composition in
Japan, 5th revised version. Tokyo: Ministry of Finance
Printing Bureau, 2000. p. 40, in Japanese with English
translation.
Rivai F, Koyama H, Suzuki S. Cadmium content in rice and its
daily intake in various countries. Bull Environ Contam
Toxicol 1990;44:910᎐916.
Saito I, Ohshima H, Kawamura N, Yamada M. Screening
method for determination of high levels of cadmium, lead
and copper in foods by polarized Zeeman atomic absorp-
tion spectrometry using discrete nebulization. J Assoc Off
Analyt Chem 1988;71:829᎐832.
Watanabe T, Nakatsuka H, Ikeda M. Cadmium and lead
contents in rice available in various areas of Asia. Sci Total
Environ 1989;80:175᎐ 184.
Watanabe T, Nakatsuka H, Satoh H, Yamamoto R, Ikeda M.
Reduced dietary cadmium intake in past 12 years in a rural
area in Japan. Sci Total Environ 1992;119:43᎐50.
Watanabe T, Iwami O, Shimbo S, Ikeda M. Reduction in lead
and cadmium intake among general populations in Japan.
Int Arch Occup Environ Health 1993;65:S205᎐S208.
Watanabe T, Shimbo S, Moon C-S, Zhang Z-W, Ikeda M.
Cadmium contents in rice samples from various areas in
the world. Sci Total Environ 1996;184:191᎐196.
Watanabe T, Zhang Z-W, Qu J-B, Xu G-F, Song L-H, Wang
JJ, Shimbo S, Nakatsuka H, Higashikawa K, Ikeda M.
Urban-rural comparison on cadmium exposure among gen-
eral populations in Shandong Province, China. Sci Total
Environ 1998;217:1᎐ 8.
Watanabe T, Zhang Z-W, Moon C-S, Shimbo S, Nakatsuka H,
Matsuda-Inoguchi N, Higashikawa K, Ikeda M. Cadmium
exposure of women in general populations in Japan during
1991᎐1997 compared with 1977᎐1991. Int Arch Occup
Environ Health 2000;73:26᎐34.
Wolnik KA, Fricke FL, Capar SG, Braude GL, Meyer MW,
Satzger RD, Bonnin E. Elements in major raw agricultural
crops in the United States. 1. Cadmium and lead in lettuce,
peanuts, potatoes, soy beans, sweet corn and wheat. J Agri
Food Chem 1983;31:1240᎐1244.
Zhang Z-W, Moon C-S, Watanabe T, Shimbo S, Ikeda M.
Lead content of rice collected from various areas in the
world. Sci Total Environ 1996;191:169᎐175.
Zhang Z-W, Qu J-B, Xu G-F, Song L-H, Wang J-J, Shimbo S,
Watanabe T, Nakatsuka H, Higashikawa K, Ikeda M. Maize
and foxtail millet as substantial sources of dietary lead
intake. Sci Total Environ 1997;208:81᎐88.
Zhang Z-W, Watanabe T, Shimbo S, Higashikawa K, Ikeda M.
Lead and cadmium contents in cereals and pulses in
north-eastern China. Sci Total Environ 1998;220:137᎐145.
Zhang Z-W, Moon C-S, Shimbo S, Watanabe T, Nakatsuka H,
Matsuda-Inoguchi N, Higashikawa K, Ikeda M. Further
reduction in lead exposure in women in general popula-
tions in Japan in the 1990s, and comparison with levels in
east and south-east Asia. Int Arch Occup Environ Health
2000;73:91᎐97.