Effects of nutrient supply and soil cd con
Bạn đang xem bản rút gọn của tài liệu. Xem và tải ngay bản đầy đủ của tài liệu tại đây (155.99 KB, 12 trang )
Biomass and Bioenergy 23 (2002) 415 – 426
Eects of nutrient supply and soil cadmium concentration on
cadmium removal by willow
Erika Klang-Westin
a; ∗
, Kurth Perttu
b
a
Department of Soil Sciences, Swedish University of Agricultural Sciences, P.O. Box 7014, SE-750 07 Uppsala, Sweden
b
Department of Short Rotation Forestry, Swedish University of Agricultural Sciences, P.O. Box 7016, SE-750 07 Uppsala, Sweden
Received 1 November 2001; received in revised form 10 May 2002; accepted 23 May 2002
Abstract
This investigation studied the eect of an increased biomass production as a result of fertilization and an elevated Cd
concentration in the topsoil on concentration and amount of Cd in two clones of Salix (81090 and 78183). The experiment
was conducted over a three year period using 200-dm
3
lysimeters ÿlled with clay soil. A liquid fertilizer containing all
essential macro- and micronutrients in balanced proportions by weight was applied at two rates according to growth. The
lower rate corresponded to 0, 20 and 20 kg N ha
−1
during years 1, 2 and 3, respectively, while the higher rate was 30, 60
and 60 kg N ha
−1
for the same period. The Cd levels in the topsoil were an initial content of 0:3 mg Cd (kg dw soil)
−1
and
0:6 mg Cd (kg dw soil)
−1
after addition of CdSO
4
.
Biomass production increased signiÿcantly due to fertilization. In general, this increase in biomass resulted in a higher
Cd amount in the stem. However, the magnitude was small and only statistically signiÿcant in some cases, mainly because
increased biomass also resulted in a lowered Cd concentration due to an eect of biological dilution. Addition of Cd to the
topsoil resulted in higher Cd concentrations and total Cd amounts (concentration× biomass) in the Salix plants. In most cases
the increase in total stem Cd amount was 40 –80% of the increase in soil Cd concentration, although a directly proportional
increase was observed occasionally. Clone 81090 had higher concentrations and total amounts of Cd in the stems than clone
78183, while clone 78183 produced more stem biomass. The leaves had the highest Cd concentrations, but the total amounts
of Cd were largest in the stems.
? 2002 Elsevier Science Ltd. All rights reserved.
Keywords: Biomass production; Fertilization; Salix; Clone; Cd
1. Introduction
During the 20th Century, arable land in Sweden
has been subjected to anthropogenic input of Cd,
mainly via phosphorus fertilizers and deposition [1].
Calculations by Andersson [2] indicate a 33% increase
∗
Corresponding author. Tel.: +46-(0)18-672888; fax: +46-
(0)18-672795.
E-mail address:
(E. Klang-Westin).
in average Cd concentrations in the topsoil be-
tween 1900 and 1990, based on the levels around
1900. Furthermore, Eriksson [3] found that 5
–10% of an annual harvest of Swedish win-
ter wheat had Cd concentrations near or above
the limit value for cereals (0:1mgkg
−1
) pro-
posed by the CODEX committee [4]. Elevated Cd
concentrations were also found in spring wheat,
potatoes and carrots [5].
In the past decade plantations of willow, consist-
ing mainly of Salix viminalis L. and S. dasyclados
0961-9534/02/$ - see front matter ? 2002 Elsevier Science Ltd. All rights reserved.
PII: S 0961-9534(02)00068-5
416 E. Klang-Westin, K. Perttu / Biomass and Bioenergy 23 (2002) 415 – 426
Wimm., have been established on arable land in
Sweden. The stem biomass produced has mainly
been used as a biofuel in municipal district heating
plants. Today around 16,000 ha are cropped with
Salix, which corresponds to approximately 0.5% of
the total agricultural land in Sweden. Several studies
have shown that Salix accumulates high levels of Cd
[6–10]. Therefore, the role of Salix as a potential
phytoextractor to remove Cd from moderately con-
taminated soils at stem harvest has been discussed.
In relation to other species known to accumulate Cd,
Salix can be deÿned as a high accumulator rather than
a hyperaccumulator of Cd. According to the deÿnition
by Baker et al. [11] hyperaccumulators accumulate
¿ 0:01% Cd in leaf dry mass and may have the metal
evenly distributed throughout the plant. Examples of
hyperaccumulators of Cd are Thlaspi caerulescens
and Alyssum murale within the Brassicaceae family.
In contrast to these more ecient species, Salix has a
high biomass production, making it possible to have
a proÿtable production of biofuel (see above) at the
same time as the soil is being restored. A dierence in
Cd accumulation (uptake and translocation) between
genotypes of Salix has also been demonstrated [7,12].
The choice of clone will therefore also be of impor-
tance for the phytoextraction eect of a Salix stand.
The mechanisms that regulate the Cd uptake in
plants are still not known. Plant uptake of Cd at low so-
lution concentrations has been reported in reviews by
Grant et al. [13] and Greger [14] to be either passive,
metabolic or partially metabolic and partially passive
and may be in competition with the uptake system for
essential trace elements. An incorporation of Cd into
the stems of Salix in direct proportion to the biomass
production would imply that Cd uptake is dependent
on the uxes of water and mineral nutrients through
the plant. Even if the uptake of Cd is not directly
proportional to biomass production, the Cd incorpo-
rated into the stems will still increase with increased
stem yield as long as the increase in biomass is larger
than the decrease in Cd concentration. Factors such
as temperature, light and ow of water through the
plant inuence growth and may therefore also aect
the Cd uptake. However, Perttu et al. [15] concluded
that the factors mentioned do not aect the Cd uptake
in Salix. The lack of knowledge regarding the fac-
tors that determine the Cd concentration and mecha-
nisms behind Cd uptake in Salix makes it dicult to
predict the eect of dierent management practices,
e.g. fertilisation, on the removal of Cd at stem harvest.
This study was undertaken to investigate the ef-
fect of dierent nutrient supplies and soil Cd con-
centrations on Cd concentrations in stems, leaves and
roots in two dierent clones of Salix. The hypothesis
was that an increased biomass production induced by
fertilisation would increase the Cd content in the stems
and hence the removal of Cd at stem harvest.
2. Materials and methods
The experimental area is situated in Uppsala in
the east-central Sweden (lat. 59
◦
49
N, long. 17
◦
40
E,
15 m a.s.). The experiment was carried out in closed
lysimeters made from plastic containers (volume ap-
prox. 200 dm
3
and depth 0:9 m) [16]. Soil columns
consisting of approximately 0:25 m topsoil and 0:50 m
subsoil were built up in the lysimeters (Table 1) us-
ing an arable clay soil (Eutric Cambisol) collected in
the vicinity of Uppsala. A drainage pipe covered with
sand (approx. 0:15 m) was put in the bottom of each
lysimeter. At the beginning of May 1997, one unrooted
cutting (weight 13 ± 0:5 g) of willow (Salix viminalis
L. or Salix dasyclados Wimm.) was planted in each
lysimeter. The lysimeters were covered with a lid, with
a hole for the shoots. The experiment was conducted
over three growing seasons, from 1997 to 1999.
Treatments consisted of two clones (81090 of Salix
dasyclados and 78183 of Salix viminalis), two nutri-
ent levels (based on the N-supply), two soil Cd con-
centrations and two harvest occasions (2 and 3 years
old). Nutrient level 1 (N1) corresponded to appli-
cation of 0, 20 and 20 kg N ha
−1
during years 1, 2
and 3, respectively. Corresponding amounts of N for
nutrient level 2 (N2) were 30, 60 and 60 kg N ha
−1
.
Table 1
pH, total Cd concentration (7M HNO
3
), exchangeable Cd
(NH
4
NO
3
) and carbon content in topsoil and subsoil used in the
lysimeters
Soil type pH Total Cd Exchangeable Cd C
(gkg
−1
)(gkg
−1
) (%)
Topsoil 6.7 296 4.9 1.1
Subsoil 6.9 231 3.5 1.0
E. Klang-Westin, K. Perttu / Biomass and Bioenergy 23 (2002) 415 – 426 417
0
10
20
30
40
50
60
Accumulated fertilisation (kg N ha-1)
M J J A S O M J J A S O
0
70
140
210
280
350
420
Accumulated irrigation (mm)
Season 1997
Season 1998
Season 1999
Season 1997
Season 1998
Season 1999
Nutrien level 1 Nutrient level 2
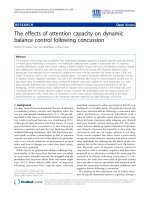
Fig. 1. Accumulated irrigation and fertilization for nutrient levels N1 and N2 during the growing seasons 1997 (solid line), 1998 (dotted
line), 1999 (dashed line).
The other macronutrients were supplied in relation
to N (see below). The two soil Cd concentrations in
the topsoil were 0:3 mg Cd (kg DW)
−1
, which was
the concentration of the parent material and 0:6mg
Cd (kg DW)
−1
. The increased Cd concentration was
achieved by adding 0:3 mg Cd (kg DW)
−1
in the
form of CdSO
4
to the topsoil. The subsoil had the
same Cd concentration in both treatments (0:23 mg
Cd kg dw
−1
). Each treatment had two replicates. The
lysimeters were installed in the ground in groups of 8
(32 lysimeters in total). Plants of Salix were grown
around the lysimeters to simulate a stand structure
and to eliminate edge eects. The spacing between
plants inside and outside the lysimeters was such
that the area for each plant was 0:5m
2
. For practical
reasons, the four combinations of clones and nutrient
levels were distributed so that clone and nutrient level
were the same for all experimental units within each
group. Soil Cd treatments were randomized within
each group of lysimeters.
Irrigation was performed daily from late May until
the beginning of October each year with a comput-
erized drip irrigation system (Fig. 1). The plants
received the same amount of water irrespective of
nutrient level, in order to reduce the number of exper-
imental factors and also to simulate ÿeld conditions.
A liquid fertilizer (Blomstra, Cederroth International)
containing all essential macro- and micronutrients in
the following proportions (by weight); 100 N, 20 P,
84 K, 6 Ca, 8 Mg, 8 S, 0.3 Fe, 0.4 Mn, 0.2 B, 0.06
Zn, 0.03 Cu and 0.0008 Mo was applied with the
drip irrigation system according to a sigmoid growth
curve (cf. [17]) (Fig. 1). Climate data were obtained
from the Ultuna meteorological station close to the
ÿeld. The soil water potential in the lysimeters was
controlled by TDR measurements during the season.
Excess water collected in the drainage pipe at the
bottom of each lysimeter was occasionally pumped
out. Samples of this water were taken for Cd analy-
ses and they showed that almost no Cd had leached
418 E. Klang-Westin, K. Perttu / Biomass and Bioenergy 23 (2002) 415 – 426
out. In order to prevent the roots penetrating into
the sand at the bottom, a nylon straining-cloth
(80 m, Bewatex AB) enclosed the topsoil and
subsoil.
In November 1998, when the plants were 2 years old
(2-Au98), the ÿrst harvest was carried out in half of
the lysimeters. In the lysimeters without added Cd, the
roots were destructively sampled. During the winter
1998–1999, the remaining plants were unfortunately
severely damaged by ÿeld-mice and these also had
to be harvested in early spring 1999 (2-Sp99). The
plants coppiced in spring were allowed to resprout and
were harvested again in autumn 1999 (1-Au99). The
roots were destructively sampled after harvest in all
lysimeters harvested in autumn 1999. The shoots were
cut at about 5 cm from where they were attached to
the cutting (stem base).
During the second and third growing seasons, shed
leaves were collected (from middle of July until all
leaves had fallen) from the plants later being harvested
in the same year. A net was mounted surrounding each
plant and held open above the canopy by a sti circu-
lar wire. To record plant nutrient status, mature leaves
that had not yet abscised were also collected from ev-
ery plant at the beginning of September in the second
and third growing season. In order to cover the con-
centration gradient along the shoot, these leaves were
taken randomly within three sections of the above-
ground stool (unit of roots and shoots originating from
the same cutting). The levels separating each section
were set by dividing the tallest shoot into three. Each
section was analyzed separately.
The collected shed leaves and the non-abscised
leaves sampled for nutrient analysis were dried
(70
◦
C), weighed and ground on a Thomas–Wiley
laboratory mill (mesh size 2 mm) and on a Retsch
knife mill (mesh size 0:2 mm), respectively. Subsam-
ples from the leaf material were wet ashed (heating
block 150
◦
C) in a mixture of 10 ml conc. HNO
3
and
1 ml conc. HClO
4
. The acids were evaporated un-
til 0.5 ml of perchloric residue remained, then this
was diluted with H
2
O to a ÿnal volume of 35 ml.
The extracts were analyzed for Cd on a JY-70 Plus
ICP Emission Spectrometer. In addition, the extracts
from the non-abscised leaves were analyzed for the
macro elements P, K, Ca and Mg on ICP (see above)
and subsamples from the same leaf material were
also analyzed for N (Carlo Erba NA 1500 elemental
analyzer). Stems, roots and cuttings were oven dried
at 70
◦
C to constant weight, weighed and ground on
a Thomas-Wiley laboratory mill (mesh size 2 mm)
and analyzed for Cd as described above. The roots
were clipped before grinding. Soil samples were air
dried (30 –40
◦
C), ground to pass through a 2 mm
sieve and analyzed for total Cd, exchangeable Cd,
organic carbon (C) and pH. Total Cd (Cd–HNO
3
)
was analyzed after extraction with 7 M nitric acid
(110
◦
C, 2h) [18]. Exchangeable Cd was estimated
by extracting the soils with 1:0MNH
4
NO
3
(Cd–
NH
4
NO
3
). Total carbon content was analyzed on
an elemental analyzer (LECO CHN-932) and pH
was measured in H
2
O (soil:water ratio 1:5). Water
samples were ÿltered (0:2 m) and 1% by volume
of conc. HNO
3
was added for conservation. Anal-
yses of Cd on the water samples and soil extracts
were performed by means of atomic absorption spec-
trophotometry using the graphite furnace technique
(Zeeman 4110 ZL).
Because of the unplanned harvest in spring of
the third growing season, each harvest was treated
separately in a 3-factorial design. Statistical analy-
ses (ANOVA) were performed with the programme
Systat 10.0 (SPSS Inc).
3. Results
3.1. Weather conditions
The summer of 1997 was warmer than normal
for Swedish conditions (Fig. 2). In spite of this, the
potential evaporation (Penman) did not exceed pre-
cipitation by very much and the accumulated precip-
itation during May–September was quite high (Fig.
2). The growing season in 1998 was cooler than nor-
mal and accumulated precipitation was again quite
high (Fig. 2). During the growing season of 1999, the
temperature was once again higher than normal for
the area concerned. However, the accumulated pre-
cipitation was very low and well below accumulated
potential evaporation.
3.2. Plant nutrient status
In the second growing season (1998), the leaf N
concentration was around 22 mg N (g DW)
−1
and N
E. Klang-Westin, K. Perttu / Biomass and Bioenergy 23 (2002) 415 – 426 419
M J J A S O M J J A S O
0
10
20
30
40
0
10
20
30
40
Daily precipitation and pot. evapo.transp. (mm)
0
10
20
30
40
0
10
20
30
40
0
10
20
30
40
Daily mean temperature (°C)
0
10
20
30
40
Acc. precip. 330
Mean air temp. 14.5
Mean air temp. 12.5
Mean air temp. 14.5
Acc. pot. evapo. 416
Acc. precip. 329
Acc. pot. evapo. 338
Acc. precip. 163
Acc. pot. evapo. 447
1997
1998
1999
1997
1998
1999
Fig. 2. Daily precipitation (solid line), potential evaporation (dotted line) and mean air temperature for the growing seasons 1997–1999.
In each graph, values for accumulated precipitation (Acc. precip.), accumulated potential evaporation (Acc. pot.evapo.) and mean air
temperature (Mean air temp.) for each growing season (May–October) are given.
Table 2
Means of treatment eects ± SD for N, P, K, Ca, Mg concentrations in non-abscised leaves sampled and analyzed from three sections
within the shoot in autumn 1998 and autumn 1999
Treatment N P K Ca Mg
(mg g
−1
) (mg g
−1
)
1998 1999 1998 1999 1998 1999 1998 1999 1998 1999
Nutrient level 1 22 ± 3
a
19 ± 1
a
5:6 ± 1:1
a
8:1 ± 0:6
a
16 ± 1
a
17 ± 2
a
15 ± 4
a
20 ± 4
a
1:9 ± 0:3
a
3:3 ± 0:3
a
222± 3
a
23 ± 4
b
4:1 ± 1:0
b
6:3 ± 1:4
b
15 ± 1
a
16 ± 1
a
13 ± 3
b
18 ± 4
b
1:7 ± 0:2
b
2:7 ± 0:4
b
Soil Cd conc. 0 22 ± 3
a
22 ± 4
a
4:8 ± 1:5
a
6:6 ± 1:6
a
15 ± 1
a
17 ± 2
a
14 ± 3
a
18 ± 4
a
1:9 ± 0:3
a
2:9 ± 0:5
a
122± 2
a
19 ± 2
a
4:9 ± 1:1
a
7:8 ± 0:9
b
15 ± 1
a
16 ± 1
a
14 ± 4
a
19 ± 4
a
1:9 ± 0:3
a
3:1 ± 0:3
a
Clone 81090 19 ± 1
a
20 ± 5
a
4:5 ± 0:9
a
7:0 ± 1:3
a
15 ± 1
a
17 ± 2
a
17 ± 1
a
22 ± 2
a
2:1 ± 0:2
a
3:2 ± 0:3
a
78183 24 ± 1
b
22 ± 2
a
5:2 ± 1:5
a
7:4 ± 1:6
a
16 ± 1
a
15 ± 1
b
11 ± 2
b
15 ± 2
b
1:6 ± 0:2
b
2:8 ± 0:4
b
Means within columns followed by dierent letters are dierent at p 6 0:05 when comparing levels within the same treatment
and harvest occasion.
concentrations were not signiÿcantly (p¡0:05) af-
fected by nutrient level (Table 2). During the third
growing season (1999) when the plants had resprouted
after coppicing, the plants at the high nutrient level
(N2) had signiÿcantly (p¡0:05) higher leaf N con-
centrations (23 mg N (g DW)
−1
) than the plants at the
low nutrient level (N1) (19 mg N (g DW)
−1
). Leaf
concentrations of the macronutrients P, Ca and Mg
were signiÿcantly higher at nutrient level N1 com-
pared to nutrient level N2 (p¡0:05), independent of
sampling occasion, while leaf concentration of K was
not inuenced by nutrient level (Table 2).
Clone 81090 had higher leaf concentrations of Ca
and Mg than clone 78183, a trend which was also
true for K during the third growing season. Leaf N
concentration was highest for clone 78183 during the
second growing season, while leaf concentration of P
did not dier between clones. Soil Cd concentration
did not have any pronounced eects on leaf nutrient
concentration.
420 E. Klang-Westin, K. Perttu / Biomass and Bioenergy 23 (2002) 415 – 426
0
150
300
450
600
750
900
Stem biomass (g plant
-1
)
0
5
10
15
20
Stem Cd concentration (mg kg
-1
)
0.0
0.5
1.0
1.5
2.0
2.5
3.0
Stem Cd amount (mg plant
-1
)
N1N2 N1N2 N1N2 N1N2 N1N2 N1N2
Cd0 Cd1 Cd0 Cd1 Cd0
Cd1
N1N2 N1N2 N1N2 N1N2 N1N2 N1N2
Cd0 Cd1 Cd0 Cd1 Cd0 Cd1
Clone 81090
Clone 78183
2-Au98 2-Sp99 1-Au99 2-Au98 2-Sp99 1-Au99
(a)
(b)
(c)
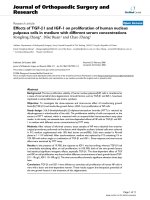
Fig. 3. Mean values ± SD (n = 2) for stem biomass (DW), concentration (dry weight basis) and total amount of Cd in the stem for each
clone (81090 and 78183), nutrient level (N1 and N2) and soil Cd concentration (Cd0 and Cd1). The plants are 2-years old, harvested in
autumn 1998 (2-Au98) and spring 1999 (2-Sp99), and 1-year old sprouts coppiced in autumn 1999 (1-Au99).
3.3. Eect of nutrient level and soil Cd
concentration on biomass and Cd content of stems
Stem biomass production signiÿcantly (p¡0:05)
increased with a higher nutrient supply, indepen-
dent of harvest occasion (Fig. 3a). The increase in
mean stem biomass between nutrient levels 1 and 2
amounted to 60 –80% (Tables 3a–3c). Figure 3b also
shows that stem Cd concentration was aected by
nutrient level. In the stems harvested in autumn 1998
(2-Au98) and spring 1999 (2-Sp99), the Cd concen-
tration was signiÿcantly (p¡0:05) higher at the low
nutrient level (N1) than at the high nutrient level (N2)
(Tables 3a and 3b). The same tendency was found in
the resprouting 1 yr old stems (1-Au99), but it was not
statistically signiÿcant (Fig. 3b and Table 3c). The to-
tal amount (concentration × biomass) of Cd in stems
tended to be slightly higher at the higher nutrient level
(N2) than at the low nutrient level (N1), but the dif-
ference was only statistically signiÿcant (p¡0:05) in
the case of the resprouting 1-year old stems (1-Au99)
(Fig. 3c and Tables 3a–3c). The explanation for the
weak eect on amounts of Cd in the stems is the
opposing and very consistent relationship between
stem biomass production and stem Cd concentration
(Fig. 3a and b). The eects of nutrient levels N1 and
E. Klang-Westin, K. Perttu / Biomass and Bioenergy 23 (2002) 415 – 426 421
Table 3a
Stem biomass, Cd concentration, Cd amount in stems harvested in autumn 1998 (2-Au98) as inuenced by clone, nutrient level and soil
Cd concentration
Analysis of variance
Source df Biomass Cd-conc. Cd-amount
p-values
( =0:05)
Main eects
Nutrient level (N) 1 0.000 0.000 0.087
Soil Cd concentration (Cd) 1 0.168 0.000 0.000
Clone 1 0.000 0.000 0.000
Interactive eects
Clone*N 1 0.263 0.075 0.061
Clone*Cd 1 0.027 0.255 0.626
N*Cd 1 0.094 0.381 0.126
Clone*N*Cd 1 0.010 0.098 0.743
Error 8 0.002 0.251 0.002
Corrected total 15
Means of main eects
± SD (g DW) (mg kg DW
−1
) (mg)
Clone 81090 264
± 77 6:1 ± 1:61:6 ± 0:4
Clone 78183 410
± 137 3:1 ± 1:21:1 ± 0:3
N1 259
± 76 5:3 ± 2:21:3 ± 0:3
N2 415
± 131 3:9 ± 1:81:4 ± 0:5
Cd0 360
± 171 3:6 ± 1:81:1 ± 0:2
Cd1 314
± 81 5:6 ± 1:01:6 ± 0:4
Data for biomass and Cd amount were log-transformed prior to the statistical analyses.
N2 on stem biomass, stem Cd concentration and total
stem Cd amount for each soil Cd concentration (Cd0
and Cd1) and for both clones in Fig. 3, remains the
same regardless of soil Cd concentration.
Increased levels of Cd in the soil did not inuence
stem biomass production (Tables 3a–3c). However,
higher soil Cd concentrations signiÿcantly raised the
concentration and total amount of Cd in the stems
(Tables 3a–3c). The concentration was 1.4 –2.2 times
higher at soil Cd concentration 1 compared to soil Cd
concentration 0 (Fig. 3b). The corresponding total Cd
amount in the stems at Cd1 was 1.3–2.1 times the Cd0
level (Fig. 3c). In the resprouting 1-year-old stems,
the increase in stem Cd concentration tended to be
somewhat higher than the increase in total Cd amount.
3.4. Dierences in stem growth and Cd content
between clones
Clone 78183 produced signiÿcantly more stem
biomass than clone 81090 when harvested after two
growing seasons (2-Au98 and 2-Sp99) (Tables 3a
and 3b). In the resprouting plants harvested in autumn
1999 (1-Au99) there were no dierences in stem
biomass between clones. Clone 81090 had higher
stem Cd concentrations than clone 78183, indepen-
dent of harvest occasion. The total amount of Cd
in the stems was also larger in clone 81090, with
the exception of the stems harvested in spring 1999.
Clone 81090 yielded a higher root biomass and had
a larger amount of Cd in the roots than clone 78183,
independent of harvest occasion (Fig. 4).
3.5. Comparison between plant compartments
The treatment eects on biomass, Cd concentra-
tion and amounts of Cd in leaves and roots followed
more or less the same pattern as those in the stems
(Fig. 4). A comparison of Cd concentrations in the dif-
ferent plant compartments showed that the leaves had
the highest concentrations independent of harvest oc-
casion, nutrient level, clone and soil Cd concentration
422 E. Klang-Westin, K. Perttu / Biomass and Bioenergy 23 (2002) 415 – 426
Table 3b
Stem biomass and Cd concentration and total Cd amount in stems harvested in spring 1998 (2-Sp99) as inuenced by clone, nutrient level
and Cd concentration in the soil
Analysis of variance
Source df Biomass Cd-conc. Cd-amount
p-values
( =0:05)
Main eects
Nutrient level (N) 1 0.001 0.011 0.891
Soil Cd conc. (Cd) 1 0.409 0.005 0.001
Clone 1 0.023 0.024 0.187
Interactive eects
Clone*N 1 0.724 0.899 0.499
Clone*Cd 1 0.507 0.774 0.489
N*Cd 1 0.818 0.331 0.095
Clone*N*Cd 1 0.849 0.778 0.470
Error 8 0.010 0.020 0.095
Corrected total 15
Means of main eects
± SD (g DW) (mg kg DW
−1
) (mg)
N1 237
± 49 7:1 ± 3:61:6 ± 0:6
N2 423
± 147 4:1 ± 1:51:6 ± 0:4
Cd0 353
± 181 3:8 ± 1:41:2 ± 0:2
Cd1 307
± 99 7:3 ± 3:42:0 ± 0:4
Clone 81090 276
± 95 6:7 ± 3:41:7 ± 0:6
Clone 78183 384
± 168 4:5 ± 2:41:5 ± 0:5
Data for biomass and Cd concentration werelog-transformed prior to the statistical analyses.
(Fig. 4). There were no major dierences in Cd con-
centration between the other plant parts (stems, roots
and cuttings). In the 2-year old plants, the amount of
Cd was largest in the stems and lowest in the cuttings,
while leaves and roots were intermediate in this re-
spect. In the resprouting 1-year old plants, Cd amounts
in the roots were relatively larger in comparison to
the amounts in the stem. For clone 81090, which had
a larger root biomass than clone 78183, this meant
that the total root Cd amount was larger than that
of the stem.
4. Discussion
An enhanced nutrient supply resulted in signiÿ-
cantly higher stem biomass production. In general, this
gave rise to lower stem Cd concentrations compared
to when the nutrient supply, and hence biomass pro-
duction, was lower. This eect of enhanced growth on
stem Cd concentrations is commonly referred to as a
biological dilution eect. Biological dilution has also
been reported for heavy metals in other plant species
investigated elsewhere. For example Singh et al. [19]
saw a suppressed Cd uptake in lettuce when the N
level was high (¿ 150 mg N kg
−1
added to the soil)
which could partly be explained by a dilution eect.
Furthermore, Jones et al. [20] observed a substantial
increase in the concentration of lead in the shoots of
plants whose growth rate was slow due to a nutrient
deÿciency. Eects of dilution on the concentration
of Cd have also been demonstrated in ryegrass
plants growing at dierent rates due to the age of the
plants [21].
The opposing and very consistent trends in stem
biomass production and stem Cd concentration re-
sulted in insigniÿcant or small positive eects on
the total amount of Cd in the stems (Fig. 3c). This
indicates that the incorporation of Cd into the stems
is governed by processes which are independent of
E. Klang-Westin, K. Perttu / Biomass and Bioenergy 23 (2002) 415 – 426 423
Table 3c
Stem biomass and concentration and total amount of Cd in stems harvested in autumn 1999 (1-Au99) as inuenced by clone, nutrient
level and Cd concentration in the soil
Analysis of variance
Source df Biomass Cd-conc. Cd-amount
p-values
( =0:05)
Main eects
Nutrient level 1 0.016 0.097 0.011
Cd concentration in soil 1 0.118 0.000 0.000
Clone 1 0.922 0.019 0.003
Interactive eects
Clone*N 1 0.585 0.598 0.821
Clone*Cd 1 0.778 0.415 0.449
N*Cd 1 0.638 0.246 0.087
Clone*N*Cd 1 0.946 0.460 0.249
Error 8 0.014 1.060 0.004
Corrected total 15
Means of main eects
± SD (g DW) (mg kg DW
−1
) (mg)
N1 152
± 22 5:7 ± 2:40:8 ± 0:3
N2 239
± 81 4:8 ± 2:11:0 ± 0:3
Cd0 221
± 86 3:5 ± 0:90:7 ± 0:2
Cd1 170
± 50 7:0 ± 1:71:1 ± 0:2
Clone 81090 190
± 53 6:0 ± 2:41:1 ± 0:3
Clone 78183 201
± 92 4:5 ± 2:00:8 ± 0:2
Data for biomass and Cd amount were log-transformed prior to the statistical analyses.
biomass production. Plants of Salix whose growth
rate is slow because of nutritional constraints are
therefore likely to have elevated concentrations of Cd.
This seems to be valid also for P, Ca and Mg, but not
for N and K. In this context it should be mentioned
that the leaf concentrations of macronutrients in the
present study were in almost the same range as those
presented in some other investigations for young,
fertilized, high-yielding stands sampled in mid-
summer [22].
Stem biomass production is, however, not only
determined by the supply of nutrients. Lindroth and
Cienciala [23] concluded that water availability is a
critical factor for growth of Salix in Sweden. During
some periods of the growing season, water avail-
ability will probably be the most limiting factor for
growth. It is therefore likely that the plants will grow
more slowly than can be expected from available N
during some periods of growth. In the present inves-
tigation the plants received the same amount of water
irrespective of nutrient level, in order to reduce the
number of experimental factors and also to simulate
ÿeld conditions.
As pointed out earlier, when comparing the amount
of Cd in the stems at the two nutrient levels the same
pattern could be distinguished regardless of harvest
occasion. However, in the 2-year old plants (2-Au98
and 2-Sp99) the eect of nutrient level on total stem
Cd amount was insigniÿcant. This was not the case
in the coppiced 1-year old plants (1-Au99), where the
amount of Cd was signiÿcantly higher at the higher
nutrient level compared to the lower nutrient level.
Similar results were observed in a study with Salix
conducted in a climate chamber for two growing sea-
sons and where the plants were supplied with N in
accordance with growth at two dierent rates [15]. In
contrast to the present study, the dierence between
the high and low nutrient levels was more pronounced
and the plants were kept well watered at both nutri-
ent levels, while the growth medium was solely a clay
mineral (vermiculite). The somewhat diering results
between the 1- and 2-year old plants described in the
424 E. Klang-Westin, K. Perttu / Biomass and Bioenergy 23 (2002) 415 – 426
0
10
20
30
Cd concentation (mg kg-1)
Leaves
Ste
m
Cuttin
g
Root
Clone 81090
0
10
20
30
Clon
e 78183
-3.5
-2.5
-1.5
-0.5
0.5
1.5
2.5
3.
5
-3.5
-2.5
-1.5
-0.5
0.5
1.5
2.5
3.5
Cd amount (mg plant-1)
N1 N2
2-Au98
Cd0 Cd1
N1 N2
N1 N2
2-Au99
N1 N2
Cd0 Cd1
L
S
C
R
N1 N2
2-Au98
Cd0 Cd1
N1 N2
N1 N2
2-Au99
N1 N2
Cd0 Cd1
Fig. 4. Mean values (n = 2) for Cd concentration (dry weight basis) and total Cd amount per plant in leaves (L), stems (S), cuttings (C)
and roots (R) for each clone (81090 and 78183), nutrient level (N1 and N2) and soil Cd concentration (Cd0 and Cd1). The plants are
2-years old harvested in autumn 1998 (2-Au98) and 1-year old sprouts coppiced in autumn 1999 (1-Au99). For the plants harvested in
autumn 1998 (2-Au98), data for the cuttings and roots are missing.
present investigation might be a consequence of cop-
picing. According to Bollmark [24], coppicing may,
for example, result in changes in growth rate for dif-
ferent plant parts depending on nutrient level and also
changes in mobilization and translocation of nutrients
and carbohydrates, which in turn may aect the con-
centration and amount of Cd in the stems. Other expla-
nations for the dierences between the 2- and 1-year
old plants in this study might be changed weather con-
ditions between the second and the third growing sea-
son, but also the higher water availability in the 1-year
old plants as they received the same amount of water
as before coppicing.
An increased soil Cd concentration in the topsoil
in the current investigation increased the Cd concen-
tration and the total Cd amount in the plants, demon-
strating the ability of Salix to take up more Cd from
more contaminated soils. In some cases, the increase
in total stem Cd amount tended to be almost directly
proportional to the increase in soil Cd concentration.
However, more often the increase in stem Cd amount
was between 40 and 80% of the increase in Cd content
of the topsoil. The reason that the increase in stem Cd
concentration is less than the increase in the topsoil
Cd concentration may be that a signiÿcant proportion
of Cd in the stems is taken up from the subsoil.
Clone 81090 had higher stem Cd concentrations
compared to clone 78183. The reason might be clone
speciÿc or a consequence of the higher stem biomass
production of clone 78183. As pointed out earlier, var-
ious clones dier in their ability to take up Cd and
to transport Cd up to the shoot [7]. Clones also dier
in their distribution of Cd between stems and leaves,
which has been seen by Perttu et al. [15]. The choice
of clone will therefore be important for the removal of
Cd at stem harvest. Both clones in this investigation
had an intermediate transport of Cd up to the shoot.
In general, the leaves had higher Cd concentrations
than the stems, a trend also recorded by Riddel-Black
[25]. However, the total amount of Cd is larger in
the stems, at least if harvest is performed after two or
more growing seasons.
5. Conclusions
• Increased fertilization in this experiment consis-
tently resulted in increased biomass production,
E. Klang-Westin, K. Perttu / Biomass and Bioenergy 23 (2002) 415 – 426 425
and generally in a higher total Cd content in the
stems. However, the magnitude of the increase
in total Cd was small and only statistically sig-
niÿcant in some cases, mainly because increased
biomass also resulted in lower Cd concentration.
Thus, if Salix is used as a phytoextractor of
Cd, the possibilities for signiÿcantly increasing
removal rate by increased biomass production
would seem to be restricted. On the other hand,
if a low Cd concentration in Salix biofuel is de-
sirable, the prospects of achieving that through
increased biomass production are good.
• Addition of Cd to the topsoil resulted in higher
Cd concentrations and Cd amounts in the Salix
plants. Thus, the eciency of Salix as a phytoex-
tractor may increase with the degree of pollution
of the soil.
• Clones diered in concentrations and total
amounts of Cd in the stems. This indicates that
choice of clone may be a better way to increase
the phytoextraction eect of Salix than increas-
ing biomass production by fertilization.
• The amount of Cd was higher in stems than in
leaves. Unless a signiÿcant amount of Cd is taken
up from the subsoil, this means that more Cd is
taken out from the topsoil by stem harvest than
is recirculated back by litterfall.
Acknowledgements
The authors cordially thank Richard Childs,
Eva-Marie Fryk, Christina Segerqvist, Eira Casen-
berg, Gunilla Lundberg and Gunilla Hallberg for
their help in starting and managing the experiment,
sampling, sample preparation and analyses. We also
want to thank Dr. Jan Eriksson, Dr. Par Aronsson,
Dr. Maria Greger and Dr. Anders Goransson for valu-
able discussions and comments on the manuscript.
This research was ÿnancially supported by Vattenfall
AB, The Federation of Swedish Farmers and The
Swedish National Energy Administration.
References
[1] Eriksson J, Soderstrom M, Andersson A. Cadmium
contents in the plough layer of Swedish agricultural soils.
Naturv
ardsverket Report 4450, 1995. 30p [in Swedish with
English summary]
[2] Andersson A. Trace elements in agricultural soils-uxes,
balances and background values. Swedish Environmental
Protection Agency Report 4077, 1992.
[3] Eriksson J. A ÿeld study on factors inuencing Cd levels in
soils and in grains of oats and winter wheat. Water, Air, and
Soil Pollution 1990;53:69–81.
[4] FAO=WHO. Report of the Eighth Session of the Codex
Committee on Cereals, Pulses and Legumes held in
Washington DC, 26–30 October 1992. Joint FAO=WHO Food
Standards Programme, Codex Alimentarius Commission, 20th
Session, Geneva 28 June–July, 1993. p. 3.
[5]
Oborn I, Jansson G, Johnsson L. A ÿeld study on the
inuence of soil pH on trace element levels in spring
wheat (Triticum aestivum), potatoes (Solanum tuberosum)
and carrots (Daucus carota) Water Air and Soil Pollution
1995;85(2):835–40.
[6] Brieger G, Wells JR, Hunter RD. Content in y ash
ecosystem. Water, Air, and Soil Pollution 1992;63:87–103.
[7] Landberg T, Greger M. Can heavy metal tolerant clones
of Salix be used as vegetation ÿlters on heavy metal
contaminated land? In: Aronsson P, Perttu K, editors. Willow
vegetationÿlters for municipal wastewaters and sludges.
Report 50. Swedish Univ. of Agric. Sci., Dept. Ecol. Envir.
Res., Sect. Short Rotation forestry, 1994. p. 133–44.
[8]
Ostman G. Kadmium i Salix. Report 5. Vattenfall utveckling
AB, Projekt bioenergi, 1994. 22pp [in Swedish with English
summary].
[9] Felix H. Field trials for in situ decontamination of heavy
metal polluted soils using crops of metal-accumulating plants.
Z Planzenernahr Bodenk 1997;160:525–9.
[10] Greger M, Landberg T. Use of willow in phytoextraction.
International Journal of Phytoremediation 1999;1:115–23.
[11] Baker AJM, McGrath SP, Sidoli CMD, Reeves RD. The
possibility of in situ heavy metal decontamination of polluted
soils using crops of metal-accumulating plants. Resources,
Conservation and Recycling 1994;11:41–9.
[12] Landberg T, Greger M. Dierences in uptake and tolerance
to heavy metals in Salix from unpolluted and polluted areas.
Applied Geochemistry 1996;11:175–80.
[13] Grant CA, Buckley WT, Bailey LD, Selles F. Cadmium
accumulation in crops. Canadian Journal of Plant Science
1998;78:1–17.
[14] Greger M. Metal availability and bioconcentration in plants.
In: Prasad MNV, Hegemeyer J, editors. Heavy metal stress
in plants. Heidelberg: Springer, 1999. p. 1–27.
[15] Perttu K, Eriksson J, Greger M, Goransson A, Blomback
K, Klang-Westin E, Landberg T. Slutrapport for projektet
Forr
ad och oden av kadmium i systemet mark-Salix.
Published by The Swedish National Energy Administration,
in press [in Swedish].
[16] Rytter R-M. Fine root production and carbon and nitrogen
allocation in basket willows. Dissertation. Silvestria 39,
Swedish University of Agricultural Sciences, Department of
Short-rotation Forestry, 1997.
426 E. Klang-Westin, K. Perttu / Biomass and Bioenergy 23 (2002) 415 – 426
[17] Rytter L, Ericsson T. Leaf nutrient analysis in Salix viminalis
(L.) energy forest stands growing on agricultural land.
Z Planzenernahr Bodenk 1993;156:349–56.
[18] Swedish Standars Institute. Soil analysis-determination of
trace elements in soils-Extraction with nitric acid. SS 028311,
1997 [in Swedish].
[19] Singh JP, Bharat S, Karwasra SPS. Yield and uptake response
of lettuce to cadmium as inuenced by nitrogen application.
Fertilizer Research 1988;18(1):49–56.
[20] Jones LHP, Jarvis SC, Cowling DW. Lead uptake from soils
by perennial ryegrass and its relation to the supply of an
essential element (sulphur). Plant and Soil 1973;38:605–19.
[21] Jarvis SC, Jones LHP. Uptake and transport of cadmium
by perennial ryegrass from owing solution culture with
a constant concentration of cadmium. Plant and soil
1978;49:333–42.
[22] Ericsson T, Rytter L, Linder S. Nutritional dynamics and
requirements of short-rotation forests. In: Mitchell CP,
Ford-Robertson T, Hinckley T, Sennerby-Forsse L, editors.
Ecophysiology of short rotation forest crops. London and
New York: Elsevier Science Publishers, 1992. p. 35–65.
[23] Lindroth A, Cienciala E. Water use eciency of short-rotation
Salix viminalis at leaf, tree and stand scales. Tree physiology
1996;16:257–62.
[24] Bollmark L, Sennerby-Forsse, Ericsson T. Accumulation
and mobilisation of nutrient reserves in Salix viminalis.
Dissertation. Silvestria 155, Swedish University of
Agricultural Sciences, Department of Short-rotation Forestry,
2000.
[25] Riddel-Black D. Heavy metal uptake by fast growing
willow species. In: Aronsson P, Perttu K, editors. Willow
vegetationÿlters for municipal wastewaters and sludges.
Report 50. Swedish Univ. of Agric. Sci., Dept. Ecol. Envir.
Res., Sect. Short Rotation forestry. 1994. p. 145–51.