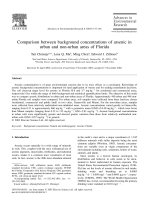
Heavy metal contamination in soils of urban highways (comparision between runoff and soil concentration
Bạn đang xem bản rút gọn của tài liệu. Xem và tải ngay bản đầy đủ của tài liệu tại đây (152.5 KB, 22 trang )
HEAVY METAL CONTAMINATION IN SOILS OF URBAN HIGHWAYS:
COMPARISON BETWEEN RUNOFF AND SOIL CONCENTRATIONS AT
CINCINNATI, OHIO
DILEK TURER
1
, J. BARRY MAYNARD
1∗
and J. JOHN SANSALONE
2
1
University of Cincinnati, Department of Geology, ML 0013, Cincinnati, OH 45221-0013, Ohio,
U.S.A.;
2
Louisiana State University, Department of Civil and Environmental Engineering, Rm.
3510 CEBA Bldg, Baton Rouge, LA 70803-6405, U.S.A.
(
∗
author for correspondence, e-mail: )
(Received 17 March 2000; accepted 15 November 2000)
Abstract. Rainfall runoff from urban roadways often contains elevated amounts of heavy metals
in both particulate and dissolved forms (Sansalone and Buchberger, 1997). Because metals do not
degrade naturally, high concentrations of them in runoff can result in accumulation in the roadside
soil at levels that are toxic to organisms in surrounding environments. This study investigated the
accumulation of metals in roadside soils at a site for which extensive runoff data were also available.
For this study, 58 soil samples, collected from I-75 near Cincinnati, Ohio, were examined using
X-ray fluorescence, C-S analyzer, inductively coupled plasma spectroscopy, atomic absorption spec-
trometry and X-ray diffraction. The results demonstrated that heavy metal contamination in the top
15 cm of the soil samples is very high compared to local background levels. The maximum measured
amount for Pb is 1980 ppm (at 10–15 cm depth) and for Zn is 1430 ppm (at 0–1 cm depth). Metal
content in the soil falls off rapidly with depth, and metal content decreases as organic C decreases.
The correlation to organic C is stronger than the correlation to depth. The results of sequential soil
extraction, however, showed lower amounts of Pb and Zn associated with organic matter than was
expected based on the correlation of metals to % organic C in the whole soil. Measurement of organic
C in the residues of the sequential extraction steps revealed that much of the carbon was not removed
and hence is of a more refractory nature than is usual in uncontaminated soils. Cluster analysis of the
heavy metal data showed that Pb, Zn and Cu are closely associated to one another, but that Ni and
Cr do not show an association with each other or with either organic C or depth. ICP spectroscopy
of exchanged cations showed that only 4.5% of Pb, 8.3% of Zn, 6.9% of Cu and 3.7% of Cr in the
soil is exchangeable. Combined with the small amounts of metals bound to soluble organic matter,
this result shows that it is unlikely that these contaminants can be remobilized into water. At this site,
clays are not an important agent in holding the metals in place because of low amounts of swelling
clays. Instead, insoluble organic matter is more important. Mass balance calculations for Pb in soil
showed that most of the Pb came from exhausts of vehicles when leaded gasoline was in use, and
that about 40% of this Pb is retained in the soil. This study shows that, highway environments being
a relatively constant source of anthropogenic organic matter as well as heavy metals, heavy metals
will continue to remain bound to organic matter in-situ unless they are re-mobilized mechanically.
Removal of these heavy metals as wind-blown dust is the most likely mechanism. Another possibility
is surface run-off carrying the metals into surface drainages, bypassing the soil. This study also shows
that for those countries still using leaded gasoline, important reductions in Pb contamination of soils
can be achieved by restricting the use of Pb additives.
Keywords: copper, flux, highway soils, lead, organic carbon, pavement runoff, zinc
Water, Air, and Soil Pollution 132: 293–314, 2001.
© 2001 Kluwer Academic Publishers. Printed in the Netherlands.
294 D. TURER ET AL.
Abbreviations: AAS, Atomic Absorption Spectrometry; CEC, Cation Exchange Capacity; EMC,
Event Mean Concentration; ICP, Inductively Coupled Plasma; LECO, C-S Analyzer; meq, milli-
equivalent; XRD, X-ray diffraction; XRF, X-ray fluorescence.
1. Introduction
Adverse health effects of lead as an environmental contaminant have long been
known (EPA, 1999). Consequently, there have been many studies on contamination
of soils along highways, with the main emphasis on Pb. For example, Vandenabeele
and Wood (1972), who worked on highway soil samples in Utah, found 180 to
215 ppm Pb in surface soil and 65 to 125 ppm Pb at 10 cm depth, 10 m away on the
east and west sides of the highway. They interpreted the amounts of contamination
at 10 cm as unusually high and they stated that although contamination is limited
to a narrow zone along highways, it is not limited to surface soil. They further
stated that Pb in soil can be leached and mobilized by solutions containing NaCl,
for example from road salting.
Ward and others (1975) investigated the lead content of soil and vegetation
along a part of a state highway passing through an uninhabited area of New Zea-
land. They observed an inverse relationship between Pb content of vegetation and
distance from the road, as has been reported from other areas. Their analysis showed
that washed vegetation samples contained 70–80% of the Pb levels of unwashed
samples, indicating that the majority of the Pb is relatively immobile. They found
the same fall-off of Pb levels in soil samples with distance from the road. The
highest levels of soil Pb, reaching 160 ppm, were obtained from the top 5 cm of
the soil (the background level of Pb was 40 ppm). To calculate total excess Pb in
the soil, they plotted the values of excess lead for 1-m by 1-m by 6-cm volume
increments as a function of distance and found an integrable function which fit
the data: M(x) = M(0) exp [–k(x)
1/2
] (where M(x) is the excess mass of lead in
the increment at distance x). They estimated the total emitted lead from vehicles
for that area using the known traffic flow of 6.0±1.0 × 10
6
vehicles since 1960.
When they compared the total amount of emitted Pb (240 g along each meter of
the road) with the calculated excess in the soil (140 g along each meter of the
road) they concluded that the elevated levels of Pb in the top 6 cm of soil were
primarily sourced from leaded gasoline. Their results suggest that about 60% of
the Pb emitted is retained by the soils close to the highway.
Wheeler and Rolfe (1979) found that lead from automotive sources in roadside
soil and vegetation follows a double exponential function of the following form: Pb
=A
1
e
−k1D
+A
2
e
−k2D
. The terms A
1
and A
2
are linear functions of average daily
traffic volume and the exponents represent different particle sizes. Their studies
showed that larger particles are deposited within 5 m of the roadside and are inert
in the soil whereas small particles are deposited more slowly and are deposited
within 100 m of the roadside. Also they suggested that 72–76% of historical lead
HEAVY METAL CONTAMINATION IN SOILS OF URBAN HIGHWAYS 295
deposited on the soil has been lost from the surface 10 cm of soil. The highest
amount of lead found was 1225 ppm in soil and 196 ppm in vegetation at 0.3 m
away from highways of central Illinois with 8100 vehicles day
−1
traffic density. In
this area, background levels, which were 16 ppm for soil and 10 ppm for vegetation,
were reached at 50 m from the highways.
Similar results come from Onyari and others (1992), who worked on roadside
soils in Kenya where lead is still used as a gasoline additive. They found that lead
concentrations within Nairobi City varied from 137 to 2196 ppm with a mean of
659 ppm. The highest value was measured in the Nairobi hill region, which they
explained by acceleration of motor vehicles because of the steep nature of the hill.
The amount of Pb emitted as a percentage of Pb consumed increases as vehicle
speed increases.
Gratani and others (1992) studied the accumulation of Pb in agricultural soil
and vegetation along the Fiano-San Cesareo highway in Italy. They documented
an increase of Pb values in the soil within the few years that had passed since
the highway was opened. Agricultural soils were found to accumulate more Pb,
because the organic matter causes it to be bound to organic exchange sites, reducing
its availability for root uptake (Albasel and Cottenie, 1985). They also looked at
oak leaves, which showed similar increases in Pb concentration with time.
Teichman and others (1993) sampled yards within 1 mile of Interstate 880 in
Alameda County, California. Surface samples contained an average of 570 ppm Pb
with a maximum of 2030 ppm. Subsurface samples from the same sites showed
an average of 620 and a maximum of 1400 ppm Pb. 63% of the subsurface Pb
concentrations exceeded corresponding surface concentrations. They interpreted
this pattern as indicating that as the use of leaded gasoline decreased, the Pb content
of the upper layers of soil also decreased.
There have been a few studies that included other heavy metals like zinc, cad-
mium and copper with measurements of lead. Gibson and Farmer (1984) applied
a six-step sequential leaching procedure to soil and street dirt in order to under-
stand environmental mobility and bioavailability of Pb, Zn, Cu and Cd. The results
of this study revealed that the exchangeable fraction was of significantly greater
relative importance in street dust than in soil, especially for Pb, Zn and Cu. They
reported exchangeable percentages of Pb
dust
: 13%, Pb
soil
:2%;Zn
dust
: 10%, Zn
soil
:
3%; Cu
dust
: 11%, Cu
soil
:2%;Cd
dust
: 27%, Cd
soil
: 19%. Hamilton and others (1984)
investigated levels of Cd, Cu, Pb and Zn in road dust at three sites with different
traffic usage and surface textures. The results showed that amount of contamina-
tion increases as traffic density increases. They also applied sequential extraction
procedure on size-fractionated dust samples. Cd is found as the highest proportion
of total metal in the exchangeable fraction whereas Cu is mainly in the strongly
bound organic and residual phases. Hewitt and Candy (1990), examined levels of
Pb, Cd and Zn in soil and dust samples collected in and around the city of Cuenca,
Ecuador. The metal concentrations for the urban environment were considerably
elevated (Pb: 77–970 ppm, Cd: 0.23–0.42 ppm, Zn: 155–1018 ppm). The dominant
296 D. TURER ET AL.
TABLE I
Event mean concentration data for I-75 experimental site with EPA criteria
(Sansalone and Buchberger, 1996)
Total EMC (µgL
−1
)
8 April 30 April 5 July 8 September 3 October Discharge
1995 1995 1995 1995 1995 criteria
Zn 459 628 15244 3612 1427 120
Cd 5 6115 8 5.6
Cu 43 70 325 166 71 18
Ni 9 23 91 83 11 1700
Pb 62 31 44 88 97 82
Cr 35 14 29 14 14 1400
Mn
∗
120 175 820 337 166 None
Fe
∗
3477 932 4676 6415 5178 None
Al
∗
2224 1859 270 1621 5496 None
Violations of EPA discharge criteria in bold.
∗
Not EPA priority pollutants.
source for the Pb in urban street dust was shown to be emission of Pb aerosol from
gasoline vehicles. Tyre rubber was shown to be the main source for Zn and also
for Cd, plus some from metal platings on car parts. It was also suggested that the
poor condition of road surfaces in Cuenca might have been enhancing tyre wear.
Suburban samples taken from 5.5 km away from the city center had lower values
of metals (Pb: 54–109 ppm, Cd: 0.20–0.27 ppm, Zn: 44–120 ppm). Samples taken
from close to a rural track used by only 100 vehicles per day, had lower values
of Pb: 0.6–15 ppm but not Cd and Zn: (0.29 ppm; 52–541 ppm). The background
Pb obtained from Rio Mazan valley was very low: 0.02–9 ppm. The Cd levels
however were not significantly different from those found in the other areas (0.05–
0.5 ppm). They suggested that the influence of vehicular emission of Cd was much
more localized than it was for Pb, probably due to the emission of Cd as very large
particles that are transported only short distances.
In these studies, the main source for Pb in the soils was shown to be leaded gas-
oline in highway vehicles. Also all the analyses showed that the amount of heavy
metal contamination decreased with depth and with distance from the highway.
Although some countries like the U.S. prohibit the use of leaded gasoline there are
many other countries that continue using leaded gasoline in their transportation.
Even for the U.S. the problem of heavy metal contamination has not been elimin-
ated. Sansalone and Buchberger (1997) sampled lateral pavement sheet flow from
a study area with an area of 15 × 20 m on I-75 in Cincinnati, during five rainfall
events in 1995. Their results showed that the event mean concentrations (EMC)
HEAVY METAL CONTAMINATION IN SOILS OF URBAN HIGHWAYS 297
of Zn and Cu exceeded surface quality discharge standards for all rainfall events
and that Pb had two and Cd had three excedences (Table I). They also investigated
partitioning of metals and solids in storm water. Their results indicated that Zn, Cd,
Cu were mostly in dissolved form whereas Pb, Fe and Al were particulate-bound
in storm water.
In the current study we use the same site as Sansalone and Buchberger (1997) to
examine how much of this runoff of heavy metals gets transferred to the soil. We
have also attempted to determine the mechanisms that control both the retention
and remobilization of metals. To do so, we have included information about clay
mineralogy and organic carbon content of the soil samples taken from the same site
where Sansalone and Buchberger carried out their work. Also the work presented
here goes one step further than previous studies in that it makes mass balance
calculations for Zn, Cu, Ni and Cr in addition to Pb, calculations made possible by
the availability of runoff data for the same site.
2. Methods
2.1. S
AMPLING LOCATION
The samples were collected along I-75, a heavily traveled north-south interstate
in Cincinnati (Figure 1). 156 670 vehicles were counted per day in 1994 (ODOT,
1999). The soils are clay-rich and are visually uniform both laterally and with
depth. Some 1961–1990 climate characteristics of Cincinnati (Climate Diagnostic
Center, 1999) are
Mean annual temperature 54
◦
F
Minimum temperature –15
◦
F
Mean annual precipitation 39.7 inches
Mean annual snowfall 18.3 inches
Winter conditions are such that road salting is commonly practiced. The soil samples
were taken with Shelby tubes, one set (BH) in a N–S direction (parallel to the
highway) and another (XS) in an E–W direction. Next, the soil samples were di-
vided into sections with 5 cm increments down to 15 cm; at greater depths larger
increments were used.
2.2. A
NALYTICAL METHODS
In this study five different types of analysis have been applied for different as-
pects of the research: X-ray fluorescence (XRF, Rigaku 3070 spectrometer), C-S
analyzer (LECO), Inductively coupled plasma spectroscopy (ICP, Perkin-Elmer
Optima 3000), Atomic absorption spectrometry (AAS, Perkin-Elmer 3110) and
X-ray diffraction (XRD, Siemens D-500).
298 D. TURER ET AL.
Figure 1. Study area showing location of Cincinnati and the positions of sampling stations (After Sansalone et al., 1998).
HEAVY METAL CONTAMINATION IN SOILS OF URBAN HIGHWAYS 299
The first step in this research has been application of XRF to determine the bulk
chemistry of the samples. For this, samples were dried at 100
◦
C and ground using a
steel ball mill. Pressed pellets for XRF were prepared with 5–6 g of sample pressed
under 18 tons for 4–5 min. Samples were run against a set of U.S. Geological
Survey rock standards combined with a set of roadside soil samples previously
analyzed by XRAL, Inc. of Toronto, Canada by neutron activation.
LECO analysis was applied in order to find percentages of organic C, total C
and total S in the soils. Total C and total S were run on dried powders. Organic
C was measured on acidified samples. The acidification was done using 50 mL of
1 N HCl to 0.5 g of sample on a hot plate at 60
◦
C for 12 hr. Fifty mL of distilled
water was then added to stop reaction. The solution was filtered through a glass
fiber filter and the residue rinsed with distilled water to remove all acid. Samples
were then dried at least four hours.
ICP was used to determine the nature of the exchangeable ions. Fifteen mL
of 1 molar NH
4
acetate at pH 7 was added to 0.2 g of sample. The suspension
was left overnight and centrifuged the next day. Five mL of nitric acid was added
to the liquid taken out from the centrifuged tubes to maintain metals in solution
(Ulmschneider, 1977).
Atomic absorption (AAS) was used to monitor sequential extraction of metals.
2 g of dry soil sample was placed into a labeled centrifuge tube. The extraction
steps then are (Sposito et al., 1982):
• 25 mL of 0.5 M KNO
3
was added and shaken for 16 hr (exchangeable fraction);
• 25 mL of distilled H
2
O was added and shaken for 2 hr (absorbed fraction);
• 25 mL of 0.5 M NaOH was added and shaken for 16–21 hr (organically bound
fraction);
• 25 mL of 0.05 M Na
2
EDTA was added and shaken for 6 hr (carbonate bound
fraction);
• 25 mL 4 M HNO
3
added and heated (70–80
◦
C oven) for 16–21 hr (residual
fraction).
After each step the sample was centrifuged and filtered through a Whatman # 42
filter into a nalgene bottle. The solutions were refrigerated and saved for Atomic
Absorption Spectrometric Analysis.
XRD was used to determine sample mineralogy, especially the clay mineral
types. Sample preparation started by putting 2–3 g of sample in a beaker filled
with 200 mL of water. After stirring, the suspension was left for 45 min. The clay
minerals, which were floating close the surface, were caught with a pipette and
transferred onto a glass slide. The sample was left to air dry. For some samples it
was not possible to collect the necessary amount of clay minerals by pipette. In
that case, the top part of the water in the beakers was taken into centrifuge tubes.
After centrifugation, the clay minerals separated at the bottom of the tubes were
applied as a paste on glass slides. One set of slides was left air dried, a duplicate
300 D. TURER ET AL.
set was glycolated, and another set was heated to 350 and to 550
◦
C in order to
differentiate clay minerals.
3. Results
3.1. B
ULK SOIL COMPOSITION
XRF data showed that heavy metal content is very high in the top 15 cm of the soil
(Table II). The maximum measured amount for Pb is 1980 ppm, which was taken
from 10–15 cm depth in core BH9. The highest value for Zn is 1426 ppm at XS1
from 0–1 cm depth. For comparison, background values, calculated as weighted
averages of concentrations in samples taken from below 30 cm, were Pb 60 ppm;
Zn 85 ppm; Cu 35 ppm; Ni 40 ppm; and Cr 35 ppm. Metal values decrease with
depth (Figure 2). This inverse relationship is stronger for Zn and Cu (R
2
Zn
:0.53and
R
2
Cu
:0.53)thanforPb,NiandCr(R
2
Pb
: 0.33, R
2
Ni
: 0.22, R
2
Cr
: 0.16).
From the LECO analysis, average organic C percent for these soil samples is
3.8 and total C is 6.8%. There is a positive correlation between organic C content
and metal values: as the amount of organic C increases, the amount of heavy metal
contamination also increases (Figure 3). In addition the correlation is stronger for
organic C and metal content than for depth vs. metal content for each of the metals
(R
2
Zn
: 0.59, R
2
Cu
: 0.77, R
2
Pb
: 0.62, R
2
Ni
: 0.40, R
2
Cr
: 0.24). Note that the correlation
coefficient for Pb is much higher for the Pb vs organic C relationship than for the
Pb vs depth relationship, whereas both Ni and Cr show very weak relationships to
both depth and to organic C.
Cluster analysis was used to further illustrate which metals have close asso-
ciations with each other, with depth and with organic C amount in the soil. The
result showed that Pb, Zn and Cu are acting together and they are more closely
associated with the amount of organic C in the soil than with depth. Ni and Cr,
however, did not show any association with other metals, with organic C or with
depth (Figure 4).
The yields of exchangeable metals using NH
+
4
as the exchange ion were low
(except for Ca, which probably comes from dissolution of calcite as discussed by
Tessier et al., 1979). For 12 samples analyzed by ICP (Table III), average exchange-
able Pb was only 4.5%, Zn 8.3%, Cu 6.9%, and Cr 3.7% of the amount in the whole
soil based on XRF.
3.2. S
EQUENTIAL EXTRACTION
The sequential soil extraction procedure was applied to 5 soil samples. The res-
ults confirmed that the metal amounts in the exchangeable fraction are very low
(Table IV). On average only 1.6% of Pb, 0.4% of Zn, 1.7% of Cu, 4% of Ni
and 5% of Cr are exchanged with KNO
3
. Adsorbed metals were also very low.
HEAVY METAL CONTAMINATION IN SOILS OF URBAN HIGHWAYS 301
TABLE II
Results of LECO and XRF
Sample Depth LECO (%) XRF (ppm)
(cm) Organic C Total C S Cr Cu Ni Rb Sr Zn Zr Pb
BH1-01 0–1 2.65 5.11 0.16 71 125 50 70 233 598 245 670
BH2-01 0–1 4.76 8.81 0.15 67 230 58 77 168 329 230 566
BH2–612-818 36–46 0.16 1.98 0.06 36 30 47 84 172 107 293 47
BH3-01 0–1 3.50 8.09 0.14 72 131 55 64 204 224 203 358
BH3-1015-816 31–36 29.29 0.00 0.06 137 119 89 94 654 147 221 73
BH4-01 0–1 5.22 11.27 0.11 74 250 62 84 174 828 196 924
BH4-15 1–5 10.32 0.06 79 290 61 78 164 443 214 1001
BH4-510 5–10 1.55 3.86 0.06 79 90 53 180 328
BH4-1015 10–15 5.28 0.04 64 30 51 97 176 67 143 35
BH4-01-612 15–16 0.32 4.89 0.04 55 24 52 106 178 60 117 21
BH4-15-612 16–21 0.32 4.06 0.04 55 26 56 124 177 58 133 15
BH4-1219 30–48 0.20 4.35 0.04 –9 21 35 51 160 61 143 17
BH5-01 0–1 17.98 15.52 0.11 72 353 64 89 169 1207 148 942
BH5-15 1–5 4.98 10.53 0.08 82 389 64 68 192 578 218 1073
BH5-510 5–10 5.06 9.32 0.05 65 134 56 62 250 288 173 957
BH5-1015 10–15 1.87 5.29 0.05 78 124 60 266 600
BH5-611 15–28 0.96 5.16 0.03 6 34 40 60 184 104 95 75
BH6-01 0–1 7.92 10.82 0.13 75 249 53 62 211 380 196 368
BH6-15 1–5 4.36 9.65 0.13 69 233 54 344 314
BH6-510 5–10 2.72 8.38 0.20 84 106 47 192 469
BH61015 10–15 6.17 10.73 0.15 75 401 66 459 1298
BH6-612 15–30 1.13 4.62 0.09 64 61 50 86 212 96 195 117
BH6-1216 30–41 1.14 5.56 0.08 21 50 42 72 214 140 154 168
BH8-01 0–1 6.10 11.73 0.23 79 239 56 771 188 457 200 381
BH8–613 15–30 0.43 3.62 0.10 25 39 46 96 170 138 153 111
BH9-01 0–1 3.08 7.14 0.06 94 91 46 55 225 193 207 166
BH9-15 1–5 4.30 10.09 0.11 56 65 41 174 119
BH9-510 5–10 5.35 10.02 0.08 69 107 48 260 175
BH9-1015 10–15 6.60 11.77 0.10 73 275 54 49 195 619 266 1980
BH9-612 15–30 1.41 4.08 0.06 66 73 54 103 156 167 218 407
BH9-1218 30–46 0.77 2.69 0.10 68 30 59 130 132 71 198 27
BH9-1826 46–66 0.61 3.46 0.04 58 26 6 62 30
302 D. TURER ET AL.
TABLE II
(continued)
Sample Depth LECO (%) XRF (ppm)
(cm) Organic C Total C S Cr Cu Ni Rb Sr Zn Zr Pb
XS1-01 0–1 14.69 0.24 79 170 48 41 214 1426 185 643
XS1-612 15–30 0.57 5.60 0.07 11 27 38 58 194 101 132 135
XS2-01 0–1 7.74 12.41 0.20 78 340 59 78 168 548 257 738
XS2-15 1–5 5.64 9.71 0.12 81 249 60 342 610
XS2-510 5–10 1.31 5.19 0.11 114 43 47 78 88
XS2–1015 10–15 0.58 2.05 0.06 92 29 53 63 24
XS2-714 15–36 0.26 1.47 0.07 37 26 44 93 166 92 252 41
XS3-01 0–1 6.16 12.14 0.16 957 270
XS3-15 1–5 1.14 5.69 0.08 55 50 45 98 59
XS3-510 5–10 6.40 11.22 0.17 125 444 57 466 1314
XS3-1015 10–15 3.34 7.03 0.14 44 145 50 70 176 529 165 1670
XS4-01 0–1 7.87 11.12 0.17 87 378 65 434 751
XS4-816.5 15–42 0.23 5.52 0.09 1 19 36 54 188 65 222 18
XS5-01 0–1 5.07 8.08 0.15 71 265 60 80 175 293 236 473
XS5-1215 30–38 0.14 0.53 0.12 44 27 47 112 104 101 268 29
XS6-01 0–1 6.01 10.62 0.18 74 236 63 438 402
XS6-15 1–5 6.09 10.24 0.19 77 404 67 523 828
XS6-510 5–10 4.36 7.59 0.11 86 150 58 216 421
XS6-513 12–33 0.20 1.19 0.07 48 33 56 132 110 134 223 33
XS6-1316 33–41 2.06 5.58 0.25 60 44 46 81 165
XS8-01 0–1 3.85 8.29 0.09 70 185 61 237 369
XS8-15 1–5 2.71 4.85 0.05 74 132 61 185 285
XS8-510 5–10 1.42 1.45 0.04 90 51 60 93 81
XS8-1015 10–15 1.48 4.53 0.04 130 53 50 79 67
XS8-612 15–30 1.42 3.90 0.06 75 54 52 108 73
XS8-1219.5 30–50 2.01 5.68 0.07 59 35 52 72 56
These analyses showed that only small amounts of metals in the soil can be easily
remobilized
In the next extraction step, which is designed to release metals bound to organic
matter, significant Cu, Ni, and Cr were removed, but only very small amounts of
Pb and Zn. Pb and Zn were found to be released dominantly in the carbonate step
or to remain in the residual fraction.
Because the low values of Pb and Zn in the organically bound fraction are
contrary to the results of the correlation analysis, which indicated that these metals
are strongly associated with organic C, we applied additional tests to this fraction.
The first three steps of the procedure were reapplied to 5 g each of two samples
with 100 mL of extractant solutions, with the objective of checking for any organic
carbon left in the sample after application of NaOH. For XS3-1015 organic C after
HEAVY METAL CONTAMINATION IN SOILS OF URBAN HIGHWAYS 303
TABLE III
ICP (meq 100 g
−1
)
Sample Results of ion exchange measurement
Zn Cd Pb Ni Mn Fe Cr Mg Al Ca Cu Na SUM
BH2–01 0.078 0.002 0.017 0.000 1.002 0.047 0.023 5.486 2.443 83.290 0.033 0.686 93.106
BH4–01 0.153 0.003 0.017 0.005 1.425 0.070 0.017 10.617 0.304 91.005 0.039 3.960 107.610
BH4–15 0.066 0.002 0.040 0.000 0.498 0.033 0.012 5.093 2.177 69.509 0.034 2.055 79.520
BH5–01 0.193 0.003 0.023 0.000 1.117 0.055 0.012 5.800 0.315 64.349 0.031 1.270 73.168
BH5–15 0.145 0.003 0.056 0.001 0.756 0.047 0.031 4.830 0.285 72.880 0.056 0.935 80.024
BH5–510 0.060 0.001 0.056 0.000 0.419 0.024 0.014 3.354 1.185 82.580 0.024 0.580 88.296
BH5–1015 0.078 0.002 0.030 0.015 0.354 0.063 0.010 3.763 5.392 88.037 0.042 1.099 98.869
BH9–1015 0.225 0.004 0.174 0.003 0.582 0.031 0.020 4.721 0.342 98.489 0.097 5.791 110.476
BH9–612 0.061 0.001 0.021 0.000 0.352 0.042 0.014 3.945 0.310 85.000 0.051 2.067 91.865
XS2–01 0.105 0.002 0.033 0.002 1.152 0.096 0.011 5.612 0.571 72.528 0.044 1.558 81.711
XS4–01 0.153 0.003 0.022 0.003 1.282 0.075 0.017 12.086 0.300 105.151 0.052 4.963 124.103
XS5–01 0.083 0.002 0.018 0.001 0.881 0.169 0.011 7.205 1.751 83.097 0.038 1.877 95.131
304 D. TURER ET AL.
TABLE IV
Results of sequential soil extraction process
Sample name KNO
3
H
2
ONaOHNa
2
EDTA HNO
3
Pb (%)
BH1-01 4.4 2.2 4.4 42.2 46.7
BH4-06-15 0.0 1.6 9.8 37.7 50.8
BH6-06-510 2.0 2.0 3.9 47.1 45.1
BH9-06-1015 0.5 1.5 7.7 39.8 50.5
XS3-08-1015 1.1 1.1 4.3 48.4 45.2
Ni (%)
BH1-01 5.7 2.9 20.0 14.3 57.1
BH4-06-15 6.7 2.2 17.8 13.3 60.0
BH6-06-510 2.9 2.9 17.1 17.1 60.0
BH9-06-1015 4.8 0.0 14.3 11.9 69.0
XS3-08-1015 0.0 0.0 20.6 14.7 64.7
Zn (%)
BH1-01 0.3 0.0 4.6 21.6 73.4
BH4-06-15 0.2 0.0 4.1 15.1 80.6
BH6-06-510 0.5 0.5 3.0 22.6 73.4
BH9-06-1015 0.4 0.0 6.0 22.4 71.2
XS3-08-1015 0.4 0.4 2.9 17.6 78.7
Cr (%)
BH1-01 3.0 3.0 15.2 6.1 72.7
BH4-06-15 3.1 3.1 9.4 12.5 71.9
BH6-06-510 8.6 2.9 31.4 5.7 51.4
BH9-06-1015 5.7 0.0 11.4 11.4 71.4
XS3-08-1015 4.5 0.0 9.1 9.1 77.3
Cu (%)
BH1-01 1.1 0.0 25.0 18.2 55.7
BH4-06-15 1.8 0.4 29.6 13.7 54.4
BH6-06-510 2.7 0.0 19.2 20.5 57.5
BH9-06-1015 2.1 0.5 39.9 16.1 41.5
XS3-08-1015 1.0 0.0 29.6 9.2 60.2
Cd (%)
BH1-01 0.0 0.0 0.0 50.0 50.0
BH4-06-15 0.0 0.0 33.3 33.3 33.3
BH6-06-510 0.0 0.0 0.0 0.0 100.0
BH9-06-1015 0.0 0.0 0.0 50.0 50.0
XS3-08-1015 0.0 0.0 0.0 100.0 0.0
HEAVY METAL CONTAMINATION IN SOILS OF URBAN HIGHWAYS 305
Figure 2a-c. Depth vs. Pb, Zn, and Cu.
the ‘organic removal step’ was 2.8%, compared to 3.3% found for the whole soil,
and for BH1-01 organic C was 2.3% after extraction, compared to 2.7% in the
original whole soil. Thus the organic matter in these roadside soils is dominated by
a component that is not extracted by conventional techniques.
306 D. TURER ET AL.
Figure 2d-e. Depth vs. Ni and Cr.
3.3. MINERALOGY
XRD patterns of soils taken from cores XS1 and BH4 have been studied to identify
the clay mineralogy and to check the vertical homogeneity of the soil columns in
terms of clay mineralogy. The results showed that clay mineralogy does not change
with depth. In air-dried samples we recognized a 10.1 Å illite peak and a 14.2 Å
peak, possibly chlorite. From the asymmetry of the 10.1 Å peak, it is also possible
to see the presence of some smectite (expandable) interlayering in the illite. When
glycolated, the 14.2 Å peak did not shift, confirming that it was chlorite. There
is also a 7.1 Å peak, interpreted as kaolinite because no change occurred after
glycolation and heating at 350
◦
C,butat550
◦
C the structure collapsed (Figure 5).
Following the methods of Biscaye (1965) and Johns and others (1954) for quantit-
ative analysis of clay minerals, 76% of the clay can be assigned to illite% (∼30%
of which is smectite mixed layering) and the remainder is chlorite and kaolinite.
No changes in these proportions were found with depth or with position relative to
the roadway.
HEAVY METAL CONTAMINATION IN SOILS OF URBAN HIGHWAYS 307
Figure 3a-c. Organic C vs. Pb, Zn, and Cu.
308 D. TURER ET AL.
Figure 3d-e. Organic C vs. Ni and Cr.
TABLE V
Average values for heavy metals in soils of United States
(Shacklette and others, 1984)
Pb Zn Cu Ni Cr
Average (ppm) 19 60 25 19 54
4. Discussion
4.1. C
OMPARISON TO PREVIOUS WORK
The heavy metal concentrations of Cincinnati highway soils are very high when
we compare them with the average background values reported for United States
soils (Shacklette and Boerngen, 1984) (Table V). The measured values, however,
are comparable to the ones reported in Wheeler and Rolfe (1979) and Teichmen
HEAVY METAL CONTAMINATION IN SOILS OF URBAN HIGHWAYS 309
Figure 4. Cluster analysis.
Figure 5. XRD pattern of XS1 taken from 1–5 cm depth.
310 D. TURER ET AL.
and others (1993) for roadside soils. Our results showed that these high levels of
heavy metals are not confined to surface soils, which is consistent with the findings
of Vandenabeele and Wood (1972). In fact the maximum measured amount of Pb
comes from a sample taken at 10–15 cm depth interval. We observed that heavy
metals seem to have a stronger relationship with organic C than with depth. The
ability of organic C to bind Pb was also reported in Gratani and others (1992). The
percent exchangeable metals in the soil samples was low (1.6–4.5% of Pb, 0.4–
8.3% of Zn, and 1.7–6.9% of Cu, depending on the exchange cation), similar to
values reported in Gibson and Farmer (1984) of 2% for Pb, 3% for Zn and 2% for
Cu.
4.2. S
IGNIFICANCE OF ORGANIC MATTER
The sequential extraction step for organic matter also produced low yields for Pb
and Zn, despite the good correlation of these two metals and total organic carbon
as determined by LECO. The discovery that the majority of the organic carbon is
not in fact extracted shows that much of this carbon is in a more refractory form
than is normal in uncontaminated soils. The two likely sources for this insoluble
organic matter are vehicle exhaust emissions (Kleeman et al., 2000) and asphalt
paving materials (Faure et al., 2000). The Pb and Zn, and to some extent the Cu,
in these roadside soils appears to be largely concentrated in this insoluble organic
fraction.
4.3. M
ASS BALANCE ESTIMATES
An important question for roadside soils is how much of the Pb present comes from
former gasoline additives and how much from metal parts of vehicles, which is a
continuing source. Using the event mean concentrations of heavy metals in the run-
off (Table I), which would represent the amount of heavy metal coming only from
metal parts of vehicles (at the time of measurement, 1995, Pb was not an additive
of gasoline in the U.S.), it is possible to estimate amounts of heavy metals coming
from these two sources individually. In our estimate of Pb coming from runoff, we
first calculated the amount of excess Pb in the soil. For this, weighted average Pb
values of all cores for the top 30 cm of the soil were calculated. To compare with the
runoff data from Sansalone and Buchberger (1997), the Pb amount was calculated
for a 15 × 20 m area (half the area of grass median along 15 m of the southbound
roadway). The excess amount of Pb in a 15 × 20 × 0.3 m volume of the soil was
calculated as 74 kg. The amount of Pb contamination in runoff, which is 68 µg
L
−1
, was obtained by taking the average of the five runoff events of Sansalone and
Buchberger (1997) (Table I). Knowing that the average rainfall in Cincinnati is
1.01 m yr
−1
, the amount of Pb contamination in runoff from a 15 m × 20 m area
of the southbound roadway, was calculated as 21 g yr
−1
which makes ∼0.7 kg for
the 34 yr that the highway has been in use. This value includes only the amount of
contamination coming from abrasion of brakes, tires of vehicles, etc. In calculation
HEAVY METAL CONTAMINATION IN SOILS OF URBAN HIGHWAYS 311
TABLE VI
Amount of metals in the runoff compared with soil
Pb Zn Cu Ni Cr
Amount of metal in the runoff (kg) 0.7 44.2 1.4 0.4 0.2
Excess amount of metal in the soil (kg) 74.0 33.0 18.0 2.0 6.0
Amount of metal coming from vehicle exhaust (kg) 172.0
of the amount of Pb coming from vehicle exhaust, we used 40 µgPb/m(Wardand
others, 1975) for years before 1970, and for the years after 1970 we used values
obtained from the equation
y = –1.93357E–03x
4
+ 6.55786E–01x
3
– 8.27184E+01x
2
+
4.59150EE+03x – 9.44234E+04
where x is the year and y is the average Pb exhausted, which is the best fit curve
to the available data, shown in Figure 6. The equation was derived by combining
information on amounts of national emissions of Pb from highway vehicles, ob-
tained from U.S. Department of Transportation, with the information from Ward
and others (1975). The aim in preparing this graph was to estimate the amount
of Pb coming from exhausts on a yearly basis during the time when the amount
of Pb in the gasoline has been decreasing. Using this approach the amount of
Pb coming from exhausts of the vehicles before 1990 was calculated as 172 kg.
These results showed that only a very small amount of Pb has been coming from
abrasion of vehicle parts and most of it should have been coming from the exhausts
of vehicles. Similar calculations have been also carried out for Zn, Cu, Ni and Cr
(Table VI). These metals are assumed to come only from body parts and tyres of
the vehicles. The amount of Zn in the runoff is higher than the amount measured
in the soil. This could be because of discharge of some of the runoff waters into
surface waters without any interaction with soil. The amounts of Cu, Ni and Cr
coming from runoff are, however, lower than the amounts measured in the soil. For
Ni and Cr, the reason for the excess soil metal is likely the large scatter in values
with depth, which makes background hard to estimate. For Cu, on the other hand,
the large excess in surface soils might suggest an additional source beyond surface
runoff from the pavement or that the amounts of Cu in the runoff were higher in
the past than the ones measured in 1995.
The mass balance calculations showed that ∼60% of Pb has been lost from the
study area. Ward and others (1975) also calculated excess Pb levels in soil and
amount of Pb emission from vehicles. Their calculations showed that ∼40% of Pb
was lost from the top 6 cm. The difference was attributed to removal of Pb by three
312 D. TURER ET AL.
Figure 6. Average Pb values exhausted from highway vehicles.
processes: (i) primary exhaust carried more than 250 m from the road; (ii) Sec-
ondary removal as wind-blown dust; (iii) Washing of particulates and leaching of
soluble Pb to depth greater than 6 cm. The last process, however, was discounted
because background levels in their study were reached at depths of only a few
centimeters. Wheeler and Rolfe (1979), estimated loss of Pb from the top 10 cm as
72–76%. In contrast to Ward and others, they suggested leaching as an important
process in removal of Pb from surface soils. From our data, we can also eliminate
downward leaching as a source of Pb loss because of low exchangeability of Pb
and other heavy metals. Lateral transport for longer distances than our 20 m is
possible, but the rapid fall-off with distance reported by other workers suggests
that this effect may be relatively minor. Secondary removal as wind-blown dust
is the most likely of the three explanations proposed by Ward and others (1975).
Another possibility is surface run-off carrying the metals into surface drainages,
bypassing the soil.
Either of these last two possibilities points to potential health hazards. A likely
health problem for maintenance and construction workers along these highways
exists from wind-blown dust. Disruption of these soils during highway mainten-
ance, including mowing, and excavation for resurfacing, will cause suspension of
these heavily contaminated soils as small dust particles in the air. Breathing these
particles could be potentially harmful to the human body. Secondly, discharge of
metal-laden water to surface drainage could lead to elevated metal contents in water
supplies.
HEAVY METAL CONTAMINATION IN SOILS OF URBAN HIGHWAYS 313
5. Conclusions
Heavy metal contamination in soils taken from along I-75, Cincinnati, Ohio, is very
high in the top 15 cm when compared with background values. The contamination
decreases as depth increases and it increases as the amount of organic C increases in
the soil. The relationship between amount of contamination and amount of organic
C is stronger than the one with depth. Because of low amounts of swelling clay in
the soil, in this particular case, clay mineralogy is not important in the binding of
the heavy metals, whereas the positive correlation of metals with organic carbon
indicates that much of the metal is bound to organic matter. Sequential extraction
measurements showed that the great majority of the heavy metal content is immob-
ile, and that much of the immobile fraction is associated with insoluble organic
matter, probably of anthropogenic origin. Because highway environments are a
relatively constant source of anthropogenic organic matter as well as heavy metals,
these metals will continue to remain bound to this insoluble organic matter in-situ
unless the soils are remobilized mechanically. Removal of these heavy metals as
wind-blown dust is the most likely remobilization mechanism. Another possibility
is surface run-off carrying the metals into surface drainages, bypassing the soil.
Mass balance calculations showed that the Pb found in the soil mostly came from
vehicle exhaust when leaded gasoline was in use. For those countries still using
leaded gasoline, this result shows that important reductions in Pb contamination of
soils can be achieved by restricting the use of Pb additives.
Acknowledgement
The authors would like to thank to Dr. Warren Huff (University of Cincinnati, De-
partment of Geology) for his helpful comments and to Dr. Jodi Shann (University
of Cincinnati, Department of Biological Sciences) for her help in AAS analysis.
Thanks are also extended to Indiana University for letting us use their facilities for
carbon analysis. The sampling process of this study was supported by the Ohio
Department of Transportation.
References
Albasel, N. and Cottenie, A.: 1985, Water, Air, and Soil Pollut. 24, 103.
Biscaye, P. E.: 1965, Geological Society of America Bulletin 76, 803.
Climate Diagnostic Center: 1999,
/>EPA: 1999, />Faure, P., Landais, P., Schlepp, L. and Michels, R.: 2000, Environmental Science and Technology 34,
1174.
Gibson, M. J. and Farmer, J. G.: 1984, The Science of the Total Environment 33, 49.
Gratani, L., Taglioni, S. and Crescente, M. F.: 1992, Chemosphere 24, 941.
314 D. TURER ET AL.
Hamilton, R. S., Revitt, D. M. and Warren, R. S.: 1984, The Science of the Total Environment 33, 59.
Hewitt, C. N. and Candy, G. B. B.: 1990, Environmental Pollution 63, 129.
Johns, W. D., Bradley, W. F. and Grim, R. E.: 1954, Journal of Sedimentary Petrology 24, 242.
Kleeman, M. J., Schauer, J. J. and Cass, G. R.: 2000, Environmental Science and Technology 34,
1132.
ODOT: 1999, />Onyari, J. M., Wandiga, S. O., Njenga, G. K. and Nyatebe, J. O.: 1991, Bull. Environ. Contam.
Toxicol. 46, 782.
Sansalone, J. and Buchberger, S. G.: 1997, ASCE Journal of Environmental Engineering 123, 134.
Sansalone, J. J., Koran, J., Smithson, J. and Buchberger, S.: 1998, ASCE Journal of Environmental
Engineering 124, 427.
Shacklette, H. T. and Boerngen, J. G.: 1984, Element Concentrations in Soils and Other Surficial
Materials of the Conterminous United States. U. S. Geological Survey Professional Paper 1270,
105 p.
Sposito, G., Lund, L. J. and Chang, A. C.: 1982, Soil Science Society of America Journal 46, 260.
Tessier, A., Campbell, P. G. C. and Bisson, M.: 1979, Analytical Chemistry 51, 844.
Teichman, J., Coltrin, D., Prouty, K. and Bir, W. A.: 1993, American Industrial Hygiene Association
Journal 54, 557.
Ulmschneider, R.: 1977, Exchangeable Cations and Paleosalinity: A Test Using Late Paleozoic
Sediments of the Appalachian Basin. M.S. Thesis, University of Cincinnati, 118 p.
U.S. Department of Transportation: 1999, />Vandenabeele, W. J. and Wood, O. L.: 1972, Chemosphere 5, 221.
Ward, N. I., Reeves, R. D. and Brooks, R. R.: 1975, Environmental Pollution 9, 243.
Wheeler, G. L. and Rolfe, G. L.: 1979, Environmental Pollution 18, 117.