CFD model of air movement in ventilated façade: comparison between natural and forced air flow
Bạn đang xem bản rút gọn của tài liệu. Xem và tải ngay bản đầy đủ của tài liệu tại đây (1.32 MB, 12 trang )
INTERNATIONAL JOURNAL OF
ENERGY AND ENVIRONMENT
Volume 4, Issue 3, 2013 pp.357-368
Journal homepage: www.IJEE.IEEFoundation.org
CFD model of air movement in ventilated faỗade:
comparison between natural and forced air flow
Miguel Mora Pérez, Gonzalo López Patiđo, P. Amparo López Jiménez
Hydraulic and Environmental Engineering Department, Universitat Politècnica de Valencia, Spain.
Abstract
This study describes computational fluid dynamics (CFD) modeling of ventilated faỗade. Ventilated
faỗades are normal faỗade but it has an extra channel between the concrete wall and the (double skin)
faỗade. Several studies found in the literature are carried out with CFD simulations about the behavior of
the thermodynamic phenomena of the double skin faỗades systems. These studies conclude that the
presence of the air gap in the ventilated faỗade affects the temperature in the building skin, causing a
cooling effect, at least in low-rise buildings. One of the most important factors affecting the thermal
effects of ventilated faỗades is the wind velocity. In this contribution, a CFD analysis applied on two
different velocity assumptions for air movement in the air gap of a ventilated faỗade is presented. A
comparison is proposed considering natural wind induced velocity with forced fan induced velocity in
the gap. Finally, comparing temperatures in the building skin, the differences between both solutions are
described determining that, related to the considered boundary conditions, there is a maximum height in
which the thermal effect of the induced flow is significantly observed.
Copyright © 2013 International Energy and Environment Foundation - All rights reserved.
Keywords: Ventilated Faỗade; Natural ventilation; Computational Fluid Dynamics (CFD); Architectural
design; Wind energy.
1. Introduction
Nowadays new strategies in buildings are investigated by architects and engineers to improve the
buildings energy performance. Designers commitment to green buildings should involve both, new
sustainable buildings design and rehabilitation in the existing ones by installing new systems to make day
to day operations more energy efficient and environmentally sensitive.
The envelope of a building is the main element responsible for its energy demand. The building skin
ought to be a very susceptible part to be modified to improve the whole building energy performance. In
this sense, the use of ventilated faỗades can often have a positive contribution to this objective. The
implementation of ventilated faỗades in buildings has been an object of broad applications especially in
recent years. Ventilated faỗades are a powerful tool when applied to building design, especially in
bioclimatic building design. In some countries with high levels of solar radiation, summer over-heating is
a big problem in building energy balances.
A ventilated faỗade is a double envelope composed of two skins and a ventilated cavity air gap located
between them. Ventilated faỗade and wall coverings were developed to protect buildings against the
combined action of rain and wind by counterbalancing the effects of water beating on walls and keeping
the building dry, with high-level aesthetic characteristics and good heat insulation and soundproofing.
ISSN 2076-2895 (Print), ISSN 2076-2909 (Online) ©2013 International Energy & Environment Foundation. All rights reserved.
358
International Journal of Energy and Environment (IJEE), Volume 4, Issue 3, 2013, pp.357-368
The ventilated faỗade consist of and external skin made of glass, marble, ceramic, etc. panels anchored in
a sub-structure (generally made of aluminum profiles) to the external wall surface of the building. This
first layer defines the visual appearance of the building. The next layer is an opened air gap with a
minimum of 3 cm. The role of this layer is to prevent heat getting into the building in summer and take
moisture out of the building. In this ventilated gap the aluminum substructure which supports the
external layer must be properly installed in order to not avoid natural ventilation effect. Finally, the
external buildings face, made of rigid and properly bonded thermal insulation material. This layer must
resist tearing and dispersion of the material due to any stronger air flow in the ventilated layer.
The ventilated faỗade must achieve some basic requirements in both summer and winter conditions: air
permeability to reduce heat dispersion in winter and guarantee passive cooling effect by combining
convective and heat transport between the outer and inner walls in summer; watertight to guarantee no
water infiltration due to rain, humidity and no condensation on the surface into the wall mass. Finally,
thermal performance to guarantee the indoor thermal comfort is also important, as a good ventilated
faỗade has many energy implications, Balocco [1].
As designer, building owners and architects look for solutions to fulfill the requirements of energy
efficiency good practice. Alternatives as Computational Simulations should be provided to meet their
short-term needs. Significant research has been carried out to provide methods for building designers to
examine the energy implications of their design decisions. There are currently many different modeling
approaches used in predicting building ventilation including analytical models, empirical models, multizone models, zonal models, experimental models and computational fluid dynamics (CFD) models [2].
The use of CFD in particular has risen since 2002. The wide applicability, acceptability of CFD as a
ventilation modeling tool is however tied to its concurrent use with theoretical and experimental models
as verification and validation of available codes become increasingly important [3].
These improvements are related with the ventilation capacity of the additional structure to the shield
mainly for saving cooling power in summer in warm countries. It deals with natural ventilation. Natural
ventilation can be explained by two phenomena: wind driven ventilation and buoyancy-driven
ventilation. While wind is the main mechanism of wind driven ventilation, buoyancy-driven ventilation
occurs as a result of the directional buoyancy force that results from temperature differences between the
interior and exterior [4]. This effect is due to convection produced in the air gap of the faỗade,
Kokogiannakis and Strachan [5]; Gang, [6]. This convection depends on the air movement inside the gap
and the heat transmission in this motion, Manz [7]; Yilmaz [8].
Previous studies performed by Ciampi et al. [9] showed that one of the more affecting factors to increase
the efficiency of the faỗade is the external air temperature. The presence of ventilated faỗade in a
building leads to a cooling effect in the skin of this building due to the action of the air movement in the
gap as demonstrated in many references. [10, 11]. In summer conditions the energy savings will increase
remarkably as solar radiation increases: the bigger the solar radiation is, the more efficient ventilated
faỗades turn to be from an energy point of view. The cooling capacity would be increased due to the
convective effect of the air movement which will increase the speed of the air circulating inside the
faỗade. This aspect has been also simulated with the current CFD analysis by López et al [10].
The principal objective of the ventilated faỗade is to provide the building with a double-skinned interface
to reduce the impact of incident radiation on the indoor environment. The additional skin reduces the
faỗade temperature in two ways: it shades the original faỗade and it reduces its temperature by natural
ventilation flows. The proposed paper aims to quantify the action of accelerating the air flow in a forced
way. The proposed method allows an assessment of the thermal potential of ventilated faỗade and its
capacity for cooling. These quantities are mathematically modeled by CFD techniques. CFD is used to
quantify and compare the effect of natural and forced ventilation in a buildings faỗade.
2. Methodology
2.1 General objective
A system to improve the cooling capacity of ventilated faỗade is analyzed in this paper. The objective is
the quantification of the improvement in the efficiency of thermal behavior of buildings when this sort of
system is installed in a ventilated faỗade, especially in summer conditions. The system aims to accelerate
the natural air flow in the ventilated gap in a forced way.
In this contribution, a comparative analysis of natural and forced velocity in the ventilated air gap is
presented. Two cases are compared. The cooling effect of ventilated faỗade is dependent on the air
velocity. The analysis of the temperature in the external face of the building wall with the presence of the
ISSN 2076-2895 (Print), ISSN 2076-2909 (Online) ©2013 International Energy & Environment Foundation. All rights reserved.
International Journal of Energy and Environment (IJEE), Volume 4, Issue 3, 2013, pp.357-368
359
exterior ventilated faỗade in different conditions is done. The most important parameter to be analyzed
and compared is the presence of vertical forced velocity in the air gap.
2.2 CFD solver applied to air movement in the ventilated faỗade gap
The here depicted methodology is a systematic investigation with Computational Fluid Dynamics and its
application research in building systems. The literature is profuse in documents based on research
applications of CFD, including experimental validations. Wang [11] modeled and validated the impacts
of ventilation strategies and facade on indoor thermal environment for naturally ventilated residential
buildings. Omar [12] compared CFD and Network models for predicting wind behavior in buildings. The
results of the experiment supported the use of CFD for predicting wind performance in buildings.
Furthermore, Omar [12] recommended CFD as a reliable method to study systems that have no access to
laboratory or full-scale testing facilities.
Compared to other references like Wang [11] and Omar [12], who contrasted the results of the CFD
simulation with real experimental results; this contribution assumes that CFD simulations are right to
represent the fluid behavior. CFD is used as a design tool as Kang [13] used the methodology to improve
natural ventilation in a large factory building. A numerical verification is made to check that the model is
correct as well. CFD allows designers to obtain comparative results to take better design decisions of
different faỗade configurations.
CFD enables designers to optimize their constructive solutions by simulation techniques and not by
expensive trial-and-error methodologies, which is one of the most important advantages of computational
models. In this methodology, CFD allows designers to try particular solutions in real scale models. CFD
as design technique represents lower costs in terms of time and resources. It allows designers to have a
general idea about the new system performance to predict whether it will work as expected or not. If the
system works as expected, further studies should be done including additional simulations and
experimental validation cases.
3. Mathematical model of the faỗade
Computational fluid dynamics (CFD) research uses computational and mathematical models of flowing
fluids to describe and predict fluid response in problems of interest, such as the flow of air around a
building. CFD is presented as an efficient, costless-effective tool for predicting systems response under a
broad range of operating conditions. The advantage of using these models lies in the fact that they can
reproduce real problems of Fluid Mechanics to any degree of complexity. Furthermore, they can
visualize hydrodynamic aspects impossible to measure or represent in a real case (i.e. velocity stream
lines) that have great importance in the comprehension of the studied phenomena.
The mathematical model is composed by a geometry where mass and momentum conservation equations
are solved by the code. The geometry model is designed to work on three-dimensional meshes. The
volume mesh in a simulation is the mathematical description of the space (or geometry) of the problem
being solved.
The computational model solves numerically the governing laws of Fluid Dynamics. These equations,
taking into account turbulent phenomena, are solved in a geometrical domain, given a number of suitable
boundary conditions. In CFD the relevant velocity, pressure and temperature fields are calculated in a
discrete manner at the nodes of a certain mesh or grid and they are represented along the mesh. The
continuity or mass conservation equation solved by the software used is expression (1).
∂ρ
+ ∇ρv = S m
∂t
(1)
where ρ is the fluid density, v is velocity and Sm represents the mass source contained in the control
volume. Also, the momentum equation is considered by equation (2).
∂ ( ρv )
+ ∇ρ (v v ) = −∇p + ∇τ + ρg + F
∂t
(2)
ISSN 2076-2895 (Print), ISSN 2076-2909 (Online) ©2013 International Energy & Environment Foundation. All rights reserved.
International Journal of Energy and Environment (IJEE), Volume 4, Issue 3, 2013, pp.357-368
360
where p is the static pressure, τ the stress tensor defined in expression (3) and the gravitational (g) and
outer forces (F) defined on the control volume, respectively. In (3) µ is the eddy viscosity and I is the
unit tensor. The third term accounts for the effect of the expansion of volume.
τ = µ ⎢(∇v + ∇v T ) − ∇v I ⎥
3
⎣
⎦
⎡
2
⎤
(3)
All conditions and properties are defined via STAR-CCM+ and solved using the coupled solver. The
results are displayed via available post-processing tools.
3.1 Geometry
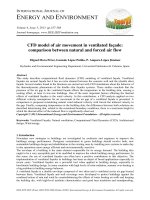
In this particular case, a faỗade is modeled in order to obtain the velocities profiles in the air gap and the
temperature distribution across the air and the external building faces. The geometry modeled is a
simplification of a ventilated faỗade in a building exposed to wind. The width of the control volume
simulated consists of two half pieces which made the external ventilated faỗade layer and the narrow
cavity between them (1.002 m. width). The height of the control volume is the wind tunnel height (9 m.).
The depth of the control volume is made by the whole building shape inside the wind tunnel (11.5 m.).
The building is 7.026 m. high and 6 m. deep. The air gap is 40 mm thick. Some details of the air gap and
the dimensions of the building model are shown in Figure 1.
Figure 1. Building and panel dimensions (mm.)
3.2 Boundary conditions and physics
The CFD analysis performed includes steady state. Segregated flow for model is used. The gravity model
is used as it permits the inclusion of the buoyancy source terms in the momentum equations when using
the segregated flow model. K-Epsilon turbulence model is used for representing turbulence.
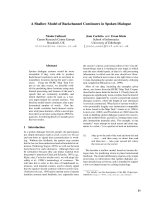
The entire domain is defined as a single fluid region (air). A region is a volume domain in space defined
by boundaries. A boundary is each surface that surrounds and defines a region in the model. Each
boundary has its own properties, defined in Table 1. Figure 2 shows the region modeled and the
boundary conditions defined in the model. Three symmetry planes are defined as a boundary conditions
(both laterals and the top of the wind tunnel), velocity inlet in front of the principal ventilated faỗade,
mass flow outlet at the end of the wind tunnel and simple walls (ceramic panels and building faces). The
ceramic panels and the building faces are defined with a roughness height. The roughness height is set
2.5·10-7 m.
ISSN 2076-2895 (Print), ISSN 2076-2909 (Online) ©2013 International Energy & Environment Foundation. All rights reserved.
International Journal of Energy and Environment (IJEE), Volume 4, Issue 3, 2013, pp.357-368
361
Table 1. Boundary conditions specifications
Type
Velocity Inlet
Mass flow outlet
Symmetry Plane
Wall
Wall
Surface (Wind tunnel)
The front face
The back face
The upper and lateral faces
Bottom face
All building and faỗade faces
Properties
Velocity module and direction (0.5 m/s)
By default
By default
By default
Roughness height = 2.5·10-7 m.
Figure 2. Boundary conditions for CFD model
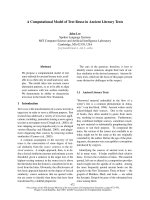
3.3 CFD mesh and convergence
The numerical method is solved by the finite volume technique. The solution to a flow problem is solved
by calculating the flow-equations on the nodes within the cells. The accuracy of the result depends on the
definition of the nodes. The definition of a good mesh is crucial to find the optimum between the
smallest number of nodes and the accuracy of the results. Finally, the mesh for the volume control used
has the following characteristics: 443,568 items; 1,289,740 internal faces and 535,984 vertices (Figure
3). The roof of the building is meshed with a boundary layer mesh.
Figure 3. Detail of the volume control mesh for CFD model
ISSN 2076-2895 (Print), ISSN 2076-2909 (Online) ©2013 International Energy & Environment Foundation. All rights reserved.
362
International Journal of Energy and Environment (IJEE), Volume 4, Issue 3, 2013, pp.357-368
Once the volume is discretized in the mesh, the numerical models for the representation are chosen. 3D
steady state model is implemented, with constant density fluid flow and second order segregated flow.
Wall treatment is necessary for modeling up proper boundary conditions for turbulence. In this case the
wall treatment used is the high-y+. The high-y+ wall treatment implies the wall-function-type approach
in which it is assumed that the near-wall cell lies within the logarithmic region of the boundary layer. It
is suitable for use with models that do not explicitly damp the turbulence in the near-wall region. While a
good rule of thumb is that the wall-cell centroid should be situated in the logarithmic region of the
boundary layer (y+>30) [14], as in the present cases. Correct values of y+ allows a proper assessment of
the mesh. In this case, this requirement was accomplished for all walls.
When the mesh has been completed, a grid-independence study, including the number of nodes and the
size of the enlarged domain was performed in order to ensure the validity of the numerical computational
procedure.
3.4 Simplifications assumed
Several simplifications are assumed to reduce the computational time. The simplifications are indicated
below.
a) The study is focused on the air gap between the inner and outer panels, for that reason it has been
considered the same temperature in the outside environment and in the faỗade surface in contact with
the same.
b) The capacity of the ceramic panel of the faỗade to accumulate heat energy is not taken into account
when calculating the heat transfer through the inner sheet.
c) The modeling is considered steady. The temperature boundary conditions are specially chosen to
benefit the additional cooling effect of the ventilated faỗade. Real conditions in summer
Mediterranean climates are assumed, measured in laboratory conditions for real ventilated faỗade
panels.
d) Steady sunlight action is considered for the outer ceramic panel.
4. Results and post-processing
As mentioned, two different cases are compared to quantify the energy improvement of the systems
designed. The models nomenclature is:
• Case (a) Building with ventilated faỗade: wind forced velocity for the air in the gap.
ã Case (b) Building with ventilated faỗade and additional vertical forced velocity in the air gap by fans.
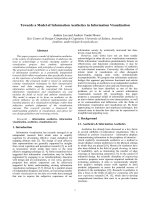
The control volume studied is defined by the internal ventilated faỗade panel, the narrow ventilated
cavity and the buildings external wall. Figure 4 shows the control volume definition. This control volume
is especially chosen to determine the temperature effect of the air flow through the cavity in the building
external wall. However, the model is composed of more elements to properly simulate the air entrance in
the ventilated cavity.
Figure 4 shows nomenclature of temperatures. External conditions make the temperature of the interior
ventilated faỗade panel (T1) to be 35 ºC (308ºK). The temperature of external air Tair has been set 30ªC
(303ºK). With these considerations, the temperature of the buildings external wall (T2) is then calculated,
considering all the thermal and fluid dynamics effects in the cavity.
The CFD model simulates the air velocity in the gap depending on the exterior wind around the building
and taking into account all the hydrodynamic effects: the narrow apertures of the ventilated faỗade, the
friction forces, the wind driven flows, the buoyancy natural ventilation, gravity, etc. Velocity and
temperature T2 are solved among other magnitudes.
4.1 Case (a) Building with ventilated faỗade. Natural ventilation
The first CFD simulation is set with the boundary conditions defined in Section 3.2. To represent
velocity vectors it is necessary to define planes in the fluid region. Figure 5a shows velocity vectors in a
parallel plane defined in the centre of the ventilated gap in the faỗade. Figure 5b shows velocity vectors
in a perpendicular plane. It is observed that the velocity in the air gap is progressively being accelerated
as wind flow inside on it. Figure 5a shows that the velocity in the bottom of the faỗade is very low (less
than 0.3 m/s).
Temperature of the internal side of the faỗade panel is considered as constant value: T1=308K. Due to
the wind incidence on the faỗade, the building external wall decreases its temperature. Figure 6 shows
both, the internal wall of the ventilated panel and the external wall of the building. The color bar allows
ISSN 2076-2895 (Print), ISSN 2076-2909 (Online) ©2013 International Energy & Environment Foundation. All rights reserved.
International Journal of Energy and Environment (IJEE), Volume 4, Issue 3, 2013, pp.357-368
363
to observe that the temperature has been decreased in the external building faỗade (T2305.5K, green
color) respect the internal panel face (T1=308ºK, red color).
Figure 4. Control volume and temperatures definition
(a) YX plane in the ventilated air gap
(b) ZY plane
Figure 5. Air velocity vector detail
4.2 Case (b) Ventilated faỗade with forced vertical velocity
The second CFD simulation is performed by adding a new boundary condition to the previous model.
This boundary condition is set in the bottom face of the ventilated cavity. The boundary simulates a
forced vertical velocity. The forced vertical velocity is set vz=0.3 m/s. The temperature of this forced air
has been set 30oC equal to external temperature, Tair (303ºK). Figure 7 shows bottom area in which the
new velocity boundary condition is set.
4.3 Case (a) and (b) comparison
The objective is the comparison of the temperature in the external face of the building in both cases, a
and b. The mentioned difference is that in case (b) an additional forced velocity is set in the bottom of the
ventilated gap. Therefore a new boundary condition is set to simulate the additional forced velocity in the
ventilated cavity.
Velocity inside the gap is shown for both cases velocity control line visualized in Figure 8. Velocity is
presented in a line since the centre of the ventilated panel. Figure 8 shows that the air velocity in the
ventilated gap has been increased for the whole height. Case (b) as has an induced flow, presents more
velocity along the whole simulated height.
Figure 9 indicates the external building face temperature. It can be clearly observed the temperature
difference in the lower building floors (T2). As the air flow in the cavity rises, this temperature reduction
in the building external faỗade is progressively being lost (Figure 8b).
Therefore, it indicates that there is a limit on the height where the initial forced air has thermal effect for
those boundary conditions. To propose a quantification of this effect, the Influenced Height (HI) is
ISSN 2076-2895 (Print), ISSN 2076-2909 (Online) ©2013 International Energy & Environment Foundation. All rights reserved.
364
International Journal of Energy and Environment (IJEE), Volume 4, Issue 3, 2013, pp.357-368
defined, this is the height in which the temperature difference respect of the largest temperature
difference achieved between cases is less than 10%. This is the maximum height in the building in which
the thermal effect of the forced velocity will be significant (10% variation).
Zones represented:
- Building external
face temperature
- Panel internal
face temperature
- YX Vector plane
in ventilated gap
- ZY Vector plane
Figure 6. Temperature and velocity vectors detail case (a)
Figure 7. New velocity inlet boundary condition
ISSN 2076-2895 (Print), ISSN 2076-2909 (Online) ©2013 International Energy & Environment Foundation. All rights reserved.
International Journal of Energy and Environment (IJEE), Volume 4, Issue 3, 2013, pp.357-368
365
Figure 8. Velocity calculated in the centre of the ventilated cavity
(a) Case (a)
(b) Case (b)
Figure 9. External building face temperature comparison
The temperature control line shown in Figure 10 is a projected line since the centre of the ventilated
panel on the external buildings face. Figure 10 depicts that the temperature effect is really reduced with
height. This reduction depends on the initial air temperature and velocity set. Consequently, the height
limit where the initial forced air has no thermal effect depends on the initial forced air temperature and
velocity.
ISSN 2076-2895 (Print), ISSN 2076-2909 (Online) ©2013 International Energy & Environment Foundation. All rights reserved.
366
International Journal of Energy and Environment (IJEE), Volume 4, Issue 3, 2013, pp.357-368
To determine the height limit it is necessary to set a temperature difference reference (TA0-TB0) maximum
in the base of the building. This reference must be the largest temperature difference achieved between
both cases which should correspond with the temperature difference determined at a lower height. Then,
expression (4) is used to determine the temperature difference variability with height. Finally, an
exponential equation is used to set the equation linking temperature difference percentage and height
shown in Figure 11.
10=x=
TA − TB
·100
TA0 − TB 0
(4)
Expression (5) determines the limit height where the temperature difference is less than 10%. For this
particular case, the limit height is 4.7 m.
h= 35.2· x −0.901 = 35,2·10 −0.901 = 4.7 m
(5)
According to this over this height the additional forced ventilation has no meaning thermal variation
effect on the faỗade.
Figure 10. Temperature T2 calculated in the external face of the building
Figure 11. Temperature difference (%) vs height (m)
ISSN 2076-2895 (Print), ISSN 2076-2909 (Online) ©2013 International Energy & Environment Foundation. All rights reserved.
International Journal of Energy and Environment (IJEE), Volume 4, Issue 3, 2013, pp.357-368
367
5. Conclusion
Quantification of the ventilated faỗade effect in a building is a complex phenomenon. In the present
contribution a strategy to quantify this effect is proposed under certain conditions making use of the
computational fluid dynamics modeling. Two simplified CFD models for the ventilated faỗade have been
presented. These simple simulations are useful to investigate the ventilated faỗade behavior and the ways
to improve it. A system which aims to accelerate the natural air flow in the ventilated gap in a forced way
has been analyzed to improve the cooling capacity of ventilated faỗade in summer conditions. Results of
both cases are compared to determine the effect on wall temperatures of installing the additional system
in the initial model. Some conclusions can be achieved:
• The velocity of the air in the faỗades air gap is crucial for the heat interchange.
• This velocity is strongly related to the temperature conditions, as it is wind and advective forced.
• When this velocity is additionally forced, the efficiency of the ventilated faỗade increases depending
on the ventilation action.
Is therefore clear that the model requires a more complex mathematical modeling to integrate the heat
transfer phenomena on the solid wall and the panels. In this paper the strong influence of velocity on
thermal effect is demonstrated and quantified by means of the defined Influenced Head. There are many
parameters affecting the efficiency of the whole installation: the separation between the panels,
temperature and air velocity of incoming solar radiation and temperatures of solid elements, the heat
transfer coefficients of the solid elements, etc. However, this computer modeling can be used to perform
a simple sensitivity analysis by varying these parameters. Nowadays, with current computing
capabilities, the optimum operating solutions can be estimated, especially when in future the
phenomenon of radiation in the solid parts of wall and can be incorporated and tested to integrate nonpermanent thermal inertia.
References
[1] Balocco, C. A simple model to study ventilated faỗades energy performance. Energy and
Buildings, Vol 34, N 4. Pp 469-475. 2002.
[2] Chen Q. Ventilation performance prediction for buildings: a method overview and recent
applications. Building Environ 2009;44(4):848e58.
[3] Li Y, Nielsen PV. CFD and ventilation research. Indoor Air 2011;21(6):442e53.
[4] Linden, P.F. The Fluid Mechanics of Natural Ventilation. Annual Review of Fluid Mechanics
2009. 201-208.
[5] Kokogiannakis, G.; Strachan, P. Modelling of double ventilated faỗades according to the CEN
Standard 13790 method and detailed simulation. 547 2nd PALENC Conference and 28th AIVC
Conference on Building Low Energy Cooling and Advanced Ventilation Technologies in the 21st
Century. Crete island, Greece. 2007.
[6] Gang, G. A parametric study of Tromble walls for passive cooling of buildings, Energy and
Buildings, Vol 27, N 1. Pp 37-43. 1998.
[7] Manz, H. Numerical simulation of heat transfer by natural convection in cavities on faỗade
elements. Energy and Buildings 2003, Vol 35, N 3. Pp 305-311.
[8] Yilmaz, Z. Evaluation of energy efficient design strategies for different climatic zones:
Comparison of thermal performance of buildings in temperate-humid and hot-dry climate. Energy
and Buildings 2007, Vol 39, N 3. Pp 306-316.
[9] Ciampi, M.; Leccese, F.; Tuoni, G. Ventilated faỗades energy performance in summer cooling of
buildings. Solar Energy N. 75 - 2003. Pp 491–502.
[10] López P.A.; Mora-Pộrez M.; Lúpez G.; Bengochea M.A. Model of ventilated faỗade in buildings
by using CFD techniques. Boletín de la Sociedad Espola de Cerámica y Vidrio, Vol 50 – 2011.
99-108.
[11] Wang L., Wong N. H. The impacts of ventilation strategies and facade on indoor thermal
environment for naturally ventilated residential buildings in Singapore. Building and Environment
42 (2007) 4006–4015.
[12] Omar S. A., Mohamed B. G. A comparison between CFD and Network models for predicting
wind-driven ventilation in buildings. Building and Environment 42-2007. 4079–4085.
[13] Jong-Hoon Kang, Sang-Joon Lee. Improvement of natural ventilation in a large factory building
using a louver ventilator. Building and Environment 43-2008. 2132–2141.
ISSN 2076-2895 (Print), ISSN 2076-2909 (Online) ©2013 International Energy & Environment Foundation. All rights reserved.
368
International Journal of Energy and Environment (IJEE), Volume 4, Issue 3, 2013, pp.357-368
[14] CD-Adapco Star CCM+ User’s Manual.
Miguel Mora Pérez M.Sc.in Industrial Engineering, Master in Energy Technology for Sustainable
Development and Research Engineer in the Department of Hydraulic Engineering (Universidad
Politécnica de Valencia). He is currently researcher at Universitat Politècnica de València in the E3
project in subjects related to sustainability in buildings. This project is cofounded by the National
Government of Spain.
Gonzalo López Patiño is Industrial Engineer, Assistant Professor in the Hydraulic and Environmental
Engineering Department at the Universidad Politécnica de Valencia. He is currently Director of the
Master Programme in Construction and Industrial Facilities at Universitat Politècnica de València. He
has more than a decade of experience in modelling building and urban facilities, especially in fluids
applications (air, water and other industrial flows) and actually he has focused his researches in
sustainable applications on building constructions.
P. Amparo López Jiménez M.Sc. and PhD in Industrial Engineering, Associate Professor in the
Hydraulic and Environmental Engineering Department at the Universidad Politécnica de Valencia. She
is currently the Associate Director of the Hydraulic and Environmental Engineering Department of
Universitat Politècnica de València. She has more than a decade of experience in research and teaching
in Engineering fields, always related to hydraulic topics. She is author and editor of several publications
about Hydraulic an Environmental Engineering and Flow Dynamics. She has participated in national
and international R&D projects and co-organized International Seminars and Networks. She is an
experienced University Teacher, an active researcher and a former practicing engineer.
ISSN 2076-2895 (Print), ISSN 2076-2909 (Online) ©2013 International Energy & Environment Foundation. All rights reserved.