Báo cáo khoa học: Quantitative modeling of triacylglycerol homeostasis in yeast – metabolic requirement for lipolysis to promote membrane lipid synthesis and cellular growth potx
Bạn đang xem bản rút gọn của tài liệu. Xem và tải ngay bản đầy đủ của tài liệu tại đây (469.2 KB, 12 trang )
Quantitative modeling of triacylglycerol homeostasis in
yeast – metabolic requirement for lipolysis to promote
membrane lipid synthesis and cellular growth
Ju
¨
rgen Zanghellini
1,
*, Klaus Natter
2,
*, Christian Jungreuthmayer
3
, Armin Thalhammer
1
, Christoph
F. Kurat
2
, Gabriela Gogg-Fassolter
2
, Sepp D. Kohlwein
2
and Hans-Hennig von Gru
¨
nberg
1
1 Institute of Chemistry, University of Graz, Austria
2 Institute of Molecular Biosciences, University of Graz, Austria
3 Trinity Center of Bioengineering, Trinity College Dublin, Ireland
Triacylglycerols (TAG) are important storage com-
pounds in pro- and eukaryotes. Not only do these
lipids store chemical energy in the form of fatty acids
(FA), they also serve to dispose of excess free FA from
the cellular milieu, thus precluding FA-induced toxicity
[1,2]. Neutral fats, which in yeast consist of TAG and
steryl esters (SE), are stockpiled in lipid droplets (LD)
during periods of cellular growth [3]. In times of star-
vation, esterified FA is then released by lipolysis and
recycled into other lipids, or degraded via b-oxidation
in order to provide the metabolic energy for cellular
maintenance [4].
Recent data have shown that TAG pools in yeast
are filled when growth ceases as a result of carbon
source (typically glucose) limitation, and cells enter
stationary phase [5]. TAG degradation during station-
ary phase occurs rather slowly and the specific activi-
ties involved have not yet been identified clearly.
Surprisingly, on glucose supplementation, quiescent
cells rapidly initiate TAG degradation at a high rate
when they re-enter the cell cycle [5]. Accordingly, tgl3
tgl4 mutants lacking the ability to hydrolyze TAG
show severe growth retardation. These observations
indicate that TAG degradation is an important
Keywords
dynamic flux-balance analysis; lipid
metabolism; Saccharomyces cerevisiae;
systems biology; triacylglycerol degradation
Correspondence
J. Zanghellini, Institute of Chemistry,
University of Graz, Heinrichstraße 28,
A-8010 Graz, Austria
Fax: +43 316 380 9850
Tel: +43 316 380 5421
E-mail:
*These authors contributed equally to this
work
(Received 11 July 2008, revised
5 September 2008, accepted 9
September 2008)
doi:10.1111/j.1742-4658.2008.06681.x
Triacylglycerol metabolism in Saccharomyces cerevisiae was analyzed quan-
titatively using a systems biological approach. Cellular growth, glucose
uptake and ethanol secretion were measured as a function of time and used
as input for a dynamic flux-balance model. By combining dynamic mass
balances for key metabolites with a detailed steady-state analysis, we
trained a model network and simulated the time-dependent degradation of
cellular triacylglycerol and its interaction with fatty acid and membrane
lipid synthesis. This approach described precisely, both qualitatively and
quantitatively, the time evolution of various key metabolites in a consistent
and self-contained manner, and the predictions were found to be in excel-
lent agreement with experimental data. We showed that, during pre-loga-
rithmic growth, lipolysis of triacylglycerol allows for the rapid synthesis of
membrane lipids, whereas de novo fatty acid synthesis plays only a minor
role during this growth phase. Progress in triacylglycerol hydrolysis directly
correlates with an increase in cell size, demonstrating the importance of
lipolysis for supporting efficient growth initiation.
Abbreviations
CDP, cytidine diphosphate; DAG, diacylglycerol; DFBA, dynamic flux-balance analysis; FA, fatty acid; FBA, flux-balance analysis; LD, lipid
droplet; MP, membrane particle; PA, phosphatidate; PC, phosphatidylcholine; PE, phosphatidylethanolamine; SE, steryl ester; TAG,
triacylglycerol.
5552 FEBS Journal 275 (2008) 5552–5563 ª 2008 The Authors Journal compilation ª 2008 FEBS
determinant of rapid growth initiation. As peroxisomes
– the only site of b-oxidation in yeast – are repressed
by glucose, it was hypothesized that, during pre-
logarithmic growth, TAG-derived FA may be used as
a precursor for membrane lipid synthesis rather than
as an energy source [5].
In this study, we used the well-established yeast
model and combined theoretical and experimental
approaches to describe quantitatively the role of TAG
degradation in growing cells and the metabolic flux of
FA. We reconstructed the metabolic pathway of TAG
lipolysis in yeast in silico and specifically addressed the
question of whether FA derived from TAG hydrolysis
in growing cells is channeled into b-oxidation or
towards membrane lipid synthesis by a systems bio-
logical approach [6].
Our theoretical model is based on the well-estab-
lished concept of flux-balance analysis (FBA) [7], a
structural network model that replaces a full kinetic
description which, because of a lack of experimental
parameters, is as yet out of reach. FBA uses stoichi-
ometric information about all possible reactions which
comprise the metabolic network of yeast cells. By
assuming stationarity, FBA allows for the identifica-
tion of the optimum flux distribution to sustain a par-
ticular biological function. However, FBA is unable to
describe the kinetics of individual chemical reactions
and their regulation, as the analysis of the network
behavior is based on steady-state solutions.
Time-dependent effects can be taken into account by
adopting a dynamic extension to conventional, station-
ary FBA (dynamic flux-balance analysis, DFBA). In
brief, DFBA approximates the observed temporal
behavior by a series of steady-state solutions. Based on
technically mature theoretical methods, this systems
biological program has been applied successfully to
simulate a number of complex biological networks
[7,8]. The approach in this study differs from previous
implementations of stationary and dynamic FBA [9–
13] insofar as we experimentally determined the time
dependence of glucose and ethanol concentrations, as
well as of cell mass (growth). These data were used as
constraints to iteratively impose the observed func-
tional behavior on our in silico model in order to
reduce its degrees of freedom. We successively applied
different cellular objectives and locked the resulting
network response. The trained model was then utilized
to predict cellular TAG levels in response to altered
metabolic parameters. To confirm these results, the
average TAG content per cell during growth, and the
cell size, were determined experimentally.
Our study: (a) identifies TAG lipolysis during early
growth as an important, genuine effect; (b) shows that
TAG degradation is most prominent during the initial
lag phase after the inoculation of cells into fresh cul-
ture medium; and, most importantly, (c) yields a quan-
titative description of the utilization of TAG depots
for the production of membrane lipids in order to initi-
ate rapid growth, in accordance with experimental evi-
dence. Taken together, we present, for the first time, a
consistent and accurate quantitative analysis of a lipid
metabolic pathway in yeast.
Results
DFBA satisfactorily models the time-dependent
metabolic behavior of S. cerevisiae
The glucose uptake and growth rate of a wild-type
yeast culture were determined and subjected to DFBA
to predict the time evolution of the maximum possible
ethanol concentration in the medium. As a unique
DFBA solution requires an optimization criterion, we
employed the maximization of ethanol production as
the objective (Table 3, run 1).
As illustrated in Fig. 1 and in accordance with
experiments, ethanol (thin full line) is secreted during
all growth phases up to 35 h. Deviations between
the calculated and measured ethanol concentrations
result from ethanol loss because of evaporation.
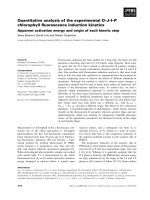
Fig. 1. DFBA simulations and experimental data for cell density
(dotted line and open squares, respectively), glucose concentration
(broken line and open circles) and ethanol concentration (full line
and filled diamonds). The input data for the simulation (glucose
uptake and cell density) were first fitted to analytical functions
(dashed and dotted lines) to facilitate easy handling of the data.
The thin full line was obtained by assuming that all available sugar
is converted into ethanol. The shaded area underneath represents
an estimate of the portion of ethanol being evaporated. The thick
full line represents a DFBA calculation, where the maximum etha-
nol secretion rate has been constrained in order to fit the experi-
mentally measured values (filled diamonds).
J. Zanghellini et al. Triacylglycerol mobilization in yeast
FEBS Journal 275 (2008) 5552–5563 ª 2008 The Authors Journal compilation ª 2008 FEBS 5553
When vaporization was taken into account, all
experimentally measured ethanol concentrations were
in accordance with our calculation. In Fig. 1, the
loss caused by volatilized ethanol is represented by
the shaded area.
We trained our computer model by constraining
the ethanol secretion rate (Table 3, run 2) such that
the experimentally measured concentrations (Fig. 1;
filled diamonds) were best matched using least-
squares fitting. The fitting procedure used was to
reduce the maximum ethanol secretion rate, solve the
corresponding DFBA problem, correct for evapora-
tion and calculate the sum of squares of vertical
deviations. This sequence was repeated until the best
fit was achieved, resulting in a correlation coefficient
of r =98.2%. The maximum ethanol secretion rate
per gram dry weight of biomass was found to be
18.8 mmolÆg
)1
Æh
)1
, which is comparable with the
values reported by Velagapudi et al. [14] (18.2±
1.5 mmolÆg
)1
Æh
)1
) and Duarte et al. [15] (11.98
mmoÆg
)1
Æh
)1
). The data in Fig. 1 illustrate the result-
ing evolution of the ethanol concentration (thick full
line), and confirm that our implementation of DFBA
matches all measured data within the error bounds,
and thus accurately describes the dynamic behavior
of S. cerevisiae.
LD turnover in growing cells cannot solely be
explained by dilution
It has previously been shown that the relative vol-
ume of LD decreases by some 80% when stationary
phase (starving) yeast cells re-enter the cell cycle
after transfer into fresh medium containing glucose
as carbon and energy source (see Fig. 2, left panels)
[5]. One explanation for the time dependence of
cellular neutral lipid content may be simple dilution,
i.e. existing LD is distributed amongst a growing
number of cells, without active degradation. Such a
mechanism can explain the decrease in the relative
LD content per cell as a consequence of the sharing
of a constant amount of LD between an increasing
number of cells.
From our measurements, and in agreement with
published data [16,17], we found that LD typically
consists of 52 mol% SE and 48 mol% TAG. Assum-
ing that the composition of LD does not change dur-
ing hydrolysis, we have focused on the TAG content
of LD. The ‘dilution only’ model was calculated by
assuming the initial, total mass of TAG of the yeast
culture to be constant throughout the subsequent
growth period, m
TAG
(t
0
)X(t
0
)=m
TAG
(t)X(t) = con-
stant. Here, m
TAG
and X denote the mass of TAG per
cell and the cell number as a function of time t, respec-
tively, with the initial time t
0
.
In Fig. 2 (top right panel, full line), we show the
expected evolution of TAG levels based on dilution
and the experimentally determined mass levels (dot-
ted line), demonstrating a major deviation of the
observed TAG levels from the content expected as a
result of simple dilution. The difference (bottom
right panel) indeed represents the loss of TAG
caused by lipolytic activity, and shows that LD is
rapidly catabolized, reaching a minimum level after
3 h. After this period, first cell divisions occur, yet
the deviation of TAG levels between calculated dilu-
tion and measured data remains fairly constant
throughout the following 3 h. Figure 2 clearly shows
that the lipolytic activity peaks before the cells enter
exponential growth and continues for several hours
into logarithmic growth.
FA derived from TAG mobilization are not used
for energy production
To simulate LD mobilization, we employed DFBA
based on quantitative data of LD composition
(Table 1). Computationally, we modeled LD by add-
ing a reservoir of various neutral lipids (Table 1) to
our in silico model. Glucose uptake, calibrated etha-
nol production and cellular growth were used as
input values for the calculations. To uniquely define
the internal flux distribution, FBA requires an opti-
mization criterion, which, in biological terms, repre-
sents a certain physiological goal for the cell.
Typically, the maximization of cellular growth is
chosen as an objective [15,18,19]. As the time-depen-
dent growth behavior of our system is already deter-
mined by the input data, we were especially
interested in identifying conditions with high lipolytic
activity in silico to explain the experimental data.
Therefore, maximum LD mobilization was chosen as
an objective (Table 3, run 3).
The calculation revealed that, in the absence of addi-
tional metabolic fluxes, no change in TAG levels, and
thus no LD mobilization, takes place. The inability to
catabolize TAG under these conditions clearly indicates
that the release of FA and their degradation by peroxi-
somal b-oxidation are not possible. To confirm this
result, we simulated growth with the objective of maxi-
mizing acetyl-CoA generated by FA degradation
(Table 3, run 4). Yet, even under these conditions, a
negligible amount of TAG was mobilized (3 · 10
)5
mmolÆg
)1
Æh
)1
). We therefore conclude that peroxisomal
b-oxidation does not contribute to the experimentally
observed LD mobilization. This inability to break down
Triacylglycerol mobilization in yeast J. Zanghellini et al.
5554 FEBS Journal 275 (2008) 5552–5563 ª 2008 The Authors Journal compilation ª 2008 FEBS
free FA indicates that the cell transfers FA from TAG
to another acceptor molecule, as a balanced flux
distribution is otherwise unachievable. Accumulation of
free FA can be excluded due to their lipotoxic effects
and hence, free FA have to be processed further.
TAG are hydrolyzed exclusively to provide
precursors for membrane lipid synthesis
It has been suggested that, during pre-logarithmic
growth, FA released from TAG and SE may be used
as precursors for membrane lipid synthesis [4,5]. To
test this hypothesis, we simulated TAG mobilization
by DFBA under the assumption that the production
and storage of excess membrane material is possible by
including a pool of membrane lipids in our model.
Computationally, we introduced virtual membrane
particles (MP), which contain glycerophospholipids
and membrane sterols in a single entity that reflects
the typical lipid composition of cellular membranes.
The chemical composition of MP is listed in Table 2.
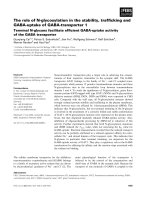
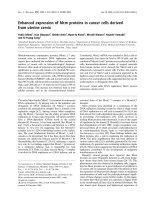
Fig. 2. Measured LD mobilization during early growth in comparison with LD kinetics caused by dilution. Top left panel: cellular growth X(t)
in complete medium. Bottom left panel: time profile of the TAG content per cell: m
TAG
(t). Top right panel: measured (filled circles) and calcu-
lated (open squares) normalized mass of TAG per cell as a function of time. The calculation assumes that, during the growth period, LD is
not metabolized, but shared between mother and daughter cells, hence diluting the initial LD concentration in the cell culture. Bottom right
panel: deviation D between the measured and calculated normalized LD mass, defined as m
TAG
(t) ⁄ m
TAG
(t
0
)–X(t
0
) ⁄ X(t). Note that the largest
deviation occurs approximately 4 h before the TAG content reaches its minimum.
Table 1. LD components and their FA composition as obtained from mass spectroscopy.
Compound w ⁄ w (%)
Fatty acid (mol%)
10 : 0 12 : 0 14 : 0 16 : 0 16 : 1 18 : 0 18 : 1
Ergosterol 19.1 – – 0.2 54.3 0.1 43.3 2.1
Episterol 8.1 – – 1.8 8.6 63.1 22.2 4.3
Fecosterol 6.1 – – 1.8 8.6 63.1 22.2 4.3
Lanosterol 1.0 – – 0.7 20.8 38.1 33.3 7.1
Zymosterol 12.2 – – 0.4 4.3 50.1 41.7 3.5
Triacylglycerol 53.5 2.0 6.0 19.9 39.2 17.0 8.4 27.0
Table 2. Composition of virtual membrane particle.
Compound w ⁄ w (%)
Ergosterol 1.9
Phosphatidate 4.3
Phosphatidylcholine 29.6
Phosphatidylethanolamine 23.2
Phosphatidylinositol 27.2
Phosphatidylserine 9.9
Zymosterol 3.9
J. Zanghellini et al. Triacylglycerol mobilization in yeast
FEBS Journal 275 (2008) 5552–5563 ª 2008 The Authors Journal compilation ª 2008 FEBS 5555
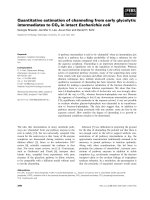
The basic metabolic pathways involved in the produc-
tion of membrane lipids and MP, and their interaction
with TAG mobilization, are illustrated in Fig. 3. By
permitting or forbidding a flux from TAG degradation
products to virtual MP, in DFBA, we are able to dis-
sect the contribution of lipolysis to membrane lipid
synthesis.
Indeed, these DFBA calculations confirmed the
hypothesis that LD are only degraded if cells are
able to generate membrane material which utilizes
products of TAG hydrolysis (Table 3, runs 4 and 5,
respectively). Figure 4 illustrates that the predicted
lipolytic activity (degradation rate of 1.5 · 10
)2
mmolÆg
)1
Æh
)1
; thick full line) is in excellent quantita-
tive agreement with experimental observations (filled
circles) if the production of MP is permitted. If MP
production is disabled in the simulation, no lipolysis
occurs (LD degradation rate of 3 · 10
)5
mmolÆ
g
)1
Æh
)1
). Figure 4 plots the resulting time dependence
of the TAG concentration per cell for these two
cases. The difference between the simulation with
and without enabled membrane production (differ-
ence between the full and broken lines in Fig. 4) is
indeed dramatic, and MP production is increased by
three orders of magnitude if metabolically accessible
TAG pools are provided (inset in Fig. 4). In both
simulations, the impact of lipolytic activity was
found to be restricted to the production of mem-
brane material, as we could not detect any signifi-
cant changes in other metabolite concentrations. On
the basis of these results, we suggest that TAG
Fig. 3. Schematic representation of FA, neutral, and phospholipid
metabolism implemented in our reconstructed yeast network. Bro-
ken arrows mark the Kennedy pathway, which is turned off in our
calculations. Full arrows indicate the direction of metabolic fluxes
according to simulation 5 listed in Table 3. The circular areas repre-
sent the relative amount of FFA derived from LD mobilization (large
circle) and de novo synthesis (small circle). For further details, see
text. DAG, diacylglycerol; FFA, free fatty acid; LD, lipid droplet;
MAG, monoacylglycerol; MP, (virtual) membrane particle; PA, phos-
phatidate; PC, phosphatidylcholine; PE, phosphatidylethanolamine;
PI, phosphatidylinositol; PS, phosphatidylserine; SE, steryl esters.
Table 3. Summary of the simulation arrangements together with their main features. Additional parameters used in the simulations are
listed in Table 4.
Run
no.
Input (time
dependent) Constraint Objective function
Output
(time dependent) Comment
1 Glucose uptake Maximum ethanol production Ethanol concentration Overestimates data
Growth rate Fig. 1, thin full line
2 Glucose uptake Ethanol secretion £ C Maximum ethanol production Ethanol concentration Fitting ethanol concentration
Growth rate C [12, 20] mmolÆg
)1
Æh
)1
Fig. 1, thick full line
3 Glucose uptake Excess MP production = 0 Maximum LD mobilization TAG concentration Inconsistent with experiment
Growth rate Fig. 4, broken line
Ethanol secretion
4 Glucose uptake Excess MP production = 0 Maximum acetyl-CoA production TAG concentration Inconsistent with experiment
Growth rate Fig. 4, broken line
Ethanol secretion
5 Glucose uptake Maximum LD mobilization TAG concentration Consistent with experiment
Growth rate MP concentration Fig. 4, full line
Ethanol secretion
6 Glucose uptake Maximum MP production TAG concentration Consistent with experiment
Growth rate MP concentration
Ethanol secretion
7 Glucose uptake LD mobilization = 0 Maximum MP production MP concentration Growth retardation
Growth rate Fig. 5, broken line
Ethanol secretion
Triacylglycerol mobilization in yeast J. Zanghellini et al.
5556 FEBS Journal 275 (2008) 5552–5563 ª 2008 The Authors Journal compilation ª 2008 FEBS
mobilization and membrane production are inter-
changeable objectives, leading to similar results in
the simulation.
To corroborate this hypothesis, we repeated the
DFBA calculation by optimizing with respect to
maximum MP production instead of maximum TAG
mobilization (Table 3, run 6). For both objectives,
we obtained identical results, demonstrating that
these optimization criteria are equivalent, as the MP
production rate is directly linked to TAG degra-
dation. We conclude that, during pre-logarithmic
growth, TAG is mobilized with the sole purpose to
supply precursors for membrane synthesis, and that,
conversely, TAG degradation products are solely
used for MP production. This result is further sup-
ported by flux variability analysis [20], as testing
maximum MP production across alternate optimal
solutions showed that TAG lipase activity
remained unaltered by changes in the internal flux
distribution.
It is noteworthy to mention that the data shown in
Fig. 4 are the result of a DFBA simulation following
the procedure described above. No additional adapta-
tions were necessary, which clearly demonstrates the
potential of this approach to simulate correctly in vivo
TAG mobilization.
TAG mobilization is proportional to the rate of
cell surface growth
The production of (excess) membrane lipids derived
from TAG degradation raises the question of storage
options for these membranes in a biological context.
The most obvious solution would be to increase cell
size. If the subdivision of membrane material between
the organelles remained constant, the rate of mem-
brane production should be proportional to the change
in the surface area of the cell. As membranes are typi-
cally of constant thickness, any increase in membrane
material results in a gain of membrane surface. In fact,
Fig. 5 shows that the normalized MP production rate
closely mimics the experimentally determined change
in the mean cellular surface area, which was calculated
from the measured mean cell volume by assuming
spherical cells.
These data demonstrate that the rate of MP produc-
tion during the first 5 h of growth directly correlates
with the change in the cell surface area. As MP
production is caused by TAG mobilization, these sim-
ulations suggest that the increase in cell size during
pre-logarithmic cellular growth can be traced back to
lipolytic activity. This interpretation is consistent with
the observation that after 6 h – when lipolysis ceases
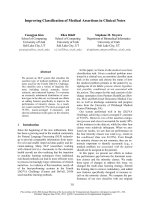
Fig. 4. Experimentally measured (filled circles) and calculated (full and broken lines) TAG mobilization during pre-logarithmic growth as a
function of time. The thin dotted line represents a linear fit of the experimental data in the range 0.25–4 h. The calculated lines are
obtained via DFBA assuming maximum TAG mobilization. The full line represents a simulation, which allows for the production of
excess membranes, and the broken line is the result of a simulation suppressing such membrane production. In both simulations,
glucose uptake, ethanol production and cellular growth are used as shown in Fig. 1 as input. The inset shows the total rate of
membrane production with (filled) and without (open) TAG mobilization at t = 3 h (marked by arrows). Note the logarithmic scale in the
inset.
J. Zanghellini et al. Triacylglycerol mobilization in yeast
FEBS Journal 275 (2008) 5552–5563 ª 2008 The Authors Journal compilation ª 2008 FEBS 5557
(see Fig. 2, top right panel) – the relative cellular
surface reaches its maximum (Fig. 5).
TAG lipolysis rather than de novo synthesis is
the predominant source of FA in the lag phase
Although membrane production clearly correlates with
increased cell size (Fig. 5), we considered the possibil-
ity that processes other than TAG degradation con-
tribute to membrane lipid synthesis. The only
pathway, which may indeed contribute considerably to
the supply of FA, is de novo synthesis from acetyl-
CoA. To elucidate the role of this pathway during the
early growth period, we analyzed the fluxes leading to
phosphatidate (PA), the primary intermediate in phos-
pholipid synthesis. By comparing the FA fluxes into
PA (1.8 · 10
)2
mmolÆg
)1
Æh
)1
) versus the release from
TAG (1.5 · 10
)2
mmolÆg
)1
Æh
)1
), we found that, in
total, 80 mass% are indeed derived from LD. This
ratio is smaller for FA which are found in lower con-
centrations in lipids of LD, such as C10:0, but never
falls below a contribution of about 60% for a specific
FA.
According to our calculation, only 20 mass% of
FA in newly synthesized PA are derived from de novo
FA synthesis, if TAG lipolysis is enabled. To address
the question of whether this flow could be increased if
the supply of FA from TAG was prevented, we
adjusted our calculations towards maximized mem-
brane production in the absence of TAG mobilization
(broken line in Fig. 5). Under this condition (Table 3,
run 7), the MP production rate was 29 mmolÆg
)1
Æh
)1
,
which is less than one-third of the rate calculated when
lipolysis takes place, supporting the predominant role
of TAG to provide precursors for phospholipid
synthesis during the initiation of cellular growth.
However, these simulations show that the cell is able
to respond to a lack of TAG degradation by increasing
de novo FA synthesis.
Utilization of diacylglycerol (DAG) generated by
TAG lipolysis
The synthesis of membrane-forming phospholipids
occurs via two independent pathways. In the de novo
pathway, PA is converted to cytidine diphosphate-
DAG (CDP-DAG), which, in turn, is further metabo-
lized to phosphatidylinositol, phosphatidylserine and
phosphatidylglycerolphosphate ⁄ cardiolipin. Decarbox-
ylation of phosphatidylserine gives rise to phos-
phatidylethanolamine (PE), which is subsequently
methylated to phosphatidylcholine (PC), the major
phospholipid in yeast. To activate this pathway during
the lag phase of growth, cells entirely rely on the sup-
ply of FA for PA synthesis, or on the activity of the
recently published DAG kinase [21,22], which may
utilize DAG that is generated by a single de-acylation
step from TAG. Alternatively, PE and PC can be
synthesized via the Kennedy pathway by transfer of
CDP-ethanolamine and CDP-choline to DAG if
choline and ethanolamine are present in the medium.
In our study, this pathway was disabled to reduce the
complexity of analysis, thus forcing the cells to rely
entirely on the de novo phospholipid biosynthetic
pathway through the production and utilization of PA.
By analyzing the calculated flux distribution, we found
that TAG is converted to DAG and directly phosphor-
ylated to yield PA with a rate of 1.9 · 10
)2
mmolÆ
g
)1
Æh
)1
. This pathway is less energy costly than the
synthesis via total hydrolysis of TAG or DAG, and
the subsequent re-acylation of glycerol-3-phosphate
(Fig. 3). Interestingly, inactivation of DAG kinase
activity resulted in a comparable TAG mobilization
rate; in fact, our analysis shows that, after 5.5h of
growth, the difference in the relative TAG mass per
cell for both cases, with active or inactive DAG kinase,
is below 3% of the initial TAG concentration.
Discussion
TAG have only recently been acknowledged as
important metabolic compounds, not only to provide
FA as a source for energy, but also playing
important roles in cellular FA and complex lipid
Fig. 5. Normalized cell surface area as a function of time for the
cell culture shown in Fig. 1. Filled diamonds present the estimated
values for the cell surface based on the measured mean cell vol-
ume, assuming spherical yeast cells. The full line represents the
normalized increase in membrane lipids predicted by DFBA and
assuming maximum TAG mobilization. The broken line shows the
result for maximum membrane production if TAG is not available.
Triacylglycerol mobilization in yeast J. Zanghellini et al.
5558 FEBS Journal 275 (2008) 5552–5563 ª 2008 The Authors Journal compilation ª 2008 FEBS
homeostasis. Synthesis of TAG and its storage in the
biophysically rather inert neutral lipid core of LD
may serve as a rescue pathway when excess FA need
to be withdrawn from active cellular metabolism to
prevent lipotoxicity [1,2]. In addition, catabolites
derived from TAG hydrolysis, especially DAG, have
been suspected to be substrates in pathways of phos-
pholipid synthesis, such as the Kennedy pathway for
PE and PC synthesis [23–25].
In this study, we have analyzed neutral lipid mobili-
zation and its underlying metabolic fluxes within a
DFBA framework. Using DFBA, or any other FBA-
based approach for that matter, requires the knowl-
edge of a physiologically relevant objective function
[26–28]. This is necessary as DFBA optimizes the flux
distribution through a reaction network with regard to
that function. However, although different schemes to
identify the most probable objective function for a
given biological system have been put forward [29,30],
the choice of a particular goal function is still anything
but obvious. Typically, maximization of the cellular
growth rate is chosen as an objective [15,18,19], but
other objective functions have also been suggested
[31,32]. As our interest was focused on the flux of
catabolites derived from TAG hydrolysis, rather than
on predicting the growth behavior, we were able to
utilize the measured growth parameters as input for
our in silico yeast model and optimize with respect
to maximum TAG mobilization or membrane
production.
We used cellular growth as input data, which
allowed a change in the objective function without
altering the cellular response. Moreover, by adopting
various objective functions – which may change as the
cell faces nutritional and environmental alterations –
our simulations matched all experimental observations.
For example, we first optimized with respect to ethanol
secretion and calibrated our calculation to meet the
experimentally determined ethanol concentration in the
culture medium. We then used the time dependence
obtained as an additional input parameter, and chose
a different objective function in order to further reduce
the degrees of freedom in the model. Rather than
guessing the ultimate physiological objective of the cell
in one optimization criterion, this approach enabled us
to iteratively train the computer model with experi-
mental data using different objectives. This successive
calibration sets our approach apart from conventional
FBA and DFBA implementations [9–13].
Our approach also adds a new aspect to the usage
of FBA. By including pools in our simulation, we
were able to analyze the impact of internal storage
compartments. These depots act either as sources or
as sinks for internal fluxes. From a biological point
of view, they allow the cell to dispose of excess
metabolites by storing them in an inert form. When
demand for these metabolites is high, they are read-
ily available without the need for energy costly syn-
thesis. Our analysis demonstrated that it is essential
to include storage compartments, as they are key
players in supporting a flux equilibrium during non-
logarithmic growth. If these cellular reservoirs were
absent, a consistent interpretation of experimental
observations was impossible.
Our simulations show – consistent with experimental
data [5] – that lipolysis of TAG is a key process during
lag and pre-logarithmic growth phases (Fig. 2), and
promotes the rapid initiation of growth of quiescent
cells exposed to glucose-containing media. TAG mobi-
lization provides DAG and ⁄ or FA for the synthesis of
phospholipids; forcing the system to utilize FA to pro-
duce energy via b-oxidation would result in halted
TAG mobilization, which is not consistent with experi-
mental data. Peroxisomes are repressed in the presence
of glucose; therefore, the utilization of lipolysis-derived
FA for energy production during this phase of growth
is also biologically irrelevant.
As we used a choline- and ethanolamine-free
medium in both experiments and simulations, no net
synthesis of the major yeast phospholipids, PE and
PC, via the Kennedy pathway was observable. Adding
choline and ethanolamine in silico resulted in the
production of considerable amounts of PC and PE by
this route, which might be favored because of its lower
energy demand. The additional possibility for PE and
PC synthesis further stimulated TAG mobilization to
satisfy the demand for DAG, which is a major sub-
strate in this pathway.
The direct phosphorylation of DAG to PA was
favored over a complete hydrolysis to free FA and
glycerol in our calculation. Considering the energy
balance, this result is not surprising, as the de novo
pathway consumes about 80% more energy. However,
Han et al. [21,22] proposed a regulatory role for the
DAG kinase Dgk1 in PA homeostasis of the nuclear
membrane, and it remains to be shown whether this
pathway contributes considerably to net phospholipid
synthesis. Therefore, the complete hydrolysis of TAG
to free FA, and their subsequent activation and
assembly into PA, is the most likely pathway to
synthesize phospholipids in the absence of choline and
ethanolamine.
Our simulations yielded identical results for assum-
ing both maximum TAG hydrolysis and production of
membranes as objective functions. Hence, yeast cells
that re-adjust their metabolism from stationary phase
J. Zanghellini et al. Triacylglycerol mobilization in yeast
FEBS Journal 275 (2008) 5552–5563 ª 2008 The Authors Journal compilation ª 2008 FEBS 5559
to nutrient-rich conditions generate metabolites from
TAG breakdown that are exclusively used for mem-
brane lipid synthesis, but not for energy production.
Lag-phase cells are characterized by an increase in cell
size, which depends on the availability of membranes,
and which, in turn, relies on TAG lipolysis. Accord-
ingly, the absence of lipolysis in lipase-deficient tgl3
tgl4 mutants results in smaller cells and a major delay
of their entry into vegetative growth after quiescence
[5]. Recently published data [33,34] and unpublished
findings from our laboratory (C. F. Kurat and
S. D. Kohlwein, unpublished results) indeed show a
cell cycle-dependent regulation of enzymes involved in
TAG homeostasis. Initiation of DNA replication
(S phase of the cell cycle) requires that cells have
reached a defined minimum size (for a review, see [35])
and is delayed in the absence of lipolysis. This implies
an important role for TAG catabolism, not only dur-
ing recovery from G0 (quiescence), but also for effi-
cient cell cycle progression. Future work will focus on
the function of TAG stores as a buffer for specific
membrane precursors, which become readily available
at critical cell cycle checkpoints.
Materials and methods
Growth conditions and analytical methods
A haploid yeast wild-type strain (MATahis3D1 leu2D0
lys2D0 ura3D0), derived from tetrad dissection of BY4743
[European S. cerevisiae Archive for Functional Analysis
(EUROSCARF), Frankfurt, Germany], was used for all
experiments. Cells were grown at 30 °C in 500 mL minimal
medium, containing 20 gÆL
)1
glucose, 1.7gÆL
)1
yeast nitro-
gen base (Difco, Le Pont de Claix, France), 5 gÆL
)1
ammo-
nium sulfate and the appropriate amino acids and bases.
Cells were isolated by RediGradÔ centrifugation [36] from
cultures grown to stationary phase for 48 h. These cells
were inoculated into fresh medium to 10
6
cellsÆmL
)1
, and
growth and cell size were monitored with a Casy TTC cell
counter equipped with a 60 lm capillary (Scha
¨
rfe Systems,
Reutlingen, Germany). Glucose was measured with an
Accu-Chek blood glucose monitor (Roche, Mannheim,
Germany). Ethanol concentrations were determined with
the alcohol dehydrogenase reaction. For lipid extraction,
10
9
cells were harvested by centrifugation and frozen in
liquid nitrogen. Cells were disrupted and lipids were
extracted by shaking with glass beads in chloroform–metha-
nol (2 : 1) [37]. Total lipid extracts were separated on silica
gel plates (Merck, Darmstadt, Germany) with the mobile
phase petrol ether–diethylether–acetic acid (40 : 15 : 0.5),
and stained at 120 °C for 15 min after submerging the plate
in a solution containing 3.2% H
2
SO
4
and 0.5% MnCl
2
.
Lipids were quantified against appropriate standards by
densitometry at 450 nm on a Camag TLC scanner 3
(Camag, Muttenz, Switzerland).
Network reconstruction
We used the fully compartmentalized genome-scale meta-
bolic model iND750 [38] as an in silico representation of
S. cerevisiae . It captures the topology of the metabolic net-
work by its stoichiometric matrix, S, and allows the simula-
tion of steady-state behavior. The description of the
glycerolipid and phospholipid metabolism was extended by
adding TAG, DAG, as well as monoglyceride lipases. A list
of all newly added chemical reactions may be found in the
Doc. S1. These reactions were elementally and charge
balanced; hence, the pH value of 7.2 remained unaltered
compared with the original iND750 model.
Dynamic flux-balance analysis (DFBA)
Lipolysis was investigated within the framework of FBA
[26,27]. FBA assumes steady-state conditions, i.e. no net
production or consumption of metabolites occurs, leading
to the mass balance equation [7]
Sv ¼ 0 ð1Þ
Here, S represents the stoichiometric matrix of the recon-
struction metabolic network and v denotes the vector of all
fluxes per gram of biomass through the network. The flux
vector contains both internal network fluxes and exchange
fluxes, the latter capturing the interaction of the model with
its environment.
For a typical simulation, various values for exchange
fluxes were determined experimentally and used as input to
compute the remaining flux values by solving Eqn (1). Usu-
ally, a biological system contains more reactions than
metabolites, i.e. the number of columns in S is larger than
the number of rows. Hence, the system of linear equations
(Eqn 1) is under-determined and a linear objective function
was adopted to single out an individual flux distribution
using the freely available GNU Linear Programming Kit
package, version 4.13 ( />Department for Applied Informatics, Moscow Aviation
Institute, Moscow, Russia).
This purely static FBA was adapted to include dynamic
processes by defining concentrations of external compounds
[x
e
], which did not obey the steady-state condition (Eqn 1),
but were allowed to change with respect to time t, accord-
ing to the dynamic balance equations [9,11–13,39]
d½x
e
dt
¼ v
e
ðtÞ½X
BM
ðtÞ; ð2Þ
where [X
BM
] denotes the concentration of biomass. At any
point in time, individual exchange flux values v
e
were either
measured experimentally or resolved by solution of
Eqn (1). Dynamic time profiles for external metabolites
Triacylglycerol mobilization in yeast J. Zanghellini et al.
5560 FEBS Journal 275 (2008) 5552–5563 ª 2008 The Authors Journal compilation ª 2008 FEBS
were then approximated by successively integrating Eqn (2).
To facilitate integration, we assumed all fluxes to be con-
stant during a single integration step.
Medium composition and parameter estimation
Experimentally determined glucose concentrations and cell
densities were fitted using an asymmetric sigmoid function
r
fit
ðtÞ¼a
1
1 þ exp À
t À a
3
lnð2
1=a
4
À 1ÞÀa
2
a
3
Àa
4
; ð3Þ
with the fitting parameters a
1
, a
2
, a
3
and a
4
. The glucose
uptake rate and growth rate were then calculated by differ-
entiation. Table 4 lists every additional constraint except for
ethanol. The temporal medium composition was monitored
and uptake fluxes were dynamically restricted if the corre-
sponding metabolite was consumed. All other fluxes were
left unconstrained. The ethanol production rate was con-
strained to meet experimental data. Ethanol loss as a result
of evaporation was calculated by numerically integrating
d½x
etoh
dt
¼
d½x
etoh
dt
DFBA
Àk½x
etoh
: ð4Þ
Here [x
etoh
] represents the resulting ethanol concentration,
d½x
etoh
dt
DFBA
denotes the instantaneous rate of change in the
ethanol concentration as predicted by DFBA and – k[x
etoh
]
represents the loss caused by vaporization with k =0.01
per h. k was determined in a separate experiment. Ethanol
concentrations in a sterile culture medium initially contain-
ing 5 gÆL
)1
ethanol were measured over several hours, and
data were fitted to an exponential function with decay
constant k.
Acknowledgements
This work was supported by a grant from the Austrian
Federal Ministry for Science and Research (Project
GOLD within the framework of the Austrian
GEN-AU program) to S.D.K.
References
1 Listenberger LL, Han X, Lewis SE, Cases S, Farese
RV, Ory DS & Schaffer JE (2003) Triglyceride accumu-
lation protects against fatty acid-induced lipotoxicity.
Proc Natl Acad Sci USA 100, 3077–3082.
2 Cnop M, Hannaert JC, Hoorens A, Eizirik DL & Pipe-
leers DG (2001) Inverse relationship between cytotoxicity
of free fatty acids in pancreatic islet cells and cellular tri-
glyceride accumulation. Diabetes 50, 1771–1777.
3 Martin S & Parton RG (2006) Lipid droplets: a unified
view of a dynamic organelle. Nat Rev Mol Cell Biol 7,
373–378.
4 Gray JV, Petsko GA, Johnston GC, Ringe D, Singer
RA & Werner-Washburne M (2004) ‘‘Sleeping Beauty’’:
quiescence in Saccharomyces cerevisiae. Microbiol Mol
Biol Rev 68, 187–206.
5 Kurat CF, Natter K, Petschnigg J, Wolinski H, Scheur-
inger K, Scholz H, Zimmermann R, Leber R, Zechner
R & Kohlwein SD (2006) Obese yeast: triglyceride lipol-
ysis functionally conserved from mammals to yeast.
J Biol Chem 281, 491–500.
6 Mustacchi R, Hohmann S & Nielsen J (2006) Yeast sys-
tems biology to unravel the network of life. Yeast 23,
227–238.
7 Palsson BO (2006) Systems Biology. Properties of
Reconstructed Networks. Cambridge University Press,
Cambridge.
8 Szallasi Z, Stelling J & Periwal V (2006) System Model-
ing in Cellular Biology: From Concepts to Nuts and
Bolts. The MIT Press, Boston, MA.
9 Varma A & Palsson BO (1994) Stoichiometric flux bal-
ance models quantitatively predict growth and meta-
bolic by-product secretion in wild-type Escherichia coli
W3110. Appl Environ Microbiol 60, 3724–3731.
Table 4. Time-independent constraints used in all simulations.
Constraint
a
(mmolÆg
)1
Æh
)1
) Reaction name Compartment Chemical equation
ACOAH = 0 Acetyl-CoA hydrolase
(EC 3.1.2.1)
[Cytosol] AcO
)
+ CoA
4)
+H
+
fi Acetyl-CoA
4)
+H
2
O
ATPM = 1 Non-growth-associated
ATP requirement
[Cytosol] ATP
4)
+H
2
O fi ADP
3)
+H
+
+HO
4
P
2)
GLUSx = 0 Glutamate synthase
(EC 1.4.1.14)
[Cytosol] L-Gln + 2-oxoglutarate
2)
+ NADH
2)
+H
+
fi 2L-Glx
)
+ NAD
)
O2t £ 8 Cellular O
2
uptake O
2
[extracellular] M O
2
[cytosol]
SBTR = 0 Sorbitol reductase
(EC 1.1.1.21)
[Cytosol]
D-Glc + NADPH
4)
+H
+
fi D-Sorbitol + NADP
3)
a
The constraints and their abbreviations are identical to those used in the original yeast model iND750 [38], which have also been success-
fully applied in other situations [15,40].
J. Zanghellini et al. Triacylglycerol mobilization in yeast
FEBS Journal 275 (2008) 5552–5563 ª 2008 The Authors Journal compilation ª 2008 FEBS 5561
10 Ibarra RU, Edwards JS & Palsson BO (2002) Escheri-
chia coli K-12 undergoes adaptive evolution to
achieve in silico predicted optimal growth. Nature 420,
186–189.
11 Mahadevan R, Edwards JS & Doyle FS (2002)
Dynamic flux balance analysis of diauxic growth in Esc-
herichia coli. Biophys J 83, 1331–1340.
12 Hjersted JL & Henson MA (2006) Optimization of fed-
batch Saccharomyces cerevisiae fermentation using
dynamic flux balance models. Biotechnol Prog 22, 1239–
1248.
13 Luo RY, Liao S, Tao GY, Li YY, Zeng S, Li YX
& Luo Q (2006) Dynamic analysis of optimality in
myocardial energy metabolism under normal and
ischemic conditions. Mol Syst Biol 2, 2006.0031.
14 Velagapudi VR, Wittmann C, Lengauer T, Talwar P &
Heinzle E (2006) Metabolic screening of Saccharomyces
cerevisiae single knockout strains reveals unexpected
mobilization of metabolic potential. Process Biochem
41, 2170–2179.
15 Duarte N, Palsson B & Fu P (2004) Integrated analysis
of metabolic phenotypes in Saccharomyces cerevisiae.
BMC Genomics 5, 63.
16 Zinser E, Paltauf F & Daum G (1993) Sterol composi-
tion of yeast organelle membranes and subcellular dis-
tribution of enzymes involved in sterol metabolism.
J Bacteriol 175, 2853–2858.
17 Leber R, Zinser E, Paltauf F, Daum G & Zellnig G
(1994) Characterization of lipid particles of the yeast,
Saccharomyces cerevisiae. Yeast 10, 1421–1428.
18 Bro C, Regenberg B, Forster J & Nielsen J (2006) In
silico aided metabolic engineering of Saccharomyces
cerevisiae for improved bioethanol production. Metab
Eng 8, 102–111.
19 Varma A & Palsson BO (1994) Metabolic flux balanc-
ing: basic concepts, scientific and practical use. Nat Bio-
technol 12, 994–998.
20 Mahadevan R & Schilling CH (2003) The effects of
alternate optimal solutions in constraint-based
genome-scale metabolic models. Metab Eng 5, 264–
276.
21 Han GS, Hara LO, Siniossoglou S & Carman GM
(2008) Characterization of the yeast DGK1-encoded
CTP-dependent diacylglycerol kinase. J Biol Chem 283,
20443–20453.
22 Han GS, O’Hara L, Carman GM & Siniossoglou S
(2008) An unconventional diacylglycerol kinase that
regulates phospholipid synthesis and nuclear membrane
growth. J Biol Chem 283, 20433–20442.
23 Caviglia JM, de Gomez Dumm INT, Coleman RA &
Igal RA (2004) Phosphatidylcholine deficiency upregu-
lates enzymes of triacylglycerol metabolism in CHO
cells. J Lipid Res 45, 1500–1509.
24 Igal RA & Coleman RA (1996) Acylglycerol recycling
from triacylglycerol to phospholipid, not lipase activity,
is defective in neutral lipid storage disease fibroblasts.
J Biol Chem 271, 16644–16651.
25 Cook HW & Spence MW (1985) Triacylglycerol as a pre-
cursor in phospholipid biosynthesis in cultured neuro-
blastoma cells: studies with labeled glucose, fatty acid,
and triacylglycerol. Can J Biochem Cell Biol 63, 919–926.
26 Lee JM, Gianchandani EP & Papin JA (2006) Flux bal-
ance analysis in the era of metabolomics. Brief Bioin-
form 7, 140–150.
27 Kauffman KJ, Prakash P & Edwards JS (2003)
Advances in flux balance analysis. Curr Opinin Biotech-
nol 14, 491–496.
28 Segre D, Vitkup D & Church GM (2002) Analysis of
optimality in natural and perturbed metabolic networks.
Proc Natl Acad Sci USA 99, 15112–15117.
29 Gianchandani E, Oberhardt M, Burgard A, Maranas C
& Papin J (2008) Predicting biological system objectives
de novo from internal state measurements. BMC Bioin-
formatics 9, 43.
30 Burgard AP & Maranas CD (2003) Optimization-
based framework for inferring and testing hypothe-
sized metabolic objective functions. Biotechnol Bioeng
82, 670–677.
31 Holzhu
¨
tter S & Holzhu
¨
tter HG (2004) Computational
design of reduced metabolic networks. Chem Biol Chem
5, 1401–1422.
32 Famili I, Forster J, Nielsen J & Palsson BO (2003) Sac-
charomyces cerevisiae phenotypes can be predicted by
using constraint-based analysis of a genome-scale recon-
structed metabolic network. Proc Natl Acad Sci USA
100, 13134–13139.
33 O’Hara L, Han GS, Peak-Chew S, Grimsey N, Carman
GM & Siniossoglou S (2006) Control of phospholipid
synthesis by phosphorylation of the yeast lipin
Pah1p ⁄ Smp2p Mg
2+
-dependent phosphatidate phos-
phatase. J Biol Chem 281: 34537–34548.
34 Santos-Rosa H, Leung J, Grimsey N, Peak-Chew S &
Siniossoglou S (2005) The yeast lipin Smp2 couples
phospholipid biosynthesis to nuclear membrane growth.
EMBO J 24, 1931–1941.
35 Wells WA (2002) Does size matter? J Cell Biol 158,
1156–1159.
36 Allen C, Bu
¨
ttner S, Aragon AD, Thomas JA, Meirelles
O, Jaetao JE, Benn D, Ruby SW, Veenhuis M, Madeo
F & Werner-Washburne M (2006) Isolation of quiescent
and nonquiescent cells from yeast stationary-phase cul-
tures. J Cell Biol 174: 89–100 .
37 Folch J, Lees M & Sloane-Stanley GH (1957) A
simple method for the isolation and purification of
total lipids from animal tissues. J Biol Chem 226,
497–509.
38 Duarte NC, Herrgard MJ & Palsson BO (2004) Recon-
struction and validation of Saccharomyces cerevisiae
iND750, a fully compartmentalized genome-scale meta-
bolic model. Genome Res 14, 1298–1309.
Triacylglycerol mobilization in yeast J. Zanghellini et al.
5562 FEBS Journal 275 (2008) 5552–5563 ª 2008 The Authors Journal compilation ª 2008 FEBS
39 Sainz J, Pizarro F, Pe
´
rez-Correa JR & Agosin E
(2003) Modeling of yeast metabolism and process
dynamics in batch fermentation. Biotechnol Bioeng 81,
818–828.
40 Motter AE, Gulbahce N, Almaas E & Baraba
´
si AL
(2008) Predicting synthetic rescues in metabolic
networks. Mol Syst Biol 4, 168.
Supporting information
The following supplementary material is available:
Doc. S1. Pathways added to the reconstructed, gen-
ome-scale metabolic network iND750 of Saccharomy-
ces cerevisiae [38].
This supplementary material can be found in the
online version of this article.
Please note: Wiley-Blackwell is not responsible for
the content or functionality of any supplementary
materials supplied by the authors. Any queries (other
than missing material) should be directed to the corre-
sponding author for the article.
J. Zanghellini et al. Triacylglycerol mobilization in yeast
FEBS Journal 275 (2008) 5552–5563 ª 2008 The Authors Journal compilation ª 2008 FEBS 5563