Báo cáo khoa học: Kinetic modeling can describe in vivo glycolysis in Entamoeba histolytica doc
Bạn đang xem bản rút gọn của tài liệu. Xem và tải ngay bản đầy đủ của tài liệu tại đây (685.1 KB, 19 trang )
Kinetic modeling can describe in vivo glycolysis in
Entamoeba histolytica
Emma Saavedra
1
, Alvaro Marı
´n-Herna
´
ndez
1
, Rusely Encalada
1
, Alfonso Olivos
2
,
Guillermo Mendoza-Herna
´
ndez
3
and Rafael Moreno-Sa
´
nchez
1
1 Departamento de Bioquı
´
mica, Instituto Nacional de Cardiologı
´
a, Me
´
xico DF, Me
´
xico
2 Departamento de Medicina Experimental, Facultad de Medicina, Universidad Nacional Auto
´
noma de Me
´
xico, Me
´
xico DF, Me
´
xico
3 Departamento de Bioquı
´
mica, Facultad de Medicina, Universidad Nacional Auto
´
noma de Me
´
xico, Me
´
xico DF, Me
´
xico
Keywords
ATPases; drug targeting; hexokinase;
phosphoglycerate mutase
Correspondence
E. Saavedra, Departamento de Bioquı
´
mica,
Instituto Nacional de Cardiologı
´
a, Juan
Badiano no. 1 Col. Seccio
´
n XVI, CP 14080,
Tlalpan, Me
´
xico DF, Me
´
xico
Fax: +5255 5573 0926
Tel: +5255 5573 2911 ext. 1422
E-mail:
Note
The mathematical model described here
has been submitted to the Online Cellular
Systems Modelling Database and can be
accessed at />database/saavedra/index.html free of charge
(Received 7 November 2006, revised
13 July 2007, accepted 27 July 2007)
doi:10.1111/j.1742-4658.2007.06012.x
Glycolysis in the human parasite Entamoeba histolytica is characterized by
the absence of cooperative modulation and the prevalence of pyrophosphate-
dependent (over ATP-dependent) enzymes. To determine the flux-control dis-
tribution of glycolysis and understand its underlying control mechanisms, a
kinetic model of the pathway was constructed by using the software gepasi.
The model was based on the kinetic parameters determined in the purified
recombinant enzymes, and the enzyme activities, and steady-state fluxes and
metabolite concentrations determined in amoebal trophozoites. The model
predicted, with a high degree of accuracy, the flux and metabolite concentra-
tions found in trophozoites, but only when the pyrophosphate concentration
was held constant; at variable pyrophosphate, the model was not able to
completely account for the ATP production ⁄ consumption balance, indicating
the importance of the pyrophosphate homeostasis for amoebal glycolysis.
Control analysis by the model revealed that hexokinase exerted the highest
flux control (73%), as a result of its low cellular activity and strong AMP
inhibition. 3-Phosphoglycerate mutase also exhibited significant flux control
(65%) whereas the other pathway enzymes showed little or no control. The
control of the ATP concentration was also mainly exerted by ATP consum-
ing processes and 3-phosphoglycerate mutase and hexokinase (in the produc-
ing block). The model also indicated that, in order to diminish the amoebal
glycolytic flux by 50%, it was required to decrease hexokinase or 3-phospho-
glycerate mutase by 24% and 55%, respectively, or by 18% for both
enzymes. By contrast, to attain the same reduction in flux by inhibiting the
pyrophosphate-dependent enzymes pyrophosphate-phosphofructokinase
and pyruvate phosphate dikinase, they should be decreased > 70%. On the
basis of metabolic control analysis, steps whose inhibition would have
stronger negative effects on the energy metabolism of this parasite were
identified, thus becoming alternative targets for drug design.
Abbreviations
ADH, alcohol dehydrogenase; AK, adenylate kinase; ALDO, fructose 1,6-bisphosphate aldolase; AldDH, aldehyde dehydrogenase; ATP-PFK,
ATP-dependent phosphofructokinase; DHAP, dihydroxyacetone phosphate; ENO, enolase; EtOH, ethanol; F6P, fructose 6-phosphate;
F(1,6)P
2
, fructose 1,6-bisphosphate; G6P, glucose 6-phosphate; G6PDH, glucose 6-phosphate dehydrogenase; G3P, glyceraldehyde
3-phosphate; GAPDH, glyceraldehyde 3-phosphate dehydrogenase; Gly3PDH, glycerol 3-phosphate dehydrogenase; HK, hexokinase;
HPI, hexose 6-phosphate isomerase; HXT, hexose transporter; LDH, lactate dehydrogenase; MCA, metabolic control analysis; PGAM,
3-phosphoglycerate mutase; PGK, phosphoglycerate kinase; PGM, phosphoglucomutase; 3PGDH, 3-phosphoglycerate dehydrogenase;
PEP, phosphoenolpyruvate; 2PG, 2-phosphoglycerate; 3PG, 3-phosphoglycerate; PPi, pyrophosphate; PPi-PFK, pyrophosphate-dependent
phosphofructokinase; PPP, pentose phosphate pathway; PFOR, pyruvate:ferredoxin oxidoreductase; PFOR-AldDH, lumped reaction of PFOR
and AldDH; PPDK, pyruvate phosphate dikinase; PYK, pyruvate kinase; TPI, triosephosphate isomerase.
4922 FEBS Journal 274 (2007) 4922–4940 ª 2007 The Authors Journal compilation ª 2007 FEBS
The protist parasite Entamoeba histolytica is the causa-
tive agent of human amoebiasis. Approximately one
billion people are currently at risk of acquiring the dis-
ease; the parasite causes severe illness in 48 million
people each year and the number of annual deaths is
in the range 40 000–100 000 [1,2]. Metronidazole ther-
apy to control the disease is relatively effective; how-
ever, in 40–60% of treated patients, the microorganism
persists in the intestinal lumen, generating parasite car-
rier states [3]. Recent reports describe the induction
in vitro of E. histolytica resistant strains to this drug
[4,5]. If clinical resistance of E. histolytica to metroni-
dazole becomes prevalent, there is no alternative drug
still available. The search for better drugs is a continu-
ous process and further scientific research to under-
stand parasite biology and host–parasite interactions is
required to develop more effective treatment.
Trophozoites of E. histolytica lack functional mito-
chondria and have neither Krebs cycle, nor oxidative
phosphorylation enzyme activities; thus, glycolysis is
the only pathway able to generate ATP for cellular
work [6–8]. In terms of regulation of glycolysis, the
amoebal pathway diverges in two important aspects
from that of the human host: First, it has the enzymes
pyrophosphate-dependent phosphofructokinase (PPi-
PFK) [9,10] and pyruvate phosphate dikinase (PPDK)
[11,12], which catalyze reversible reactions under physi-
ological conditions and are not subjected to allosteric
regulation as their mammalian counterparts ATP-
dependent phosphofructokinase (ATP-PFK) and pyru-
vate kinase (PYK), respectively. In mammalian cells,
ATP-PFK and PYK catalyze irreversible reactions
under physiological conditions; these enzymes also dis-
play cooperative modulation by several physiological
metabolites and, together with hexokinase (HK) and
glucose transporter, have been identified as the main
flux-controlling steps of glycolysis in some human cell
types [13–16]. Although ATP-PFK and PYK activities
have also been detected in E. histolytica [17,18], their
activities in amoebal extracts are low in comparison to
their PPi-dependent counterparts and probably do not
significantly contribute to the total glycolytic flux. Sec-
ond, like the human glucokinase (HK IV), amoebal
HK is not inhibited by its product glucose 6-phosphate
(G6P) [19]; instead, AMP and ADP are potent
inhibitors of the amoebal HK at physiological
concentrations [19,20].
Other relevant differences of the amoebal glucose
catabolism are the presence of a metal-dependent
class II fructose 1,6-bisphosphate aldolase (ALDO)
and a 2,3-bisphosphoglycerate-independent 3-phospho-
glycerate mutase (PGAM), which have no homologues
with the enzymes present in human cells [21]. More-
over, pyruvate is converted to acetyl-CoA by pyru-
vate:ferredoxin oxidoreductase (PFOR) instead of a
pyruvate dehydrogenase complex; and acetyl-CoA is
further metabolized to ethanol (EtOH) and acetate
[6,7].
The differences found in amoebal glycolytic enzymes
in comparison to those of its host suggest that these
enzymes might be appropriate drug targets for thera-
peutic intervention of this energetically important
pathway in the parasite [22,23]. However, it should be
initially established whether the proposed target
enzymes display high control on both the glycolytic
flux and ATP concentration in amoebas and low con-
trol in the host pathway. If a difference in the control
distribution is found in the parasite versus host, then
the specific inhibition of the parasite’s enzymes with
the highest control may lead to a successful perturba-
tion of the parasite energy metabolism and growth.
Despite glycolysis being a pathway present in all cells,
subtle differences in glycolytic enzymes in, for example,
parasite versus host or tumor versus normal cells, have
been the basis in the search for drugs that affect prin-
cipally the pathologic cells with minor effects on the
normal cells.
Metabolic control analysis (MCA) [24] provides the
tools to infer the prospects of decreasing a pathway
flux by inhibiting any individual enzyme. MCA allows
to quantitatively determining the degree of control that
a given enzyme (Ei) exerts over the pathway flux (J),
namely the flux-control coefficient (C
J
Ei
). C
J
Ei
is a value
that represents the impact on flux of infinitely small
changes in an enzyme activity by factors such as exter-
nal inhibition or decreased expression. An enzyme with
a C
J
Ei
¼ 1 means that the enzyme might indeed be the
only rate-limiting step of the pathway. To date, how-
ever, MCA studies have shown that there are no rate-
limiting steps; instead, the flux control of a given
pathway is distributed among different enzymes [24].
The summation theorem of MCA states that the sum
of the C
J
Ei
of all pathway steps is equal to one. This
may include steps from other pathways (such as
branches or end-product consuming processes) as long
as they are linked by a metabolite or enzyme. Conse-
quently, some pathway steps may have C
J
Ei
values
greater than one whereas those of branching steps have
negative values, but the summation of all C
J
Ei
has to be
unity [24].
Metabolic modeling (i.e. in silico biology) uses the
kinetic parameters of the complete set of enzymes
belonging to a pathway (preferentially measured from
the same source and under the same experimental con-
ditions) to build kinetic models that can predict the
system behavior. In this sense, kinetic modeling is a
E. Saavedra et al. Modeling Entamoeba glycolysis
FEBS Journal 274 (2007) 4922–4940 ª 2007 The Authors Journal compilation ª 2007 FEBS 4923
useful tool to establish predictions about which,
why, by how much and under what conditions one
enzyme exerts control over the pathway flux. Kinetic
models have been constructed for glycolysis from
erythrocytes [25], rat heart [15], the slime-mold
Dictyostelium discoideum [26], the parasite Hymenolepis
diminuta [27], potato [28], the human parasite Trypano-
soma brucei [29–31], and Saccharomyces cerevisiae
[32,33].
Until 2004, the kinetic properties of most of the
amoebal glycolytic enzymes were scarce; however, we
recently reported the kinetic characterization of the ten
recombinant E. histolytica glycolytic enzymes from
internal glucose to pyruvate under conditions that
resemble those of the amoebal trophozoites [21]. In the
present study, a kinetic model of amoebal glycolysis
was constructed by using the kinetic properties of these
ten enzymes [21] and their V
m
values for the forward
and reverse reactions determined in cellular extracts.
By fixing the PPi concentration, the model was able to
reach stable steady states under a variety of near phys-
iological conditions, thus allowing the estimation of
the flux-control, concentration-control and elasticity
coefficients for each enzyme. With this strategy, it was
possible to quantitatively identify the main flux-con-
trolling enzymes of the amoebal glycolysis, as well as
the underlying biochemical mechanisms determining
why some enzymes exert high control and others do
not.
The mathematical model described here has been
submitted to the Online Cellular Systems Modelling
Database and can be accessed at chem.
sun.ac.za/database/saavedra/index.html free of charge.
Results
Glycolytic flux, enzyme activities and
intermediary concentrations in vivo
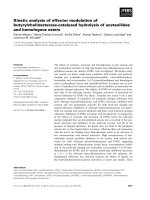
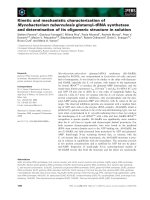
Glycolytic flux was measured as EtOH production in
amoebas incubated in the presence of 10 mm glucose
and a representative time-course is shown in Fig. 1.
The experimentally determined rate of flux was calcu-
lated by considering that 1 · 10
6
amoebal cells corre-
spond to 2 ± 0.8 mg of total protein (n ¼ 4). This
glycolytic flux value was six- to ten-fold higher than
the recalculated value previously reported by Montalvo
et al. [34] in bacteria-grown amoebas under anaerobic
conditions at 37 °C after 1 h in the presence of 2.5 mm
glucose (3–6 nmol EtOHÆmin
)1
Æmg protein
)1
; for calcu-
lations, see Experimental procedures). These two
amoebal flux values were low in comparison with the
reported glycolytic fluxes displayed under anaerobic
conditions by yeast (500 nmol EtOHÆmin
)1
Æmg pro-
tein
)1
) [32] or T. brucei (71 nmol pyruvateÆmin
)1
Æ
mg protein
)1
) [29], but similar to the glycolytic flux
determined in some tumor cell lines (21–32 nmol
lactateÆmin
)1
Æmg protein
)1
) [35].
The maximal activity values for the glycolytic
enzymes (Table 1) were evaluated in at least three cel-
lular extracts obtained from different cultures of amoe-
bal cells. These activities were determined under the
same experimental conditions of buffer, temperature
(37 °C) and physiological pH values (pH 6.0 and 7.0)
used for the characterization of the pure enzymes [21].
For the reactions from hexose 6-phosphate isomer-
ase (HPI) to PPDK, the activities were determined in
the forward and reverse reactions (Table 1). ATP-PFK
and PYK activities (Table 1) were also evaluated; how-
ever, their activities were less than 10% of those
displayed by PPi-PFK and PPDK. Therefore, these
parallel reactions were not included in the kinetic
model.
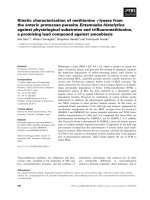
The steps following PPDK are PFOR, aldehyde
(AldDH) and alcohol (ADH) dehydrogenases (Fig. 2).
PFOR activity in the amoebal HM1:IMSS strain used
in the present study has not yet been determined. In
our hands, AldDH activity was difficult to detect with
acetyl-CoA as substrate and could only be determined
in the reverse reaction. Both, NADH- or NADPH-
dependent ADHs displayed almost the same activity
using acetaldehyde as substrate. Notably, the reported
activities for these ADHs in 200:NIH strain (6.9 and
0.96 UÆmg
)1
, respectively) [36] were one order of mag-
nitude higher than those displayed in Table 1.
100806040200 120
0.0
0.5
1.0
1.5
2.0
2.5
3.0
µmoles etoh / 10
6
cells
Incubation time (min)
Fig. 1. Time-course of EtOH production by E. histolytica trophozo-
ites. Amoebas were incubated at 35 °C in NaCl ⁄ P
i
buffer at pH 7.4
in the presence of 10 m
M glucose. At the indicated times, aliquots
were withdrawn and mixed with perchloric acid as described in the
Experimental procedures. EtOH was determined enzymatically with
ADH. The plot shown is a representative experiment with tripli-
cates. The solid line represents the fitting of the experimental
points to a Hill equation using
MICROCAL ORIGIN, version 5.0; this fit-
ting has no mechanistic meaning.
Modeling Entamoeba glycolysis E. Saavedra et al.
4924 FEBS Journal 274 (2007) 4922–4940 ª 2007 The Authors Journal compilation ª 2007 FEBS
The V
m
value for ATP-consuming processes (ATP-
ases) was higher (Table 1) than the estimated rate of
ATP production by glycolysis, suggesting kinetic
modulation of ATPases by the products ADP and
Pi. NAD(P)H-consuming activity (DHases) was mea-
sured by following the oxidation of the coenzymes
after adding the amoebal extract (Table 1); however,
the actual activity was probably underestimated
because most DHases require a second substrate for
activity. The adenylate kinase (AK) activity was
measured in both directions, ATP ⁄ AMP production
or 2ADP production; however, the specificity of the
assay using extract samples could not be directly
ascribed to this reaction (see Experimental proce-
dures).
The activities of some branches of amoebal glycoly-
sis were explored. It is well documented that amoebas
contain large amounts of glycogen as the main carbo-
hydrate storage (Table 2) [37]. Therefore, glycogen
metabolism (synthesis and degradation) is an active
branch of the first section of glycolysis at the level
of G6P. Indeed, a high phosphoglucomutase (PGM)
activity in the direction of G6P production (glycogen-
olysis) was determined (Table 1).
Recently, the activity of 3-phosphoglycerate dehy-
drogenase (3PGDH) involved in the synthesis of serine
was described in E. histolytica [38]. In the direction of
3PG oxidation under our assay conditions, this activity
was below the limit of detection in amoebal extracts
(Table 1).
The oxidative section of pentose phosphate pathway
(PPP) is probably absent in E. histolytica because no
G6P dehydrogenase (G6PDH) activity has been
detected [6,7]. Moreover, after exhaustive experimental
retesting, we were unable to detect G6PDH activity in
the soluble fraction of amoebal extracts (Table 1); in
addition, a gene coding G6PDH could not be identi-
fied in the genome sequence database [39]. In amoebas,
ribose 5-phosphate is synthesized from the glycolytic
intermediaries fructose 6-phosphate (F6P) and glycer-
aldehyde 3-phosphate (G3P) in a series of reactions
catalyzed by PPi-PFK, aldolase and transketolase [40].
However, the flux through this modified PPP has not
been explored in the parasite.
Table 1. Specific activity of glycolytic enzymes determined in amoebal clarified extracts [mU · (mg protein)
)1
]. Values in parenthesis indicate
the number of individual clarified extracts assayed. NA, not applicable; ND, not detected; NM, not measured.
Enzyme
Forward reaction Reverse reaction
pH 7.0 pH 6.0 pH 7.0 pH 6.0
HK 200 ± 32 (5) 95 ± 18 (4) NA NA
HPI 489 (2) 233 (2) 451 ± 48 (4) 206 ± 26 (4)
PPi-PFK 479 ± 165 (6) 213 ± 35 (5) 612 346
ATP-PFK 37 ± 22 (5) 1.4 ± 0.4 (3) NA NA
ALDO (–Co
2+
) 57 (2) 0 (3) NM NM
ALDO (+Co
2+
)
a
591 ± 78 (3) 160 ± 24 (3) 804 284
TPI 7235 4366 21 780 ± 7400 (4) 6098 ± 3000 (6)
GAPDH 576 ± 77 (6) 405 ± 46 (5) 3968 3680
PGK 12 107 ± 3500 (4) 3182 ± 1350 (4) 1675 1742
PGAM 115 ± 51 (3) 116 ± 37 (3) 49 104
ENO 672 ± 41 (5) 508 ± 93 (5) 108 103
PPDK 341 ± 119 (4) 304 ± 62 (5) 4.5 19
PYK [+F(1,6)P
2
] 32 ± 16 (5) 28 ± 15 (5) NA NA
AldDH NM NM 74 NM
ADH (NADH) 176 171 14 7.6
ADH (NADPH) 199 202 NM NM
ATPases 149 (2) 122 (2) NM NM
DHases (NADH) 10 ± 2 (3 7 ± 2 (3) NM NM
DHases (NADPH) 25 ± 5 (3) 26 ± 6 (3) NM NM
3PGDH ND ND NM 26.6
b
AK –
c
–
c
–
c
–
c
PGM NM NM 867 312
G6PDH ND ND NA NA
Gly3PDH ND ND ND ND
Alanine transaminase NM NM ND ND
a
The concentration of CoCl
2
was 0.2 mM.
b
Values reported by Ali et al. [38] at pH 6.5 and 25 °C.
c
No reliable determination (see Experimen-
tal procedures).
E. Saavedra et al. Modeling Entamoeba glycolysis
FEBS Journal 274 (2007) 4922–4940 ª 2007 The Authors Journal compilation ª 2007 FEBS 4925
In agreement with Reeves and Lobelle-Rich [41],
NAD
+
-dependent glycerol 3-phosphate dehydrogenase
(Gly3PDH) activity in the soluble fraction of amoebal
clarified extracts tested under different experimental
conditions was below the limit of detection (Table 1; see
Experimental procedures). However, putative Gly3PDH
and glycerol kinase genes have been identified in the
E. histolytica genome sequence database [8], which sug-
gests the presence of glycerol metabolism in the parasite.
Alternatively, triglyceride synthesis might initiate from
dihydroxyacetone phosphate (DHAP) instead of Gly3P
as described for several mammalian cells [42].
Alanine transaminase activity in the direction of pyru-
vate synthesis was below the limit of detection (Table 1).
However, a putative gene codifying for this enzyme has
also been identified in the amoebal genome [8].
Glycolytic intermediary concentrations (Table 2)
were determined in perchloric acid extracts after incu-
bating trophozoites for 1 h in the presence of 10 mm
glucose. Although after 1 h the steady-state glycolytic
flux was about to end (Fig. 1), it allowed the detection
of metabolites whose concentration was low [fructose
1,6-biphosphate, F(1,6)P
2
, G3P, pyruvate].
Model properties
The kinetic model of E. histolytica glycolysis was built
by using the computer software gepasi, version 3.3,
PA
i
PGAM
+
P
F6P
Gluc
F1,6P
2
DHAP G3P
HK
ALDO
PPi-PFK
HPI
TPI
G6P
2ADP
ATPAMP
AK
ATP ADP
ATPases
NADH
NAD
+
DHases
PAAT MP + PPi
PPi synthesis
ADP
ATP
i
Pi
PP
glycogen synthesis
2PG
1,3BPG
3PG
PEP
PGK
PPDK
GAPDH
ENO
PGAM
+
NADH
NAD
PAT
ADP
ATP + Pi
AMP + PPi
etoh
pyr
PFOR-AldDH
acald
ADH
NAD
+
NADH
NAD
+
NADH
3POHpyr
NAD
+
NADH
3PGDH
glycogen
ATP ADP + PPi
glycogen degradation
Pi
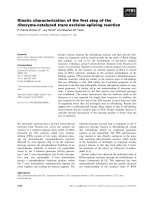
Fig. 2. Pathway reactions included in the
kinetic model of E. histolytica glycolysis.
Dotted boxes represent the reactions that
are branches of the main pathway. The
PFOR and AldDH reactions were lumped
into one reaction (PFOR-AldDH). 1,3 BPG,
1,3-bisphosphoglycerate; acald, acetalde-
hyde; ATPases; ATP consuming activities;
DHases; NAD(P)H consuming activities; PPi
synthesis, ATP consuming activities that
produce AMP and PPi; 3POHpyr, 3-phos-
phohydroxypyruvate; pyr, pyruvate.
Modeling Entamoeba glycolysis E. Saavedra et al.
4926 FEBS Journal 274 (2007) 4922–4940 ª 2007 The Authors Journal compilation ª 2007 FEBS
for metabolic modeling [43]. A scheme of the pathway
reactions considered is shown in Fig. 2. Table S1A in
the Supplementary Material displays the model reac-
tions as written in gepasi, whereas Table S1B summa-
rizes the kinetic parameters values incorporated in the
model. The detailed rate equations are described in the
Experimental procedures.
The model included the K
m
values for substrates
and products for the reactions from HK to PPDK,
which were previously reported by our group at
pH 6.0 [21]. The V
m
values present in the parasite in
the forward and reverse directions, also determined at
pH 6.0 (Table 1), were used. These reactions, including
that of HK, were considered as reversible. The activity
used for ALDO was that determined in the presence of
saturating Co
2+
, because, at the total concentration of
the heavy metals Co
2+
,Zn
2+
and Cu
2+
found in
amoebas (Table 2), this enzyme is expected to be fully
activated [21].
The last glycolytic steps from pyruvate to EtOH cat-
alyzed by PFOR, AldDH and ADH involve the oxida-
tion of NADH. Because there is little kinetic
information on E. histolytica PFOR and AldDH, these
reactions were lumped in a reversible bisubstrate reac-
tion involving NADH oxidation, with its V
m
value
adjusted around 1 UÆmg
)1
as reported for PFOR activ-
ity determined in amoebal 200:NIH strain [36]. Some
kinetic data for amoebal NAD(P)H-ADHs has been
described [44]. These reactions were included as an
irreversible bisubstrate reaction, also involving NADH
oxidation, and using as V
m
the sum of the determined
NADH and NADPH-ADH activities (Table 2). In
addition, the kinetic model required a reversible, gen-
eral NADH consumption reaction (DHases) for bal-
ancing the pool of oxidized and reduced pyridine
nucleotides.
Cellular ATP consuming (ADP generating) processes
(e.g. cellular work, ion ATPases) were included in the
model as ATPases reaction; its rate equation was irre-
versible mass-action with a fitted rate constant.
Entamoeba histolytica lacks cytosolic pyrophosphatases
and relies on PPi as phosphate donor in several meta-
bolic reactions [6,7]; therefore, the most probable PPi
supply comes from biosynthetic processes that also
consume ATP (e.g. DNA and protein synthesis). In
the kinetic model, this PPi supply was explicitly repre-
sented as an ATP-consuming reaction that produces
AMP and PPi (PPi synthesis). The AK reaction was
included to maintain the balance in the adenine-nucleo-
tide pool; its rate equation was dependent on the
equilibrium constant.
To simulate a glycolytic pathway that closer resem-
bles that occurring within the parasite, three glycolytic
branches (glycogen synthesis, glycogen degradation
and serine synthesis) were included in the model; in
their absence, nonphysiological hexose- and triose-
phosphate concentrations were attained.
The glycogen synthesis branch was modeled as an
irreversible mass-action reaction that consumes G6P
and ATP to produce glycogen, ADP and PPi (an
additional source of PPi to that of PPi synthesis);
the glycogen degradation branch was also modeled
as an irreversible mass-action reaction (Fig. 2). There
is high PGM activity (Table 1) but the fluxes
through these branches have not yet been studied in
amoebas. By introducing the PGM V
m
values of 0.3
and 0.87 UÆmg
)1
cellular protein determined at
pH 6.0 and 7.0, respectively, as the glycogen synthe-
sis rate constant (Table 1), severe diminution of all
glycolytic intermediaries to micromolar levels and
one order of magnitude lower glycolytic flux were
observed. Therefore, the glycogen synthesis and gly-
cogen degradation rate constants were fitted (1.5 and
0.1 nmol min
)1
Æmg protein
)1
, respectively) to attain
the physiological metabolite concentrations.
Table 2. Glycolytic metabolite concentrations. NM, not measured;
NS, not simulated; 1,3BPG, 1,3-bisphosphoglycerate.
Metabolite (m
M) Amoebal extracts Model
G6P 6.2 ± 4.1 (5) 1.33
F6P 1.1 ± 0.5 (5) 0.88
F(1,6)P
2
0.43 ± 0.16 (4) 0.12
DHAP 1.15 ± 0.4 (3) 0.42
G3P 0.36 ± 0.09 (3) 0.21
1,3BPG NM 0.09
3PG < 0.28 (6) 0.45
2PG < 0.28 (6) 0.005
PEP < 0.28 (6) 0.0005
Pyruvate 0.92 ± 0.4 (6) 0.7
Acetaldehyde NM 0.02
ATP 5 ± 2 (5) 5.1
ADP 3.3 ± 1.2 (5) 2.4
AMP 1.6 ± 0.2 (3) 2.5
PPi 0.45 ± 0.1 (3) 0.45 (fixed)
Pi 5.4
a
5 (fixed)
NADH NM 0.08
NAD
+
1.5 (2) 1.47
Glycogen 3400
b
1 (fixed)
G1P 0.42 ± 0.15 (3) NS
GTP 1.8 (2) NS
GDP 0.7 (2) NS
Co
2+
0.023 (2) NS
Zn
2+
1.6 (2) NS
Cu
2+
0.12 (2) NS
EtOH flux [nmolÆmin
)1
Æ(mg
cellular protein)
)1
]
39 ± 12 (5) 37
a
Recalculated from [63].
b
Glucose equivalents.
E. Saavedra et al. Modeling Entamoeba glycolysis
FEBS Journal 274 (2007) 4922–4940 ª 2007 The Authors Journal compilation ª 2007 FEBS 4927
The V
m
value of the 3PGDH branch for serine syn-
thesis was adjusted within the same order of magnitude
of the activity value reported by Ali et al. [38] to obtain
the closest physiological concentration of 3PG
(< 0.28 mm ; Table 2). In the absence of this reaction,
3PG elevated to 0.6 mm, which indicated a relevant role
for this branch in the control of metabolite concentra-
tions in the final reactions of the parasite’s glycolysis.
The effect of other amoebal glycolytic branches on
glycolytic flux and intermediary concentrations were
explored: PPP, triglyceride synthesis, alanine transami-
nase and malic enzyme. Because experimental data on
fluxes through these other branches are not available,
their rate constants were fitted; however, their inclu-
sion in the model showed negligible effects on the
intermediary concentrations, glycolytic flux and flux-
control distribution (data not shown).
The metabolites were initialized at the physiological
concentrations displayed in Table 2. Fixed metabolite
concentrations were: 5 mm glucose; 10 mm EtOH;
1mm glycogen; 1 mm 3-phosphohydroxypyruvate;
5mm Pi and 0.45 mm PPi. The conserved moieties
were ATP + ADP + AMP ¼ 9.9 mm and NADH+
NAD
+
¼ 1.55 mm. It is worth noting that, when
including PPi concentration as a dynamic variable of
the model, it was not possible to attain a physiological
stable steady state because the PPi consumption by
PPi-PFK and PPDK (and glycolytic ATP synthesis)
was exceeded by the PPi synthesis rate. Due to the
variety of PPi-generating biosynthetic processes, a true
PPi synthesis rate is difficult to determine; moreover,
further adjustments of the PPi synthesis rate constant
compromised the physiological values of metabolites
and fluxes. Thus, these modeling results indicate the
importance of defining the PPi metabolism in the para-
site because only the absence of cytoplasmic pyrophos-
phatases [6,7] has been characterized, but participating
enzymes and their rate equations and kinetic parame-
ters have not been described.
The present central model does not include the hexose
transport reaction because there are a lack of data
regarding kinetic parameters and difficulties in deter-
mining the actual activity in the absence of glucose
phosphorylation. However, the inclusion of the glucose
transport may have an impact on the control distribu-
tion [30,32] and therefore the effects of its incorporation
in the model were evaluated by using the few available
data (for the model, see supplementary Doc S1).
Steady-state properties of the kinetic model
In most of the explored conditions the simulations
reached an asymptotically stable steady state, indicat-
ing that the kinetic simulation displays a hyperbolic
pattern that is able to reach an asymptote.
To validate the construction of the kinetic model
described above, the metabolite concentrations and
glycolytic flux, experimentally determined when the
cells were under glycolytic steady-state conditions,
were used as reference. The predicted glycolytic flux
(37 nmol EtOHÆmin
)1
Æmg protein
)1
) agreed with the
values determined in amoebas (Table 2). Model simu-
lations approached 0.2- to one-fold the level of
the in vivo metabolite concentrations for G6P, F6P,
F(1,6)P
2
, DHAP, G3P, 3PG, pyruvate, ATP, ADP
and NAD
+
(Table 2). The model also predicted very
low concentrations for 2-phosphoglycerate (2PG) and
phosphoenolpyruvate (PEP), which are below the lim-
its of detection of the experimental assays, but they
were similar to the low values reported in other cells
[35,45]. Significant deviation was attained for AMP,
which was 1.6-fold higher than the physiological value
(Table 2).
Flux-control distribution
Analysis of the enzyme activities at pH 6.0 as
determined in amoebal clarified extracts (Table 1)
and the modeled fluxes through the enzymes
(Table 3) indicated that HK and PGAM were work-
ing at 32–33% of their V
m
values and that these
enzymes were working closer to saturation than the
other pathway enzymes (see below). In consequence,
the HK and PGAM elasticities were lower in com-
parison with those of the other pathway enzymes
(Table 3). The low elasticities determined their high
flux-control coefficients (C
J
HK
¼ 0.73; C
J
PGAM
¼ 0.65;
Table 3), indicating that HK and PGAM were
indeed the main controlling steps of amoebal glyco-
lysis. Other glycolytic enzymes displayed small but
significant flux-control coefficients in the interval of
0.08–0.13 [PPi-PFK, ALDO, glyceraldehyde 3-phos-
phate dehydrogenase (GAPDH), enolase (ENO),
HPI; Table 3].
For reactions outside the pathway, the glycogen syn-
thesis and 3PGDH reactions showed high control
(C
J
glycogen synthesis
¼ –0.32; C
J
3PGDH
¼ –0.18). Notoriously,
glycogen synthesis mainly modulated the hexosephos-
phate concentrations, with a stronger effect on the
F(1,6)P
2
level. On the other hand, the flux through the
3PGDH reaction affected the 3PG and pyruvate con-
centrations, and final EtOH flux. The glycogen degra-
dation reaction displayed low flux control under these
conditions; however, at low HK activities, this branch
became important in supplying G6P for glycolysis. The
model predictions indicated that the ATP demand for
Modeling Entamoeba glycolysis E. Saavedra et al.
4928 FEBS Journal 274 (2007) 4922–4940 ª 2007 The Authors Journal compilation ª 2007 FEBS
cellular processes (cellular function represented by
ATPases and PPi synthesis) exhibited high flux control
over glycolysis (C
J
ATPases þ PPi synt
¼ –0.32; Table 3). PPi
provides a link between glycolysis and anabolic path-
ways and hence, variation in its steady-state concentra-
tion (by modulating the PPi synthesis reaction) may
affect the control distribution of glycolysis.
The model predicted that most enzymes displayed
over-capacity for the glycolytic flux (Tables 1 and 3)
and, in particular, the fluxes through PPi-PFK and
PPDK were 10% their forward V
m
values in amoebas.
The steady-state intracellular amoebal concentrations
of their respective substrates and products for these
two enzymes (Table 2) were all above or around the
K
m
values (Table S1B). Under these conditions, their
elasticity coefficients were still relatively high (Table 3)
and then they were not significant flux-controlling
steps.
Why an enzyme controls flux?
The elasticity coefficient (e
Ei
X
) is defined as the ratio of
relative change in the local rate of a pathway enzyme
(Ei) to the relative change in a ligand, denoted as X (the
concentration of an effector, e.g. substrates, products,
inhibitors or activators) [24]. The connectivity theorem
states that the sum of the flux-control coefficients of all
pathway enzymes (Ei) affected by a common metabolite
X and multiplied by their respective elasticity coeffi-
cients towards X, is zero ð
P
i
C
J
Ei
e
Ei
X
¼ 0Þ [24]. The phy-
siological significance of the connectivity theorem is
easily visualized when considering that an enzyme satu-
rated by its substrate cannot further increase its rate (it
is working at maximal capacity or under V
m
conditions,
and its elasticity is near zero), thus establishing a con-
straint to the pathway flux; therefore, such an enzyme
displays high flux-control coefficient.
Table 3. Fluxes, elasticity coefficients for substrates (e
Ei
S
) and products (e
Ei
P
) and flux-control coefficients (C
J
Ei
) of the kinetic model.
Enzyme Flux (nmolÆmin
)1
) e
Ei
S
e
Ei
P
C
J
Ei
HK 31.4 Gluc 0.12 G6P )0.0008 0.73
ATP 0.55 ADP )0.001
AMP )0.66
HPI 21.8 G6P 4.1 F6P )3.9 0.08
PPi-PFK 21.8 F6P 2.3 F(1,6)P
2
)1.9 0.13
PPi 2.3 Pi )2.0
ALDO 21.8 F(1,6)P
2
2.8 DHAP )2.6 0.09
G3P )2.4
TPI 21.8 DHAP 72 G3P )71 0.003
GAPDH 43.6 G3P 5.7 1,3BPG )5.5 0.08
NAD 5.6 NADH )5.5
PGK 43.6 1,3BPG 12.1 3PG )11.5 0.04
ADP 11.9 ATP )11.9
PGAM 37 3PG 0.74 2PG )0.11 0.65
ENO 37 2PG 0.94 PEP )0.01 0.08
PPDK 37 PEP 1.0 Pyruvate )0.65 0.0009
AMP 1.0 ATP )1.0
PPi 1.0 Pi )1.0
PFOR-AldDH 37 Pyruvate 0.62 Acetaldehyde )0.14 0.001
NADH 0.88 NAD )0.53
ADH 37 Acetaldehyde 0.91 0.0001
NADH 0.34
Glycogen synthesis 10 G6P 1.0 )0.32
ATP 1.0
Glycogen degradation 0.5 Glycogen 1.0 0.01
Pi 1.0
3PGDH 6.7 3PG 0.33 )0.18
NAD
+
0.02
ATPases 10 ATP 1.0 )0.04
AK 4 ADP 6286 ATP )3142 0.0001
AMP )3142
PPi synthesis 33 ATP 1.0 )0.28
DHases 24 NAD+ 6.2 NADH )5.2 )0.08
E. Saavedra et al. Modeling Entamoeba glycolysis
FEBS Journal 274 (2007) 4922–4940 ª 2007 The Authors Journal compilation ª 2007 FEBS 4929
The elasticity coefficients of the pathway enzymes
for effectors are shown in Table 3. As expected for the
high flux control displayed by HK, the values of its
elasticity coefficients were the lowest among all the
enzymes, with values of 0.12 and 0.55 for glucose and
ATP, respectively. HK also exhibited low sensitivity
towards its products G6P and ADP and modulator
AMP. PGAM also showed relatively low elasticities
towards 3PG and 2PG.
As deducted from their low flux-control coefficients,
the other pathway enzymes showed comparatively
higher elasticity coefficients towards their substrates
whereas their elasticities towards products displayed
essentially similar values to those for the substrates but
with a negative sign.
Together, the results indicated that HK strongly
flux-controlled amoebal glycolysis because of its low
activity in amoebal extracts and because of the low
sensitivity toward its substrates and AMP derived from
saturation (Table 3). Due to the similar elasticity
towards ATP and AMP, HK inhibition by AMP
might have physiological significance because the
enzyme is strongly inhibited by this metabolite with a
K
i
value of 36 lm at pH 6.0 [21], a value three-fold
lower than the K
m
for ATP (121 lm at pH 6.0) [21],
and because the physiological AMP steady-state level
(1.6 mm) is 44-fold higher than the K
i AMP
. Amoebal
HK exhibits a mixed-type inhibition by AMP [21];
therefore, the influence of the competitive inhibitory
component (effect on K
m ATP
) might be not as determi-
nant on the enzyme activity because physiological ATP
concentration (5 mm; Table 2) might overcome this
inhibition; however, the noncompetitive inhibitory
component (effect on V
m
) might still be relevant to
modulate the HK activity.
Concentration control coefficients
Similarly to the flux-control distribution (Table 3), the
control of the concentration of most glycolytic metab-
olites mainly resided in HK, PGAM, glycogen synthe-
sis, ATPases, PPi synthesis and 3PGDH reactions
(Table 4). The pyruvate concentration was also signifi-
cantly controlled by the lumped reaction of PFOR and
AldDH (PFOR-AldDH) and DHases reactions. In
turn, the controlling order for the ATP concentration
was PPi synthesis > PGAM > glycogen synthe-
sis % HK (Table 4).
Variations to the HK rate expression
The kinetic model was used to determine the effect of
varying the HK activity on flux rate and flux-control
distribution in an attempt to further understand the
underlying mechanism by which this enzyme has high
control on the flux.
As described in the construction of the amoebal
model, the HK equation was considered as a reversible
Table 4. Concentration control coefficients obtained with the kinetic model. The values shown are the concentration control coefficients, for
which the net sum gives approximately 0. TPI, PGK, glycogen degradation and AK reactions did not exert significant control on the metabo-
lite concentrations and therefore they were not included.
Enzyme
Metabolite
G6P F6P F(1,6)P
2
DHAP G3P 1,3BPG 3PG 2PG PEP Pyruvate Acetaldehyde ATP ADP AMP NADH NAD
+
HK 2.5 2.4 2.59 1.29 1.29 1.38 1.1 0.81 2.3 1.6 0.87 0.2 )0.07 )0.33 )0.17 –
HPI 0.09 0.33 0.36 0.18 0.18 0.19 0.12 0.34 0.17 0.092 0.06 )0.098 – –
PPi-PFK 0.15 0.13 0.61 0.3 0.3 0.33 0.2 0.15 0.58 0.29 0.16 0.1 )0.03 )0.17 – –
ALDO 0.1 0.09 0.06 0.2 0.2 0.23 0.14 0.1 0.4 0.2 0.1 0.07 )0.02 )0.11 – –
GAPDH 0.09 0.08 0.05 0.02 0.01 0.2 0.12 0.09 0.35 0.18 0.095 0.06 )0.02 )0.1 – –
PGAM 0.79 0.69 0.55 0.2 0.2 0.31 )0.36 0.74 2.9 1.5 0.79 0.46 )0.16 )0.79 )0.2 0.01
ENO 0.09 0.08 0.06 0.02 0.02 0.04 – )0.98 0.33 0.17 0.09 0.05 )0.02 )0.09 – –
PPDK – – – – – – – – )0.98 – – – – – – –
PFOR-AldDH – – – – – – – – )1.0 )1.6 – – – – – –
ADH – – – – – – – – – )0.25 )1.1 – – – – –
Glycogen
synthesis
)1.36 )1.35 )1.5 )0.76 )0.8 )0.8 )0.49 )0.36 )1.4 )0.7 )0.38 )0.24 0.08 0.4 – –
3PGDH )0.3 )0.3 )0.37 )0.2 )0.2 )0.36 )0.27 )0.2 )0.7 )0.5
)0.25 )0.07 0.13 0.14 –
ATPases )0.28 )0.29 )0.33 )0.17 )0.18 )0.18 – – )0.34 – – )0.09 0.03 0.15 – –
PPi
synthesis
)1.8 )1.9 )2.14 )1.1 )1.1 )1.18 )0.42 )0.32 )2.2 )0.6 )0.33 )0.57 0.2 0.97 – –
DHases )0.09 – – – – )0.2 )0.13 – )0.54 )0.46 )0.17 )0.06 – 0.1 0.2 )0.01
Modeling Entamoeba glycolysis E. Saavedra et al.
4930 FEBS Journal 274 (2007) 4922–4940 ª 2007 The Authors Journal compilation ª 2007 FEBS
reaction because it has been previously documented
that significant changes in the control structure of a
pathway are attained by introducing reversibility in all
pathway reactions, even in those with very large K
eq
values [46–48]. It should be remarked, however, that
including reversibility in reactions with high K
eq
requires the fitting and some times the guessing of
kinetic parameters that cannot be easily determined
(K
m
for products, V
m
in the reverse reaction). Under
near-physiological conditions, the HK reaction is
quasi-irreversible due to its high K
eq
value (1.6–
3.9 · 10
2
) [49]. Therefore, it was interesting to evaluate
the effect of changing the rate equation of this step in
the pathway behavior.
The reversible HK rate equation with mixed inhibi-
tion by AMP was replaced for an irreversible rate
equation with mixed-type inhibition by AMP and
competitive inhibition by ADP (which was previously
demonstrated in studies with the purified enzyme)
[21]. In comparison to the model with HK revers-
ible reaction, this kinetic model predicted two orders
of magnitude lower flux through HK, with a conco-
mitant diminution in the glycolytic flux
(1.1 nmol EtOHÆmin
)1
Æmg cellular protein
)1
) and three
orders of magnitude decrease in the intermediary con-
centrations. Under these conditions, the glycogen deg-
radation reaction was the main flux-control step
(C
J
glycogen degradation
¼ 0.78). The cause for the drastic
decreased in HK rate when using the irreversible equa-
tion was that the AMP inhibition predominated
because two orders of magnitude increase in the HK
K
i AMP
value restored the flux and metabolite concen-
trations values to those obtained when using the HK
reversible equation. To further evaluate the contribu-
tion of AMP inhibition to the HK flux-control coeffi-
cient in the main model with HK reversible reaction,
two conditions were explored.
First, the inhibitory component of AMP was elimi-
nated from the bireactant reversible reaction of HK
(see Experimental procedures); in other words, K
i AMP
became very large. Under this condition, there was a
2.3-fold increase in the flux through HK, an increase
in the glycolytic flux (58 nmol EtOHÆmin
)1
) and two-
to four-fold increase in the intermediary concentra-
tions. The HK reaction still retained the highest flux
control.
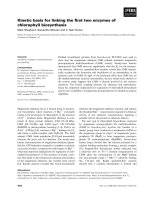
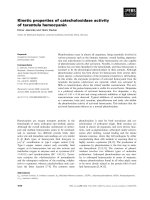
Second, using the HK reversible equation with
mixed inhibition by AMP, the effect of varying the
HK K
i AMP
value was examined (Fig. 3). The pathway
flux was highly sensitive to variation in the HK K
i AMP
value. Under these conditions, the glycogen degrada-
tion reaction gained flux control at the lowest HK
K
i AMP
values.
These results indicated that HK inhibition by AMP,
in addition to modulating the activity of the enzyme,
may also be a mechanism for regulating the pathway
metabolite concentrations and flux-control distribution.
Because no cooperative modulation has been detected
in amoebal glycolytic enzymes, the AMP inhibition of
HK appears to be the sole mechanism of direct trans-
ference of information from outside (ATPases, PPi
synthesis, glycogen synthesis) and the end (PPDK) to
the initial part of the pathway. Consequently, the mod-
ulation of the AMP concentration might be an addi-
tional mechanism for controlling the glycolytic flux in
this parasite.
Enzyme titration for the identification
of drug targets
MCA of the kinetic model allows for the determina-
tion of the flux-control coefficients of the pathway
enzymes. In addition, the kinetic model is a helpful
tool for predicting the pathway behavior when inhibi-
tion of some enzymes is evaluated. If the model closely
reproduces the in vivo behavior, then the metabolic
modeling approach would be an adequate tool for iden-
tifying the best drug targets in a metabolic pathway
0.016 0.020 0.024 0.028 0.032 0.036
0
20
40
60
80
100
% flux
HK Ki
AMP
(mM)
Fig. 3. Effect of varying the HK K
i
for AMP on glycolytic flux. An
interval of 1–36 l
M is reported for the K
i AMP
values of amoebal
HKs, either native or recombinant, at the pH range of 6.0–8.5 [19–
21]. For these simulations, 100% glycolytic flux was 37 nmol
EtOH ⁄ (minÆmg cellular protein
)1
). The b-values (i.e. the K
m
modifier
in the interaction between glucose and AMP with the enzyme in
the HK rate equation; see Experimental procedures) were 1 (line)
and 1.5 (dashed). By contrast, changing the c-value (i.e. the K
m
modifier in the interaction between ATP and AMP with the
enzyme) did not induce significant alteration of the K
i AMP
versus
pathway flux plot (data not shown).
E. Saavedra et al. Modeling Entamoeba glycolysis
FEBS Journal 274 (2007) 4922–4940 ª 2007 The Authors Journal compilation ª 2007 FEBS 4931
for therapeutic intervention [50]. However, it should be
noted that significant inhibition of an enzyme may
probably take the parasite’s metabolism to another
steady state and the flux-control distribution may also
change.
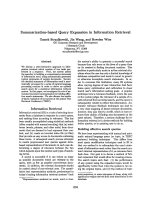
The kinetic model allows the relationship between
glycolytic flux and a given enzyme activity to be stud-
ied (Fig. 4). Thus, HK, PGAM and the PPi-dependent
PPi-PFK and PPDK activities were varied in the
model to establish how much these potential drug tar-
gets should be inhibited for attaining significant decre-
ment in the glycolytic flux and ATP concentration. To
decrease the flux by 50%, HK or PGAM needed to be
inhibited by 24% and 55%, respectively (Fig. 4). By
contrast, to achieve a similar flux decrease by inhibit-
ing PPi-PFK or PPDK, their activities need be reduced
by 73% and 92%, respectively (Fig. 4). Furthermore,
the simultaneous diminution of HK and PGAM activi-
ties showed that, to attain a 50% decrease in flux, only
an 18.3% inhibition was required. On the other hand,
to reduce the ATP concentration by 50%, PGAM
should be inhibited by 60% or by 18.6% both
HK + PGAM.
Discussion
A kinetic model of E. histolytica glycolysis was con-
structed based on the kinetic properties of amoebal
glycolytic purified enzymes previously determined by
our research group [21]; enzyme activities in amoebal
extracts were measured under the same experimental
conditions of buffer and physiological pH value (6.0)
and temperature (37 °C). When determining the V
m
values for the forward and reverse reactions (Table 1),
care was taken to calculate the enzyme activities under
true V
m
conditions (i.e. in the presence of saturating
substrate concentrations, at least ten-fold the K
m
value,
and in the absence of products). In addition, glycolytic
flux and metabolite concentrations were determined in
trophozoites under steady-state conditions.
In the present model, adjusting the kinetic parame-
ters of the glycolytic enzymes to achieve a better model
fitting to the measured metabolite concentrations was
kept to a minimum. However, the kinetic properties of
the PFOR and AldDH reactions and those of the
branching reactions were indeed adjusted because they
have not been thoroughly studied as yet. In all the
conditions tested, the model simulations reached an
asymptotically steady-state condition, as long as the
PPi concentration was kept constant. When the PPi
level was variable, the model was unable to maintain
the PPi concentration at a physiological level that suf-
ficed for the demand from PPi-PFK and PPDK. This
result clearly indicated that the amoebal PPi metabo-
lism should be experimentally evaluated for further
refinement of the present kinetic glycolysis model.
Then, the available in vitro kinetics did not fully
account for the in vivo observed behavior. However,
by fixing the PPi concentration, the model closely
reproduced the pathway behavior under the experi-
mental conditions tested in live parasites.
Several kinetic models have been described for gly-
colysis in erythrocytes [25], tuber tissue potato [28],
trypomastigote stage of the parasite T. brucei [29–31]
and S. cerevisiae [32,33]. An improvement introduced
in the models of T. brucei and yeast was that most of
the kinetic parameters used were determined in
enzymes from the same source and under similar
experimental conditions. This certainly circumvented
the problem of combining kinetic data obtained under
different conditions and from different sources, a diffi-
culty frequently encountered when kinetic models of
different metabolic pathways have been constructed.
However, an inconvenience found in trypanosome and
yeast models is that, in the rate equations describing
most of the glycolytic enzyme reactions, the authors
used K
eq
values taken from the literature, which, in
most cases, were determined under nonphysiological
conditions. In addition, the K
m
values for some prod-
ucts were only adjusted because they were not experi-
mentally determined. In the kinetic model described in
the present work, the influence of using K
eq
in the rate
equations was eliminated by introducing the actual V
m
0
0 20 40 60 80 100
20
40
60
80
100
PPDK
PGAM
PPi-PFK
HK
HK + PGAM
flux (%)
enzyme activity (%)
Fig. 4. Dependence of glycolytic flux on enzyme activity. In this
plot, 100% enzyme is the corresponding V
m
value determined in
amoebal extracts at pH 6.0 (Table 1); 100% flux is 37 nmol EtOH ⁄
(minÆmg cellular protein
)1
), which is the flux through the ADH reac-
tion (Table 3). In all enzyme titrations, a decrease of the V
m
f value
was accompanied by a proportional decrease in the V
m
r value.
Modeling Entamoeba glycolysis E. Saavedra et al.
4932 FEBS Journal 274 (2007) 4922–4940 ª 2007 The Authors Journal compilation ª 2007 FEBS
values in the reverse reaction of each enzyme, as well
as the K
m
values of products, which were experimen-
tally determined under the same conditions used for
the forward reaction [21].
MCA of the pathway modeling indicated that HK,
PGAM, ATP consuming reactions (ATPases and PPi
synthesis), glycogen synthesis and 3PGDH were the
main controlling steps of glycolytic flux in amoebal
trophozoites. The amoebal HK inhibition by AMP has
been considered as an important regulatory mechanism
in studies with the purified enzyme [19–21]. However,
this inhibition takes a new level of importance when
studying the functioning of HK as part of a pathway,
revealing that a control mechanism of the glycolytic
flux in amoebas may be by regulating the activity of
the first enzyme of the pathway through the balance in
the adenine nucleotide pool. In addition to the low
level of active enzyme present in the parasite, this
AMP regulatory mechanism confers HK with the
property of having one of the highest flux-control coef-
ficients as predicted by models with either reversible or
irreversible HK rate equation.
Feedback inhibition in metabolic pathways is an
efficient mechanism of metabolite homeostasis, partic-
ularly in pathways that have reactions with large K
eq
[46,47]. In this regulatory mechanism, the K
i
value of
the sensing enzyme determines the steady-state con-
centration of its product, and consequently that of
the subsequent metabolites, but it does not signifi-
cantly affect the pathway flux [48]. Glycolysis in
E. histolytica apparently lacks mechanisms of feed-
back inhibition, although it still has one reaction
(HK) with a large K
eq
. Because G6P (or ADP) does
not exert significant product inhibition on HK, there
should be an alternative regulatory mechanism that
transfers information from the ending to the initial
part of the pathway, under which conditions a stable
steady state may be reached [47]. As transfer informa-
tion between pathway reactions was ensured in the
model by introducing all reactions as reversible [47],
a stable steady state was reached, even when the HK
reaction was assumed irreversible (but with AMP
inhibition).
AMP potently inhibits HK activity by a mixed-type
mechanism [21]. Similarly to a feedback inhibition
mechanism, variation of the K
i
value of HK for AMP
affected the steady-state concentration of the hexoses
phosphate (data not shown) but, in contrast to a feed-
back inhibition [46,48] it also significantly changed the
pathway flux (Fig. 3). Therefore, AMP inhibition on
HK may have an impact on the metabolite concentra-
tions (homeostatic role), as well as on the pathway
flux.
Interestingly, PGAM displayed a significant flux-
control coefficient, most probably because the amount
of active enzyme is low in the parasite (Table 1). This
pattern correlated with previous observations reveal-
ing that the purified enzyme has one of the lowest
catalytic efficiencies and a low affinity for its sub-
strate in comparison to the other amoebal purified
glycoytic enzymes [21]. In addition, the amoebal
PGAM is not functionally or structurally related to
the human enzyme because it is 2,3-bisphosphoglycer-
ate-independent [21]. These characteristics make
PGAM and HK suitable drug targets for therapeutic
intervention. It should be noted that, as predicted by
the model, the sole inhibition of amoebal HK may
bring about a greater contribution of glycogen degra-
dation in supplying G6P for glycolysis, thus keeping
ATP synthesis unaltered, or within physiological
levels, for a short period of time. Due to the large
content of stored glycogen, it is possible that amoe-
bas may have time to find ways of eliminating the
HK (and glucose transporter) inhibitors. Therefore, a
better strategy for killing the parasites may be to
simultaneously target the two main controlling
enzymes, HK and PGAM. With this strategy, the
model predicted that glycolytic flux and ATP concen-
tration can be drastically decreased by only inhibiting
18% these two enzymes (cf. Fig. 4).
We conclude that the present kinetic model of
E. histolytica glycolysis, with a fixed PPi concentration,
can describe the in vivo pathway behavior under the
experimental conditions in which the parasites were
evaluated (using external glucose as carbon source).
However, in addition to maintaining constant the PPi
concentration, another deficiency of the present model
rests on the adjusted steps necessary to achieve the
metabolite concentrations found in vivo. According to
the modeling results, it is relevant to experimentally
determine the fluxes through glycogen synthesis and
degradation, serine synthesis and ATP consuming and
PPi-generating reactions for further rigorous validation
of the model. In addition, it is difficult to extrapolate
the modeled behavior of glycolysis, which was based
on data from amoebal cultures, to a more realistic sit-
uation in which the parasites are colonizing the intes-
tine because of the impossibility of reproducing the
intestine’s microenvironment in the laboratory and
because very little is known about the metabolism
under this condition.
There has been accumulating experimental evidence
in several cellular types that glucose transport con-
tributes > 50% to the control of glycolysis
[14,15,25,30,32,35,51]. From the perspective of kinetic
models, it has also been demonstrated that hexose
E. Saavedra et al. Modeling Entamoeba glycolysis
FEBS Journal 274 (2007) 4922–4940 ª 2007 The Authors Journal compilation ª 2007 FEBS 4933
transporter (HXT) significantly contributes to flux
control in yeast and T. brucei glycolysis [30,32,51].
Therefore, we cannot rule out a possible important
contribution of the amoebal HXT to the control of
glycolytic flux, as previously suggested in early stud-
ies by Serrano and Reeves [52,53]. A preliminary
kinetic model provided in the Supplementary Mate-
rial that includes the amoebal glucose transporter
indicated the importance of this reaction to the flux-
control distribution. For these reasons, it is necessary
to carry out an extensive experimental kinetic study
of amoebal HXT, which may very likely help to bet-
ter distinguish the contribution of HK and HXT to
the glycolytic flux control. Moreover, according to
the genome sequence data, the glucose transporters
in amoebas more closely resemble the bacterial type
[54]; and the kinetic characterization of glucose
transport in amoebas described earlier [52,53]
revealed properties different to those exhibited by
glucose transporters in human cells (e.g. higher affin-
ity for glucose than for 2-deoxyglucose, and insensi-
tivity to phlorrhizin).
From a therapeutic point of view, the kinetic
model can predict the values of fluxes and metabolite
concentrations that may be achieved when one or
more pathway enzymes are inhibited. The results of
the simulations indicate that HK and PGAM inhibi-
tion might have larger negative effects on glycolytic
flux and metabolite concentrations than inhibition of
the PPi-dependent enzymes PPi-PFK and PPDK.
Although the latter two enzymes are still appropriate
drug targets because of their divergence with respect
to the ATP-PFK and PYK enzymes present in
humans [22,23,55–57], their negligible flux-control
coefficients demand the design of highly potent and
very specific inhibitors for the parasite’s enzymes or
the full blockade of their gene transcription or trans-
lation. These two PPi-dependent enzymes exhibited
activity thresholds above 70% of total active enzyme,
thus making it difficult to apply specific drugs to
effectively kill the parasite. Moreover, the response
of these enzymes to inhibitors such as bisphospho-
nates [57], which are nonhydrolyzable analogs of PPi,
may depend on the concentration of this metabolite
within the cell if the inhibition mechanism is compet-
itive. In this regard, with the amoebal kinetic model,
the type of inhibitor that is best for each amoebal
enzyme and transporter can be evaluated not only to
inhibit the enzyme in the test tube, but also to exam-
ine whether the inhibition has significant effects on
the pathway flux and metabolite concentrations in
the parasite.
Experimental procedures
Chemicals
Enzymes
ADH, ALDO, G6PDH, GAPDH, Gly3PDH,
Gly3PDH ⁄ triosephosphate isomerase (TPI), HK, HPI,
lactate dehydrogenase (LDH), PYK, and PYK ⁄ LDH were
obtained from Roche (Manheim, Germany); TPI was
obtained from Sigma (St Louis MO, USA); PGAM,
PPi-PFK, phosphoglycerate kinase (PGK) and ENO were
obtained from E. histolytica [21].
Reagents
ATP, ADP, AMP, F6P, F(1,6)P
2
, glucose, G6P, GTP and
NADP
+
were obtained from Roche; AsO
4
, bis-tris pro-
pane, cysteine, glucose 1-phosphate, GDP, G3P, Gly3P,
MgCl
2
, NADH, PEP, 2PG, 3PG, pyridoxal 5-phosphate,
pyruvate and pyrazole were obtained from Sigma; DHAP
was obtained from Fluka (Buchs, Switzerland); EtOH,
CoCl
2,
PPi, and acetaldehyde were obtained from
J. T. Baker (Estado de Me
´
xico, Me
´
xico).
Glycolytic enzymes activities in amoebal
trophozoites
E. histolytica trophozoites strain HM1:IMSS were isolated
from experimentally induced amoebic liver abscess in ham-
sters and cultured in TYI-S-33 medium as previously
described [18]. Amoebas (1–2 · 10
8
) were harvested by
chilling on ice, centrifuging at 450 g (IEC Centra CL3R;
Needham Heights, MA, USA) and washing twice with
NaCl ⁄ Pi at pH 7.4. Clarified extracts to measure glycolytic
enzyme activities were prepared by freezing–thawing and
centrifugation as previously described [18]. Aliquots of the
soluble fraction were stored at )20 °C in the presence of
10% (v ⁄ v) glycerol. Cellular protein was determined by the
Lowry method. Protein in the soluble fraction corresponded
to 1.25 ± 0.5 mg protein per 10
6
cells (n ¼ 5). Total cellu-
lar protein was 2 ± 0.8 mg protein per 10
6
cells (n ¼ 4).
Enzyme activities from HK to PPDK in the forward and
reverse reaction (Table 1) were measured at 37 °C and physi-
ological pH values of 6.0 and 7.0 because the actual cytosolic
pH in amoebas has not been directly determined, and only
indirect evidence [58] suggests that it may be similar to the pH
of the medium, which varied along the time of culture (6.3–
6.7). The pH buffer mixture was 50 mm imidazole, 10 mm
each of acetate, Mes and Tris at the indicated pH. Amoebal
soluble fraction was added in aliquots of 0.01–0.5 mg protein
to coupled assays with commercial or amoebal glycolytic
enzymes as previously described [21]. Rates were monitored
spectrophotometrically at 340 nm following the NADH
Modeling Entamoeba glycolysis E. Saavedra et al.
4934 FEBS Journal 274 (2007) 4922–4940 ª 2007 The Authors Journal compilation ª 2007 FEBS
oxidation or NADP
+
reduction using saturating concentra-
tions of substrates and coenzymes. The reactions were always
started with specific substrates, and basal activities in their
absence were always subtracted. Amoebal PYK activity was
measured in the presence of 0.2 mm F(1,6)P
2
as previously
described [18]. In the presence of this activator, amoebal
PYK displays the same activities at pH 6.0 and 7.0. ATP-
PFK activity was measured in a similar assay to that of the
PPi-PFK [21] except that 1 mm ATP was used instead of PPi.
NAD
+
and NADP
+
-dependent ADH activities were mea-
sured in 50 mm sodium pyrophosphate buffer pH 7.0 or 6.0,
0.15 mm NADPH and 4 mm acetaldehyde. NAD
+
-ADH
activity in the reverse reaction was measured in pyrophos-
phate buffer with 2 mm NAD
+
,10mm cysteine and 340 mm
EtOH. AldDH activity was measured in the ADH assay buf-
fer in the presence of 40 mm pyrazole to inhibit the ADH
activity. The activity of 3PGDH in the direction of 3PG con-
sumption was measured under several conditions at pH val-
ues of 6, 7 and 8 with 1–3 mm 3PG; however, in all trials, the
activity was below the limit of detection of the method.
The activity of AK in clarified extracts was measured
with two coupled assays: (a) production of ADP from ATP
and AMP using PEP and PYK ⁄ LDH as coupling system
and (b) production of ATP and AMP from ADP and cou-
pling to PEP, amoebal PPDK and LDH. However, the
specificity of both assays could not be directly ascribed to
AK because of the presence of contaminating activities (sig-
nificant basal activity in the absence of AMP in the first
case and presence of an ADP-consuming activity in the sec-
ond case). The activity of ATPases was monitored as ADP
production in a reaction containing pH buffer mixture,
5mm MgCl
2
, 1.2 mm PEP, 0.13 mm NADH and 5 U
PYK ⁄ LDH with 3 mm ATP as substrate. The reaction was
started by adding an aliquot of the soluble fraction of the
cellular extract, thus discarding the effect of contaminating
ADP from the ATP stock solution.
NAD(P)H consumption activities (DHases) were mea-
sured in buffer mixture in the presence of 0.13 mm NADH
or NADPH and following the oxidation of the coenzymes
after adding an aliquot of the soluble fraction of the amoe-
bal extracts. However, the actual activity of this enzyme
group might have been underestimated because most
DHases require a second substrate for activity, which was
not supplied.
Gly3PDH activity was measured in the soluble fraction
of amoebal extracts in the forward (0.15 mm NADH and
2mm DHAP) and reverse direction (1.5 mm NAD
+
,5mm
cysteine, 5 U amoebal TPI and 1.5 mm glycerol-3P). In
both assays, however, the activity was not detected after
starting the reaction with either the extract or the substrate.
PGM activity was measured in the soluble fraction of
amoebal extracts in buffer mixture in the presence of
0.02 mm glucose 1,6-bisphosphate, 1 mm EDTA, 5 mm
MgCl
2
,1mm NADP
+
and 3 U G6PDH. The reaction was
started by adding 4 mm G1P.
Alanine transaminase was measured in buffer mixture in
the presence of 0.15 mm NADH, 0.11 mm pyridoxal
5-phosphate, 15 mm 2-oxoglutarate and 3 U LDH. The
activity was not detected in the soluble fraction of amoebal
extracts after adding up to 50 mm alanine.
Intermediary metabolite concentrations under
steady-state conditions
Trophozoites previously harvested and washed as
described above, were re-suspended in NaCl ⁄ Pi buffer of
pH 7.4 to a density of 2–4 · 10
7
cellsÆmL
)1
. The cells
were incubated at 35 °C for 1 h in the presence of
10 mm glucose in a closed 50 mL plastic tube with gentle
agitation to avoid clogging. The tube was opened every
15 min to favor gas exchange. After this time, approxi-
mately 98% of the cells were viable as determined by
trypan-blue exclusion. The cell samples were treated with
3% (v ⁄ v) ice cold-perchloric acid in the presence of
1mm EDTA and centrifuged; the supernatant was neu-
tralized with different volumes of a solution of 3 m
KOH ⁄ 0.1 m Tris and stored at )70 °C. Metabolite con-
centrations were determined by similar assays to those
used to measure the enzymatic activities with the recom-
binant enzymes [21], except that aliquots (5–300 lL) of
the neutralized amoebal extracts were added instead of
the specific substrate and the reactions were initiated with
specific enzyme. All determinations were carried out in
2 mL of reaction mixture in fluorimetric cuvettes in a
spectrofluorometer (Shimadzu, Kyoto, Japan) or in quartz
cuvettes in a spectrophotometer, depending on the metab-
olite content. Concentrations of metabolites listed in
Table 2 were calculated by assuming that amoebal troph-
ozoites have a volume of 20 lL per 10
7
cells.
Glucose 1-phosphate was determined in an enzymatic
assay coupled with PGM (Roche Molecular Biochemicals,
Mannheim, Germany) and G6PDH as previously described
[49].
GTP and GDP were determined in samples of amoebal
perchloric acid extracts prepared as described above.
Nucleotides were separated and quantified by anion
exchange chromatography on a Mono Q HR5 ⁄ 5 column
(Pharmacia Biotech, Upssala, Sweden) using an High
Performance Liquid Chromatography System (Waters
Corporation, Milford, MA, USA). Samples were loaded
on the column previously equilibrated in 5 mm
NH
4
H
2
PO
4
at pH 2.8 and eluted in 25 min with a linear
gradient of NH
4
H
2
PO
4
up to 750 mm at pH 3.7 and a
flow rate of 1 mLÆmin
)1
. Detection was at 254 nm. After
separation, peaks were integrated and quantified using
calibration curves of standard nucleotides.
Divalent metal concentration for cobalt, zinc and copper
were determined in amoebal acidic extracts by atomic
absorption spectrometry as previously described [59].
E. Saavedra et al. Modeling Entamoeba glycolysis
FEBS Journal 274 (2007) 4922–4940 ª 2007 The Authors Journal compilation ª 2007 FEBS 4935
Kinetics of EtOH production
Amoebas were incubated as described above for the determi-
nation of metabolites, except that at several time points, an
aliquot of 500 lL equivalent to 2 · 10
6
cells was withdrawn
for perchloric acid extraction and neutralization. EtOH was
determined enzymatically by measuring NAD
+
reduction
with commercial ADH in an assay mixture containing
50 mm bis-Tris-propane pH 9.0, 2 mm NAD
+
and 20 mm
cysteine. The reaction mixture was incubated in the absence
of extract to achieve full exhaustion of contaminating EtOH;
then, an aliquot (5–10 lL) of the cellular extract was added.
Description of the model
The glycolytic pathway in E. histolytica was simulated by
using the software gepasi[43] (available at http://www.
gepasi.org). Reactions were represented in the program as
described in Table S1A of the Supplementary Material. The
model was based on the K
m
values for substrates and prod-
ucts and K
i
values for modifiers previously described for
amoebal HK, HPI, PPi-PFK, ALDO, TPI, GAPDH, PGK,
PGAM, ENO and PPDK determined at 37 °C and pH 6.0 or
7.0 [21]. Maximal rate values (V
m
) for these enzymes were
those determined in amoebal clarified extracts and are shown
in Table 1. Supplementary Table S1B summarizes the kinetic
parameters used in the model for glycolytic enzymes and
branch reactions. Fixed metabolite concentrations and con-
served moieties were as previously described in the text.
Enzyme kinetics
The kinetics of HK were described by a random bisubstrate
Michaelis–Menten reversible reaction with mixed inhibition
by AMP (Eqn 1) [60,61]. The K
eq
was 656 at 37 °C as cal-
culated from the DG °¢ ¼ )3.99 kcalÆmol
)1
:
In a reversible reaction with rapid equilibrium kinetics,
the K
i
value for a product can be considered as the
K
m
value for the ligand; therefore, the K
i
for ADP
previously reported [21] was used as the K
m
for the
product. The values assigned to the constants a, b and c
were one.
HK kinetics was also considered as irreversible with
mixed inhibition by AMP and competitive inhibition by
ADP (Eqn 2) [60,61] as previously demonstrated with the
recombinant enzyme [21]:
The a, b, c and d constants were fixed to a value of 1.0;
when they were ten-fold varied, no change in the flux-con-
trol distribution was attained.
Simulations of these HK rate-equations in the computer
software origin mimicked the diminution in the enzyme
activity using the irreversible equation (data not shown).
These results validated the HK rate equations used in the
model.
When HK was represented as a reversible reaction with-
out AMP inhibition, the equation was Eqn (3) [60,61]:
Amoebal HPI, TPI, PGAM and ENO kinetics were
described as monoreactant reversible Michaelis–Menten
reactions (Haldane’s equation):
v ¼
V
m
f
S
Ks
À V
m
r
P
Kp
1 þ
S
Ks
þ
P
Kp
in which V
m
f and V
m
r are the maximal rates in the forward
and reverse direction; S and P are substrate and product
concentrations, and K
s
and K
p
are the K
m
values for sub-
strate and product, respectively.
The kinetics of PPi-PFK, GAPDH, PGK and PFOR-
AldDH were considered as reversible reactions with two
non-interacting substrates (a and b-values of 1.0 or varied
for PPi-PFK, see Table S1B). This rate reaction is a
Haldane’s equation but for bireactant enzymes [60,61]:
v ¼
V
m
f
aK
gluc
K
ATP
½Gluc½ATPÀ
½G6P½ADP
Keq
1 þ
½gluc
K
gluc
þ
½ATP
K
ATP
þ
½gluc½ATP
aK
gluc
K
ATP
þ
½AMP
K
AMP
þ
½gluc½AMP
bK
gluc
K
AMP
þ
½ATP½AMP
cK
ATP
K
AMP
þ
½G6P
K
G6P
þ
½ADP
K
ADP
þ
½G6P½ADP
aK
G6P
K
ADP
ð1Þ
v ¼
Vm
½Gluc½ATP
aK
gluc
K
ATP
1 þ
½gluc
K
gluc
þ
½ATP
K
ATP
þ
½AMP
K
AMP
þ
½ADP
K
ADP
þ
½gluc½ATP
aK
gluc
K
ATP
þ
½gluc½AMP
bK
gluc
K
AMP
þ
½ATP½AMP
cK
ATP
K
AMP
þ
½gluc½ATP½AMP
abcK
gluc
K
ATP
K
AMP
þ
½gluc½ADP
dK
gluc
K
ADP
ð2Þ
v ¼
Vmf
K
gluc
K
ATP
½gluc½ATPÀ
½G6P½ADP
Keq
1 þ
½gluc
K
gluc
þ
½ATP
K
ATP
þ
½gluc½ATP
K
gluc
K
ATP
þ
½G6P
K
G6P
þ
½ADP
K
ADP
þ
½G6P½ADP
K
G6P
K
ADP
þ
½gluc½ADP
K
gluc
K
ADP
þ
½G6P½ATP
K
G6P
K
ATP
ð3Þ
Modeling Entamoeba glycolysis E. Saavedra et al.
4936 FEBS Journal 274 (2007) 4922–4940 ª 2007 The Authors Journal compilation ª 2007 FEBS
v ¼
V
m
f
½A½B
aKaKb
À V
m
r
½P½Q
bKpKq
1 þ
½A
Ka
þ
½B
Kb
þ
½A½B
aKaKb
þ
½P
Kp
þ
½Q
Kq
þ
½P½Q
bKpKq
where A and B (for substrates) and P and Q (for products)
correspond to the substrates and products in the sequence
described in the reactions displayed in Table S1A. Strictly,
GAPDH is a ter-reactant enzyme; to simplify its rate equa-
tion, in the model the Pi concentration was fixed at a satu-
rating concentration (5 mm).
Amoebal PGK displays one order of magnitude higher
affinity for GDP over ADP [21]. The total GDP concentra-
tion found in amoebas (Table 2) was 2.4–17.5-fold the K
m
value of the enzyme for GDP (0.04 and 0.29 mm at pH 6.0
and 7.0, respectively) [21]; therefore, PGK should be satu-
rated with GDP at pH 6.0. In the model, the PGK reaction
was made dependent on ADP because of the lack of data
regarding the balance in the guanine nucleotide pool. More-
over, a putative dinucleotide transphosphorylase activity
may exchange the synthesized GTP to produce ATP.
The PFOR-AldDH reaction included NADH oxidation
and acetaldehyde formation from pyruvate. The V
m
f value
was adjusted around the reported value by Reeves [36],
whereas the V
m
r was arbitrarily adjusted because no mea-
surements have been described. The K
m NADH
(0.18 mm)
was that of AldDH from Entamoeba histolytica, [44],
whereas the K
m pyruvate
was that of the PFOR from Tricho-
monas [62].
Aldolase kinetics was considered as a reversible reaction
with one substrate and two products:
v ¼
V
m
f
½F1;6P
2
K
F1;6P2
À V
m
r
½DHAP½G3P
K
DHAP
K
G3P
1 þ
½F1;6P2
K
F1;6P2
þ
½DHAP
K
DHAP
þ
½G3P
K
G3P
þ
½DHAP½G3P
K
DHAP
K
G3P
PPDK transforms PEP, AMP and PPi into pyruvate, ATP
and Pi and displays a uni-uni-bi-bi ping-pong ordered
mechanism, for which the reported rate equation is extre-
mely complex [63]. The rate equation used in the present
model was simplified as follows:
v ¼
Vmf ½A½B½C
abKaKbKc
À
Vmr½P½Q½R
abKpKqKr
1 þ
½A
Ka
þ
½A½B
aKaKb
þ
½A½B½C
abKaKbKc
þ
½P½Q½R
abKpKqKr
þ
½Q½R
aKqKr
þ
½R
Kr
where A, B, C, P, Q and R represents PEP, AMP, PPi,
pyruvate, ATP and Pi, respectively, with their respective
Michaelis–Menten constants; a and b-values are listed in
Table S1B.
The ADH and 3PGDH reactions were included with
bisubstrate irreversible kinetics with ordered bi-bi mecha-
nisms [60,61]:
v ¼
Vm½A½B
KaKb þ Kb½Aþ½A½B
For ADH, the K
m
values for NADH (0.05 mm) and acetal-
dehyde (0.15 mm) were those previously described for the
amoebal enzyme determined at pH 6.5 [44]. The V
m
was
the sum of the NAD(P)H-ADH activities displayed in
Table 1. The 3PGDH K
m
values were 0.2 mm and
0.087 mm for 3PG and NAD
+
, respectively, as described
by Ali et al. [38]. However, the V
m
f was adjusted to values
of 1.3–10 mUÆmg
)1
to fit the 3PG concentration.
The glycogen synthesis and glycogen degradation reac-
tions were defined as mass-action irreversible reactions
v ¼ k
Q
i
S
i
; the rate constants k were fitted (Table S1B) to
adjust the concentrations mainly of hexose phosphates.
The V
m
value determined for the ATPases reaction was
higher than the estimated rate of ATP production by gly-
colysis (Tables 1 and 2). Because of the lack of data on the
kinetic parameters for this and the PPi synthesis reaction,
the rate equation used was that for mass-action irreversible
reaction. The k-values were fitted as listed in Table S1B.
NADH consumption process (DHases reaction) and AK
were included as reversible mass-action reactions:
v ¼ k1
Y
i
S
i
À k2
Y
j
Pj;
in which k
1
and k
2
are the rate constants, S
i
is the concen-
tration of substrate(s) and P
j
is the concentration of prod-
uct(s). For each reaction, the rate constants used are shown
in Table S1B.
Acknowledgements
This work received financial support from CONACyT-
Me
´
xico (grants numbers 46719-Q to ES and 43811-Q
to RMS). We thank Dr David Mendoza-Co
´
zatl for his
help in the preliminary stages of the modeling and
Mario Nequiz for help with the amoebal culture. We
also grateful recognize the insightful comments and
observations made by the three reviewers, which signif-
icantly improved the manuscript.
References
1 Petri WA (2003) Therapy of intestinal protozoa. Trends
Parasitol 19, 523–526.
2 WHO ⁄ PAHO ⁄ UNESCO (1997) A consultation with
experts on amoebiasis. Epidemiol Bull 18, 13–14.
3 Upcroft P & Upcroft JA (2001) Drug targets and mech-
anisms of resistance in the anaerobic protozoa. Clin
Microbiol Rev 14, 150–164.
4 Samarawickrema NA, Brown DM, Upcroft JA, Tham-
mapalerd N & Upcroft P (1997) Involvement of superox-
ide dismutase and pyruvate: ferredoxin oxidoreductase in
mechanisms of metronidazole resistance in Entamoeba
histolytica. J Antimicrob Chem 40, 833–840.
5 Wassman C, Hellberg A, Tannich E & Bruchhaus I
(1999) Metronidazole resistance in the protozoan
parasite Entamoeba histolytica is associated with
increased expression of iron-containing superoxide
E. Saavedra et al. Modeling Entamoeba glycolysis
FEBS Journal 274 (2007) 4922–4940 ª 2007 The Authors Journal compilation ª 2007 FEBS 4937
dismutase and peroxiredoxin and decreased expression
of ferredoxin 1 and flavin-reductase. J Biol Chem 274,
26051–26056.
6 Reeves RE (1984) Metabolism of Entamoeba histolytica
Schaudinn, 1903. Adv Parasitol 23, 105–142.
7 McLaughlin J & Aley S (1985) The biochemistry and
functional morphology of the Entamoeba. J Protozool
32, 221–240.
8 Loftus B et al. (2005) The genome of the protist parasite
Entamoeba histolytica. Nature 433 , 865–868.
9 Reeves RE, Serrano R & South DJ (1976) 6-phospho-
fructokinase (pyrophosphate). Properties of the enzyme
from Entamoeba histolytica and its reaction mechanism.
J Biol Chem 251, 2958–2962.
10 Deng Z, Huang M, Singh K, Albach RA, Latshaw SP,
Chang KP & Kemp RG (1998) Cloning and expression
of the gene for the active PPi-dependent phosphofructo-
kinase of Entamoeba histolytica. Biochem J 329 , 659–
664.
11 Reeves RE (1968) A new enzyme with the glycolytic
function of pyruvate kinase. J Biol Chem 243, 3202–
3204.
12 Saavedra-Lira E, Ramı
´
rez-Silva L & Pe
´
rez-Montfort R
(1998) Expression and characterization of recombinant
pyruvate phosphate dikinase from Entamoeba histolyti-
ca. Biochim Biophys Acta 1382, 47–54.
13 Heinrich R, Rapoport SM & Rapoport TA (1977)
Metabolic regulation and mathematical models. Progr
Biophys Mol Biol 32, 1–82.
14 Mele
´
ndez-Hevia E, Mateo F & Torres NV (1992) Con-
trol analysis of rat liver glycolysis under different
glucose concentrations. The substrate approach and the
role of glucokinase. Mol Cell Biochem 115, 1–9.
15 Kashiwaya Y, Sato K, Tsuchiya N, Thomas S, Fell
DA, Veech RL & Passonneau JV (1994) Control of glu-
cose utilization in working perfused rat heart. J Biol
Chem 269, 25502–25514.
16 Puigjaner J, Rais B, Burgos M, Comin B, Ovadi J &
Cascante M (1997) Comparison of control analysis data
using different approaches: modeling and experiments
with muscle extract. FEBS Lett 418, 47–52.
17 Chi AS, Deng Z, Albach RA & Kemp RG (2001) The
two phosphofructokinase gene products of Entamoeba
histolytica. J Biol Chem 276, 19974–19981.
18 Saavedra E, Olivos A, Encalada R & Moreno-Sa
´
nchez
R (2004) Entamoeba histolytica
: kinetic and molecular
evidence of a previously unidentified pyruvate kinase.
Exp Parasitol 106, 11–21.
19 Reeves RE, Montalvo F & Sillero A (1967) Glucokinase
from Entamoeba histolytica and related organisms.
Biochemistry 6, 1752–1760.
20 Kroschewski H, Ortner S, Steipe B, Scheiner O, Wieder-
mann G & Duchene M (2000) Differences in substrate
specificity and kinetic properties of the recombinant
hexokinases HXK1 and HXK2 from Entamoeba histoly-
tica. Mol Biochem Parasitol 105, 71–80.
21 Saavedra E, Encalada R, Pineda E, Jasso-Cha
´
vez R &
Moreno-Sa
´
nchez R (2005) Glycolysis in Entamoeba his-
tolytica: Biochemical characterization of recombinant
glycolytic enzymes and flux control analysis. FEBS J
272, 1767–1783.
22 Eubank WB & Reeves RE (1982) Analog inhibitors for
the pyrophosphate-dependent phosphofructokinase of
Entamoeba histolytica and their effect on culture growth.
J Parasitol 68, 599–602.
23 Saavedra-Lira E & Perez-Montfort R (1996) Energy
production in Entamoeba histolytica: new perspectives in
rational drug design. Arch Med Res 27, 257–264.
24 Fell D (1997) Understanding the Control of Metabolism.
Portland Press, London.
25 Rapoport TA, Heinrich R & Rapoport SM (1976) The
regulatory principles of glycolysis in erythrocytes in vivo
and in vitro. A minimal comprehensive model describing
steady states, quasi-steady states and time-dependent
processes. Biochem J 154, 449–469.
26 Wright BE & Albe KR (1994) Carbohydrate metabo-
lism in Dictyostelium discoideum: 1. Model construction.
J Theor Biol 169, 231–241.
27 Barrett J & Precious WY (1995) Application of meta-
bolic control analysis to the pathways of carbohydrate
breakdown in Hymenolepis diminuta. Int J Parasitol 25,
431–436.
28 Thomas S, Mooney PJF, Burrell MM & Fell DA (1997)
Metabolic control analysis of glycolysis in tuber tissue
of potato (Solanum tuberosum): explanation for the low
control coefficient of phosphofructokinase over respira-
tory flux. Biochem J 322, 119–127.
29 Bakker BM, Michels PAM, Opperdoes FR & Wester-
hoff HV (1997) Glycolysis in bloodstream form Trypano-
soma brucei can be understood in terms of the kinetics of
the glycolytic enzymes. J Biol Chem 272, 3207–3215.
30 Bakker BM, Michels PA, Opperdoes FR & Westerhoff
HV (1999) What controls glycolysis in bloodstream form
Trypanosoma brucei ? J Biol Chem 274, 14551–14559.
31 Albert MA, Haanstra JR, Hannaert V, van Roy J,
Opperdoes FR, Bakker BM & Michels PA (2005)
Experimental and in silico analysis of glycolytic flux
control in bloodstream form Trypanosoma brucei. J Biol
Chem 280, 28306–28315.
32 Teusink B, Passarge J, Reijenga CA, Esgalhado E, van
der Weijden CC, Schepper M, Walsh MC, Bakker BM,
van Dam K, Westerhoff HV et al. (2000) Can yeast
glycolysis be understood in terms of in vitro kinetics of
the constituent enzymes? Testing biochemistry. Eur J
Biochem 267, 5313–5329.
33 Pritchard L & Kell DB (2002) Schemes of flux control
in a model of Saccharomyces cerevisiae glycolysis. Eur J
Biochem 269, 3894–3904.
Modeling Entamoeba glycolysis E. Saavedra et al.
4938 FEBS Journal 274 (2007) 4922–4940 ª 2007 The Authors Journal compilation ª 2007 FEBS
34 Montalvo FE, Reeves RE & Warren LG (1971) Aerobic
and anaerobic metabolism in Entamoeba histolytica.
Exp Parasitol 30, 249–256.
35 Marı
´
n-Herna
´
ndez A, Rodrı
´
guez-Enrı
´
quez S, Vital-Gon-
za
´
lez PA, Flores-Rodrı
´
guez FL, Macı
´
as-Silva M, Sosa-
Garrocho M & Moreno-Sa
´
nchez R (2006) Determining
and understanding the control of glycolysis in fast-
growth tumor cells. Flux control by an over-expressed
but strongly product-inhibited hexokinase. FEBS J 273,
1975–1988.
36 Lo H-S & Reeves RE (1978) Pyruvate to ethanol path-
way in Entamoeba histolytica. Biochem J 171 , 225–230.
37 Bakker-Grunwald T, Martin JB & Klein G (1995)
Characterization of glycogen and amino acid pool of
Entamoeba histolytica by
13
C-NMR spectroscopy.
J Eukaryot Microbiol 42, 346–349.
38 Ali V, Hashimoto T, Shigeta Y & Nozaki T (2004)
Molecular and biochemical characterization of d-phos-
phoglycerate dehydrogenase from Entamoeba histolytica.
A unique enteric protozoan parasite that possesses both
phosphorylated and nonphosphorylated serine metabolic
pathways. Eur J Biochem 271, 2670–2681.
39 Carrero JC, Cervantes C, Moreno-Mendoza N, Saave-
dra E, Morales-Montor J & Laclette JP (2006) Dehy-
droepiandrosterone decreases while cortisol increases
in vitro growth and viability of Entamoeba histolytica.
Microbes Infect 8, 323–331.
40 Susskind BM, Warren LG & Reeves RE (1982) A path-
way for the interconversion of hexose and pentose in
the parasitic amoeba Entamoeba histolytica. Biochem J
204, 191–196.
41 Reeves RE & Lobelle-Rich P (1983) Absence of alpha-
glycerophosphate dehydrogenase in axenically grown
Entamoeba histolytica. Am J Trop Med Hyg 32, 1177–
1178.
42 Hajra AK (1997) Dihydroxyacetone phosphate acyltran-
ferase. Biochim Biophys Acta 1348, 27–34.
43 Mendes P (1993) GEPASI: a software package for mod-
elling the dynamics, steady states and control of bio-
chemical and other systems. Comput Appl Biosci 9,
563–571.
44 Bruchhaus I & Tannich E (1994) Purification and
molecular characterization of the NAD
+
-dependent
acetaldehyde ⁄ alcohol dehydrogenase from Entamoeba
histolytica. Biochem J 303, 743–748.
45 Srivastava DK & Bernhard SA (1987) Biophysical
chemistry of metabolic reaction sequences in concen-
trated enzyme solution and in the cell. Annu Rev Bio-
phys Biophys Chem 16, 175–204.
46 Hofmeyr JS & Cornish-Bowden A (1991) Quantitative
assessment of regulation in metabolic systems. Eur J
Biochem 200, 223–236.
47 Cornish-Bowden A & Cardenas ML (2001) Information
transfer in metabolic pathways. Effects of irreversible
steps in computer models. Eur J Biochem 268, 6616–
6624.
48 Mendoza-Co
´
zatl D & Moreno-Sa
´
nchez R (2006) Con-
trol of glutathione and phytochelatin synthesis under
cadmium stress. Pathway modeling for plants. J Theor
Biol 238, 919–936.
49 Bergmeyer HU (1983) Methods of Enzymatic Analysis.
Verlag Chemie, Weinheim.
50 Bakker BM, Westerhoff HV, Opperdoes FR & Michels
PA (2000) Metabolic control analysis of glycolysis in
trypanosomes as an approach to improve selectivity and
effectiveness of drugs. Mol Biochem Parasitol 106, 1–10.
51 Bakker BM, Walsh MC, ter Kuile BH, Mensonides FI,
Michels PA, Opperdoes FR & Westerhoff HV (1999)
Contribution of glucose transport to the control of the
glycolytic flux in Trypanosoma brucei. Proc Natl Acad
Sci USA 96, 10098–10103.
52 Serrano R & Reeves RE (1974) Glucose transport in
Entamoeba histolytica. Biochem J 144, 43–48.
53 Serrano R & Reeves RE (1975) Physiological signifi-
cance of glucose transport in Entamoeba histolytica. Exp
Parasitol 37, 411–416.
54 Anderson IJ & Loftus BJ (2005) Entamoeba histolytica:
observations on metabolism based on the genome
sequence. Exp Parasitol 110, 173–177.
55 Mansour TE (2002) Chemotherapeutic Targets in Para-
sites. Cambridge University Press, Cambridge.
56 Bruchhaus I, Jacobs T, Denart M & Tannich E (1996)
Pyrophosphate-dependent phosphofructokinase of Ent-
amoeba histolytica: molecular cloning, recombinant
expression and inhibition by pyrophosphate analogues.
Biochem J 316, 57–63.
57 Ghosh S, Chan JM, Lea CR, Meints GA, Lewis JC,
Tovian ZS, Flessner RM, Loftus TC, Bruchhaus I,
Kendrick H et al. (2004) Effects of bisphosphonates on
the growth of Entamoeba histolytica and Plasmodium
species in vitro and in vivo
. J Med Chem 47, 175–187.
58 Aley SB, Cohn ZA & Scott WA (1984) Endocytosis in
Entamoeba histolytica. Evidence for a unique non-acidi-
fied compartment. J Exp Med 160, 724–737.
59 Navarro L, Torres-Ma
´
rquez ME, Gonza
´
lez-Moreno S,
Devars S, Herna
´
ndez R & Moreno-Sa
´
nchez R (1997)
Comparison of physiological changes in Euglena gracilis
during exposure to heavy metals of heterotrophic
and autotrophic cells. Comp Biochem Physiol 116C,
265–272.
60 Segel IH (1975) Enzyme Kinetics. Wiley, New York,
NY.
61 Dixon M & Webb EC (1979) Enzymes. Academic Press,
New York, NY.
62 Williams K, Lowe PN & Leadlay PF (1987) Purification
and characterization of pyruvate: ferredoxin oxidore-
ductase from the anaerobic protozoon Trichomonas
vaginalis. Biochem J 246, 529–536.
E. Saavedra et al. Modeling Entamoeba glycolysis
FEBS Journal 274 (2007) 4922–4940 ª 2007 The Authors Journal compilation ª 2007 FEBS 4939
63 Varela-Go
´
mez M, Moreno-Sa
´
nchez R, Pardo JP &
Pe
´
rez-Montfort R (2004) Kinetic mechanism and
metabolic role of pyruvate phosphate dikinase
from Entamoeba histolytica. J Biol Chem 279, 54124–
54130.
Supplementary material
The following supplementary material is available
online:
Table S1. (A) E. histolytica glycolysis model reactions
as written in gepasi. (B) Kinetic parameters used in
the model.
Doc S1. Variations to the kinetic model.
Table S2. Flux-control coefficients and metabolite
concentrations of the model with the HXT reversible
rate equation.
This material is available as part of the online article
from
Please note: Blackwell Publishing is not responsible
for the content or functionality of any supplementary
materials supplied by the authors. Any queries (other
than missing material) should be directed to the corre-
sponding author for the article.
Modeling Entamoeba glycolysis E. Saavedra et al.
4940 FEBS Journal 274 (2007) 4922–4940 ª 2007 The Authors Journal compilation ª 2007 FEBS