Báo cáo khoa học: Dual effect of echinomycin on hypoxia-inducible factor-1 activity under normoxic and hypoxic conditions docx
Bạn đang xem bản rút gọn của tài liệu. Xem và tải ngay bản đầy đủ của tài liệu tại đây (442.84 KB, 10 trang )
Dual effect of echinomycin on hypoxia-inducible factor-1
activity under normoxic and hypoxic conditions
Benoit Vlaminck, Sebastien Toffoli, Benjamin Ghislain, Catherine Demazy, Martine Raes and
Carine Michiels
Laboratory of Biochemistry and Cellular Biology, FUNDP-University of Namur, Belgium
A low oxygen level is a characteristic feature of solid
tumours and a negative prognostic factor for the sur-
vival of cancer patients. The response of cancer cells to
hypoxia not only drives neo-angiogenesis, but also
enhances cancer cell survival and malignant phenotype.
Hypoxia-inducible factor-1 (HIF-1) is the major regu-
lator of the adaptive responses of cells to hypoxia [1].
It is a Bcl2 ⁄ adenovirus E1B 19 kDa interacting protein
(bHLH-PAS) transcription factor composed of two
subunits: aryl hydrocarbon receptor nuclear transloca-
tor (ARNT), which is constitutively expressed in the
nucleus, and HIF-1a, whose level and activity are reg-
ulated by the oxygen level. In the presence of oxygen,
HIF-1a is post-translationally modified by prolyl
hydroxylases, targeting the protein for proteasomal
degradation, and by an asparagine hydroxylase, pre-
venting its interactions with transcription coactivators
[2]. Limiting oxygen availability prevents these modifi-
cations, leading to HIF-1a accumulation, translocation
into the nucleus and interaction with coactivators. On
activation, the active dimer binds to target gene pro-
moters containing the core recognition sequence
5¢-RCGTC-3¢ (HRE, hypoxia response element), lead-
ing to overexpression of the genes involved in glucose
metabolism, angiogenesis and cell survival [1]. This
transcriptional response mediates cell adaptation to
low oxygen level, but also contributes to tumour
progression, neo-angiogenesis and metastasis [3,4].
Keywords
HIF-1; hypoxia; hypoxia-inducible factor-1;
inhibitors; transcription
Correspondence
C. Michiels, Laboratory of Biochemistry and
Cellular Biology, FUNDP-University of
Namur, 61 Rue de Bruxelles, 5000 Namur,
Belgium
Fax: +32 81 724135
Tel: +32 81 724131
E-mail:
(Received 31 May 2007, revised 26 July
2007, accepted 29 August 2007)
doi:10.1111/j.1742-4658.2007.06072.x
Hypoxia-inducible factor-1 (HIF-1) is now recognized as a possible target
for cancer treatment. This transcription factor is responsible for the overex-
pression of several genes favouring cancer cell survival and inducing neo-
angiogenesis. Echinomycin has recently been described to inhibit HIF-1
DNA binding and transcriptional activity. In this work, it is shown that
echinomycin strongly inhibits the activity of HIF-1 under hypoxic condi-
tions, and also interferes with the activity of other transcription factors.
These results demonstrate the lack of specificity of this molecule. More-
over, it is demonstrated that echinomycin induces an increase in HIF-1
activity under normoxic conditions, parallel to an increase in the expression
of HIF-1 target genes. This effect is caused by an increase in HIF-1a pro-
tein level, resulting from an increase in the transcription of the HIF-1A
gene in the presence of a low concentration of echinomycin. Transfection
experiments with HIF-1a promoter constructs revealed the presence of an
Sp1 binding element responsive to echinomycin. Furthermore, echinomycin
enhanced Sp1 activity, as measured by the use of a specific reporter system.
These findings show, for the first time, that echinomycin has a dual effect
on HIF-1 activity under normoxic and hypoxic conditions, demonstrating
that this molecule cannot be used in cancer treatment.
Abbreviations
AP-1, activator protein-1; ARNT, aryl hydrocarbon receptor nuclear translocator; DHG, DMEM high glucose; HB, hypotonic buffer; HIF-1,
hypoxia-inducible factor-1; HRE, hypoxia response element; Hsp90, heat shock protein 90; IGF, insulin-like growth factor; IOP1, iron-only
hydrogenase-like protein 1; 2ME-2, 2-methoxyestradiol; PMA, 4b-phorbol 12-myristate 13-acetate; ROS–NF-jB, reactive oxygen species–
nuclear factor-jB; YC-1, 3-(5¢-hydroxymethyl-2¢-furyl)-1-benzyl indazole.
FEBS Journal 274 (2007) 5533–5542 ª 2007 The Authors Journal compilation ª 2007 FEBS 5533
Moreover, increased levels of HIF-1a are frequently
observed in human primary tumours [5,6]. Significant
associations between HIF-1a overexpression and
patient mortality have been shown in different types of
cancer [7].
The identification of HIF-1 involvement in tumour
progression and angiogenesis led to the concept of
HIF-1 as a promising molecular target for the develop-
ment of cancer therapeutics. Different approaches have
been developed to inhibit HIF-1 activity [8]. Major
efforts have been made to identify small molecules that
are selective HIF-1 inhibitors. Most molecules inhibit
HIF-1 by altering the signal transduction pathways
that are associated with HIF-1, such as 2-methoxyest-
radiol (2ME-2), which interacts with microtubules [9],
camptothecin derivatives, which target topoisomerase
II [10], and geldanamycin, which inhibits heat shock
protein 90 (Hsp90) [11,12]. Only a few examples target
selective pathways associated with HIF-1 activation,
such as chetomin, which blocks HIF-1 interaction with
coactivators [13], and echinomycin, which prevents
HIF-1 DNA binding [14]. 3-(5¢-Hydroxymethyl-2¢-
furyl)-1-benzyl indazole (YC-1) has also been described
to specifically inhibit HIF-1 via the suppression of
HIF-1a expression through a mechanism that is not
yet clear [15].
Echinomycin, a cyclic peptide of the family of qui-
noxaline antibiotics derived from Streptomyces
echinatus [16], was originally discovered as a sequence-
specific DNA binding agent: the strong binding site for
this molecule is 5¢-A ⁄ TCGT-3¢ [17]. This sequence is
contained in the core binding site (E box, 5¢-CAC-
GTG-3¢) of the bHLH family of transcription factors,
and hence of HIF-1. A recent study from Kong et al.
[14] showed that this molecule is able to inhibit HIF-1
DNA binding activity, and thus the expression of cor-
responding target genes, raising the attractive possibil-
ity of the use of this small molecule in cancer therapy.
In an effort to extend these results to other cancer cell
lines, it was observed that, although echinomycin can
inhibit HIF-1 activity under hypoxic conditions in
HepG2 cells, its effects are not specific to this tran-
scription factor, as activator protein-1 (AP-1) and
c-myc activities are also affected. Moreover, a dual
effect of this molecule was demonstrated, as it
appeared to enhance HIF-1 activity under normoxia.
Results and Discussion
Echinomycin inhibits HIF-1 activity
Echinomycin was described by Kong et al. [14] to be a
strong HIF-1 inhibitor by inhibiting its DNA binding
capacity and hence transcriptional activity. These
experiments were performed using MCF-7 and U251
human glioma cells. Similar results were obtained
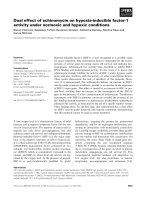
using HepG2 cells. Figure 1A shows the concentra-
tion-dependent inhibition of HIF-1 transcriptional
activity under hypoxic conditions, measured using a
reporter system with 6HRE upstream of the firefly
luciferase gene: no inhibition was observed at 2 nm,
50% inhibition at 5 nm and 100% inhibition at 10 nm.
It was, however, surprising to observe a significant and
reproducible increase in HIF-1 activity at 2 nm under
normoxic conditions. Similar results were obtained in
HeLa cells (Fig. 1B). To investigate the effects of echi-
nomycin on endogenous gene expression, mRNA
expression of two HIF-1 target genes (BNIP3 and
aldolase) was quantified by real-time RT-PCR. Echino-
mycin, at 10 nm, significantly decreased BNIP3 and
aldolase overexpression induced by 16 h of incubation
under hypoxic conditions. Again, a slight increase in
HIF-1 activity was observed in the presence of 2 nm
echinomycin under normoxic conditions, as measured
by a 1.23-fold increase in BNIP3 mRNA level and a
1.3-fold increase in aldolase mRNA level (Fig. 1C). As
echinomycin was described as a DNA binding inhibit-
ing agent, we tested this effect using a DNA binding
ELISA with an HRE double-strand DNA probe
covalently bound to the bottom of multiwell plates
(TransAM assay, Carlsbad, CA, USA). Hypoxia
markedly increased HIF-1 DNA binding activity. The
incubation of cells with echinomycin during normoxia
or hypoxia had a minimal effect on the HIF-1 DNA
binding activity detected in the nuclear extract
(Fig. 1D). This is probably a result of the loss of the
molecule during the extraction procedure: indeed, only
the nuclear proteins are recovered and the DNA is dis-
carded. By contrast, when echinomycin was added to
the nuclear extract from hypoxic cells just before the
assay, a clear inhibition of HIF-1 DNA binding activ-
ity to the HRE probe was observed (Fig. 1D), indicat-
ing that echinomycin can prevent HIF-1 binding to the
HRE sequence.
The core sequence to which echinomycin binds is
not only present in HRE, but also in other E-boxes
recognized by other members of the bHLH family,
such as c-myc. This raises the possibility that echino-
mycin may also inhibit the DNA binding of this type
of transcription factor. To test this possibility, reporter
system experiments and TransAM assays were per-
formed for c-myc, and also for another transcription
factor that does not recognize such a sequence, AP-1.
As shown in Fig. 2, echinomycin, when added to
nuclear extracts from hypoxic cells just before the
assay, inhibited the DNA binding activity of c-myc by
Dual effect of echinomycin on HIF-1 activity B. Vlaminck et al.
5534 FEBS Journal 274 (2007) 5533–5542 ª 2007 The Authors Journal compilation ª 2007 FEBS
30%, and that of AP-1 by 50% (Fig. 2A,B). Echino-
mycin also inhibited the activity of both transcription
factors measured using a reporter system. Basal c-myc
activity was very low in HepG2 cells and was even
lower under hypoxic conditions. Gordan et al. [18] and
Zhang et al. [19] have shown that HIF-1 ⁄ HIF-1a
inhibits c-myc activity. This is in accordance with our
results, as we detected a lower c-myc DNA binding
activity and a lower c-myc transcriptional activity
under hypoxia (i.e. when HIF-1a is more abundant)
relative to normoxia. However, the activity was mark-
edly enhanced when cells were stimulated with 100 nm
4b-phorbol 12-myristate 13-acetate (PMA). Echinomy-
cin markedly inhibited both basal and PMA-stimulated
c-myc transcriptional activity (Fig. 2C). AP-1 activity
was also low in unstimulated HepG2 cells. PMA
enhanced this activity and, under normoxic and hypoxic
conditions, echinomycin inhibited PMA-induced AP-1
activity (Fig. 2D).
Together, these results, summarized in Fig. 2E, indi-
cate that echinomycin strongly inhibits HIF-1 DNA
binding activity, and hence HIF-1 transcriptional
activity (between 80 and 100% inhibition). However,
this effect is far from specific, because inhibition was
also observed for c-myc, which binds to a similar
DNA sequence (between 30 and 80% inhibition
according to the type of assay), and AP-1, which
binds to a totally different DNA sequence. Our results
contrast with those described by Kong et al. [14], as
we observed the inhibition of AP-1 activity, whereas
they did not. The reasons for this discrepancy are not
clear: we used a different cell type and stimulated the
cells with PMA to activate c-myc and AP-1, because
their basal activity was low. It is possible that inhibition
10
8
Relative reporter activity
Echinomycin concentration (n
M
)
Echinomycin concentration (n
M
)
6
4
2
0
8
6
Relative reporter activity
4
2
0
4
3.5
2.5
Absorbance
Relative mRNA induction
1.5
0.5
0
N
HN + E 5n
M
H + E 5n
M
H +
EA320n
M
Conditions
N
HN + E 2n
M
H + E 10n
M
Conditions
BNIP3
aldolase
3
2
1
4
3.5
2.5
1.5
0.5
0
3
2
1
012510
012510
Normoxia
Hypoxia
Normoxia
Hypoxia
(***)
***
(*)
(***)
***
(*)
(**)
*
*
**
**
***
(***)
HeLa
HeLa
*
(**)
HepG2
*
*
**
AB
DC
Fig. 1. Effect of echinomycin on HIF-1 activity. HepG2 and HeLa cells were incubated for 5 or 16 h under hypoxia or normoxia in the pres-
ence or absence of increasing concentrations of echinomycin. HepG2 cells (A) and HeLa cells (B) were transfected with the pGL3-
SV40 ⁄ 6HRE reporter plasmid and the pCMVb normalization vector. After incubation (16 h), luciferase and b-galactosidase activities were
assayed. The results are expressed as the ratio between the luciferase activity and the b-galactosidase activity, as means ± 1SD (n ¼ 3). (C)
After incubation (16 h), total RNA was extracted from HepG2 cells, retrotranscribed into cDNA and submitted to real-time PCR for BNIP3
and aldolase. RPL13 was used as the housekeeping gene. The results are expressed as fold induction, as means ± 1SD (n ¼ 3). (D) After
incubation (5 h), nuclear extracts were recovered from HeLa cells. The DNA binding activity was quantified using the TransAM assay. An
assay was also performed by adding echinomycin directly to the extracts from control hypoxic cells at 320 n
M (EA320nM). The results are
expressed as means ± 1SD (n ¼ 3). *, ** and ***, P < 0.05, 0.01 and 0.001 versus normoxia. (*), (**) and (***), P < 0.05, 0.01 and 0.001
versus hypoxia.
B. Vlaminck et al. Dual effect of echinomycin on HIF-1 activity
FEBS Journal 274 (2007) 5533–5542 ª 2007 The Authors Journal compilation ª 2007 FEBS 5535
can only be observed when these factors are fully
activated.
Echinomycin increases HIF-1 a protein level under
normoxia
The results in Fig. 1 revealed a surprising observation:
HIF-1 activity was increased when the cells were
incubated in the presence of low concentrations of
echinomycin (1–2 nm) under normoxia. In order to
investigate the mechanism for this increased activity,
the HIF-1a protein level was assessed by western blot-
ting and immunofluorescence. Figure 3 shows that the
HIF-1a protein was almost undetectable by western
blotting in extracts from normoxic control cells.
Hypoxia induced a strong stabilization of the protein.
Echinomycin did not influence HIF-1a stabilization
under hypoxic conditions, as already observed by
Kong et al. [14]. However, this molecule induced an
increase in the HIF-1a protein level under normoxic
conditions; this effect was optimal at 2 nm, which cor-
responds to the concentration leading to the maximal
A
B
C
D
E
Trans-AM reporter system
HIF-1 70% 100%
c-myc 30% 80%
AP-1 50% 40%
**
*
**
(*)
[*]
HepG2
Relative reporter activity
5
Normoxia
Hypoxia
4
3
2
1
0
CTL E 10 n
M PMA
Conditions
PMA + E
*
***
(***)
[*]
[**]
HepG2
Relative reporter activity
16
14
12
10
8
6
4
2
0
CTL
Normoxia
Hypoxia
E 10 n
M PMA
Conditions
PMA + E
**
*
(*)
HeLa
1.4
1.2
Absorbance
Conditions
1
0.8
0.6
0.4
0.2
0
NN + EHH + EH +
EA 320n
M
**
*
(**)
HeLa
Absorbance
2
1.5
0
1
0.5
Conditions
N N + E H H + E H +
EA 320n
M
Fig. 2. Effect of echinomycin on c-myc (A, C) and AP-1 (B, D) activity. HepG2 and HeLa cells were incubated for 5 or 16 h under hypoxia or
normoxia in the presence or absence of echinomycin at 10 n
M. (A, B) After incubation (5 h), nuclear extracts were recovered from HeLa
cells. The DNA binding activity was quantified using the TransAM assay. An assay was also performed by adding echinomycin directly to
the extracts from control hypoxic cells at 320 n
M (EA320nM). The results are expressed as means ± 1SD (n ¼ 3). (C, D) HepG2 cells were
transfected with the pGL2-M4-Luc (C) or pAP-1-Luc (D) reporter plasmid and the pCMVb normalization vector. PMA at 100 n
M was used as
a positive control. After incubation (16 h), luciferase and b-galactosidase activities were assayed. The results are expressed as the ratio
between the luciferase activity and the b-galactosidase activity, as means ± 1SD (n ¼ 3). *, ** and ***, P < 0.05, 0.01 and 0.001 versus
normoxia. (*), (**) and (***), P < 0.05, 0.01 and 0.001 versus hypoxia. [*] and [**], P < 0.05 and 0.01 versus PMA alone. (E) The table sum-
marizes the inhibition percentage of HIF-1, c-myc and AP-1 DNA binding activity (TransAM) when echinomycin was added to the nuclear
extracts before the assay, and of HIF-1, c-myc and AP-1 transcriptional activity (reporter system) in the presence of 10 n
M echinomycin.
Dual effect of echinomycin on HIF-1 activity B. Vlaminck et al.
5536 FEBS Journal 274 (2007) 5533–5542 ª 2007 The Authors Journal compilation ª 2007 FEBS
increase in HIF-1 activity in the previous experiments.
This effect was observed in both HepG2 and HeLa
cells (Fig. 3A,B). Similar results were obtained when
the HIF-1a protein level was assessed by immunofluo-
rescence labelling and confocal observation (Fig. 3D).
Again, echinomycin did not influence hypoxia-induced
HIF-1a accumulation, but led to an increase in the
HIF-1a protein level under normoxic conditions. In
these conditions, as under hypoxia, HIF-1a was local-
ized in the nucleus.
We also tested whether the effect of echinomycin on
the HIF-1a protein level under normoxia was revers-
ible. Cells were incubated in the presence or absence of
echinomycin at 2 nm for 16 h under normoxia; the
medium was then changed to medium without echino-
mycin and the cells were lysed directly (as a positive
control) or after 4 h or 24 h of recovery. The results
showed that there was still an increase in HIF-1a pro-
tein level after 4 h of recovery, but to a lower extent
than directly after incubation in the presence of echi-
nomycin. After 24 h of recovery, the HIF-1a protein
level had returned to the basal level (Fig. 3C).
Echinomycin increases HIF-1 a mRNA expression
under normoxia
Several mechanisms have been described in the litera-
ture to account for an increase in the HIF-1a protein
level: (a) under hypoxia, HIF-1 a is no longer modified
by the prolyl hydroxylases; it therefore escapes recog-
nition by the E3 ubiquitin ligase pVHL and degrada-
tion via the proteasome [20,21]; (b) on stimulation by
cytokines or growth factors, such as insulin and insu-
lin-like growth factor (IGF), in normoxia, HIF-1a
A
B
D
C
Fig. 3. Effect of echinomycin on HIF-1a protein level. HepG2 and HeLa cells were incubated for 5 or 16 h under hypoxia or normoxia in the
presence or absence of increasing concentrations of echinomycin. (A) After incubation (5 h), protein extracts were recovered from HepG2
cells for western blot analysis using HIF-1a-specific antibodies. a-Tubulin was used to assess the total amount of proteins loaded on the gel.
(B) After incubation (16 h), protein extracts were recovered from HeLa cells for western blot analysis using HIF-1a-specific antibodies.
a-Tubulin was used to assess the total amount of proteins loaded on the gel. (C) After incubation (16 h), the medium was changed to med-
ium without echinomycin and, after 0, 4 and 24 h of recovery, protein extracts were recovered from HepG2 cells for western blot analysis
using HIF-1a-specific antibodies. a-Tubulin was used to assess the total amount of proteins loaded on the gel. (D) After incubation (5 h), cells
were fixed, permeabilized and labelled with anti-HIF-1a-specific IgG. Observations were made using a confocal microscope with a constant
photomultiplier tube.
B. Vlaminck et al. Dual effect of echinomycin on HIF-1 activity
FEBS Journal 274 (2007) 5533–5542 ª 2007 The Authors Journal compilation ª 2007 FEBS 5537
mRNA translation is increased through a phosphatidyl
inositol 3-kinase–Akt-dependent pathway, leading to
the production of more HIF-1a proteins that saturate
the prolyl hydroxylase-dependent degradation pathway
[22,23]; (c) recently, a third mechanism has been
described in pulmonary smooth muscle cells stimulated
by thrombin, which leads to an increase in HIF-1A
gene transcription through a reactive oxygen species
(ROS)–nuclear factor-jB (NF-jB)-dependent pathway
[24]. HIF-1A gene transcription is also modulated by
iron-only hydrogenase-like protein 1 (IOP1), a novel
hydrogenase-like protein, through an as yet unidenti-
fied mechanism [25].
Echinomycin induced a significant increase in HIF-
1a mRNA level under normoxic conditions (Fig. 4A).
This observation suggests that HIF-1A gene transcrip-
tion may be increased by this molecule. As we have
previously cloned the HIF-1A promoter in a reporter
system upstream of the luciferase gene (pH800) [26],
we used this construct to investigate whether echino-
mycin is able to increase HIF-1A transcription. An
increase in luciferase activity was observed in the pres-
ence of echinomycin under normoxic conditions, but
not under hypoxia (Fig. 4B). These results are similar
to those obtained when measuring the HIF-1a protein
level and HIF-1 activity. Progressive deletions of the
promoter were then generated in order to delineate the
sequence responsive to echinomycin. An increase in
luciferase activity was still observed in the presence of
echinomycin with the plasmid spanning from )41 to
+287 (pD4), but not with the plasmid spanning from
)30 to +287 (p15C) (Fig. 4B). These results indicate
that the sequence from )41 to )31 is responsible for
the increased transcription in the presence of this mole-
cule. This sequence contains a putative Sp1 binding site
(5¢-CCGCCC-3¢) [26]. In order to investigate whether
echinomycin could increase Sp1 activity, a reporter
vector containing three consensus Sp1 binding sites
was used. Figure 5 shows that echinomycin at 2 nm
was capable of increasing luciferase activity under
normoxia, but had no effect under hypoxia, indicating
that this molecule may enhance Sp1 activity in these
conditions. This effect was no longer observed at
higher concentrations. The protein level of Sp1 was
checked in the different conditions: the results showed
that echinomycin did not influence the Sp1 protein
level under normoxic and hypoxic conditions (Fig. 5B).
These results suggest that echinomycin may increase
Sp1 activity. The mechanism responsible for this effect
remains to be investigated. Activated Sp1 is then
A
B
**
*
*
Luc+
+1
-541
-201
-41
-30
+243
Relative reporter activity
N + E 2nM
Fig. 4. Effect of echinomycin on HIF-1A
mRNA level and promoter activity. HepG2
cells were incubated for 16 h under hypoxia
or normoxia in the presence or absence of
2n
M echinomycin. (A) After incubation
(16 h), total RNA was extracted, retrotran-
scribed into cDNA and submitted to real-
time PCR for HIF-1a. RPL13 was used
as the housekeeping gene. The results
are expressed as fold induction, as
means ± 1SD (n ¼ 3). (B) Cells were trans-
fected with different constructs containing
sequences of the HIF-1A promoter and the
pCMVb normalization vector. After incuba-
tion (16 h), luciferase and b-galactosidase
activities were assayed. The results are
expressed as the ratio between the lucifer-
ase activity and the b-galactosidase activity,
as means ± 1SD (n ¼ 3). *, P < 0.05 versus
normoxia.
Dual effect of echinomycin on HIF-1 activity B. Vlaminck et al.
5538 FEBS Journal 274 (2007) 5533–5542 ª 2007 The Authors Journal compilation ª 2007 FEBS
responsible for an increase in HIF-1A gene transcrip-
tion, resulting in a higher level of HIF-1a protein and
higher expression of HIF-1 target genes.
In conclusion, our results demonstrate a lack of spec-
ificity of echinomycin towards HIF-1, as it also inhibits
the activity of several other transcription factors. More-
over, these findings show, for the first time, that echino-
mycin has a dual effect on HIF-1 activity under
normoxic and hypoxic conditions, demonstrating that
this molecule cannot be used in cancer treatment. In
the context of cancer treatment, the use of this molecule
would lead to an increase in expression of pro-survival
and pro-angiogenic genes in normoxic conditions, a
factor that would promote tumour growth.
Experimental procedures
Cell culture
Human hepatoma cell lines HepG2 were grown in Dul-
becco’s modified Eagle’s medium (DMEM, Invitrogen,
Paisley, UK), supplemented with 10% fetal bovine serum
(Invitrogen). HeLa cells (wt p53) were cultured in DMEM
high glucose (DHG), supplemented with 10% fetal bovine
serum. The cells were kept at 37 °C in a humidified atmo-
sphere of 5% CO
2
and 95% air. For hypoxia experiments
(1% O
2
), the cells were incubated in serum-free CO
2
-inde-
pendent medium (Invitrogen), supplemented with 1 mm
l-glutamine (Sigma, St Louis, MO, USA) with different
concentrations of echinomycin (Sigma). PMA (Sigma), at
100 nm, was used as a positive control in some experiments.
Immunofluorescence
10
5
cells were seeded in a 24-well culture plate containing a
glass coverslip. After 24 h of incubation in standard condi-
tions, the cells were incubated for 5 h under normoxia or
hypoxia; thereafter, the medium was removed and the cells
were fixed for 10 min with NaCl ⁄ Pi containing 4% parafor-
maldehyde (Merck, Darmstadt, Germany). Fixed cells were
then washed three times with NaCl ⁄ P
i
and permeabilized
with NaCl ⁄ P
i
–Triton X-100 (Merck) 1% for 4 min. After
three washings with NaCl ⁄ P
i
–BSA 2%, the cells were incu-
bated at 4 °C overnight with the primary antibody (anti-
HIF-1a, BD Bioscience, San Diego, CA, USA). The cells
were washed three times as described above and the second-
ary antibody conjugated to Alexa fluorochrome (488 nm,
dilution 1 : 500) was added. After 1 h of incubation, the cells
were washed three times with NaCl ⁄ P
i
. For the labelling of
nuclei, the cells were incubated for 30 min with TOPRO-3
(Molecular Probes, Eugene, OR, USA, dilution 1 : 80 v ⁄ v)
in the presence of 2 mgÆmL
)1
RNase, and then washed three
times with NaCl ⁄ P
i
. Finally, glass coverslips were mounted
in Mowiol for observation in confocal microscopy (Leica,
Solms, Germany). Semiquantitative observations were per-
formed with a constant photomultiplier tube value.
Western blot analysis
Total cell extracts were prepared from HepG2 cells grown to
subconfluence in T25 cm
2
flasks. After incubation, the cells
were scraped in lysis buffer [Tris 20 mm pH 7.5 (Merck),
KCl 150 mm (Merck), EDTA 1 mm (Merck), Triton X-100
1% (Merck), protease inhibitors (Complete, Boehringer ⁄
Roche, Mannheim, Germany) and phosphatase inhibitors
(25 mm Na
2
VO
4
,10mm para-nitrophenyl phosphate,
10 mm b-glycero-phosphate and 5 mm NaF)]. The lysate was
centrifuged for 5 min at 15 000 g at 4 °C and the superna-
tant was kept frozen. The protein concentration of each sam-
ple was determined by the Bradford method. Samples were
applied to 10% NuPAGE Bis-Tris gels (Invitrogen), accord-
ing to the manufacturer’s instructions, and then transferred
to Hybond-poly(vinylidene difluoride) membrane (Amer-
sham, Chalfont St Giles, UK). The membranes were blocked
overnight at 4 °C in NaCl ⁄ Tris-T solution containing 20 mm
Tris, 140 mm NaCl, 0.1% Tween 20, pH 7.6, containing 5%
nonfat dry milk. Then, the membranes were probed with
*
(*)
(*)
B
0 1 2 5 10 0 1 2 5 10
normoxia hypoxia
Sp1
-
tubulin
echinomycin (n
M)
A
Relative reporter activity
52
CTL
0.5
0
1.5
2.5
1
2
10
Normoxia
Hypoxia
Echinomycin concentration (n
M)
Fig. 5. Effect of echinomycin on Sp1 activity and protein level.
HepG2 cells were incubated for 16 h under hypoxia or normoxia in
the presence or absence of increasing concentrations of echinomy-
cin. (A) Cells were transfected with the pSp1-Luc reporter vector
and the pCMVb normalization vector. After incubation, luciferase
and b-galactosidase activities were assayed. The results are
expressed as the ratio between the luciferase activity and the
b-galactosidase activity, as means ± 1SD (n ¼ 4). *, P < 0.05 ver-
sus normoxia. (*), P < 0.05 versus hypoxia. (B) After incubation
(16 h), protein extracts were recovered from HepG2 cells for wes-
tern blot analysis using Sp1-specific antibodies. a-Tubulin was used
to assess the total amount of proteins loaded on the gel.
B. Vlaminck et al. Dual effect of echinomycin on HIF-1 activity
FEBS Journal 274 (2007) 5533–5542 ª 2007 The Authors Journal compilation ª 2007 FEBS 5539
monoclonal anti-HIF-1a IgG (BD Bioscience) at a final dilu-
tion of 1 : 2000 for 2 h, or with polyclonal anti-Sp1 IgG
(Santa Cruz Biotechnology, Santa Cruz, CA, USA) at room
temperature. After three 15 min washes in NaCl ⁄ Tris-T with
5% nonfat dry milk, the membranes were incubated for 1 h
at room temperature with horseradish peroxidase-conjugated
secondary antibodies at a final dilution of 1 : 50 000, and
washed twice for 15 min in NaCl ⁄ Tris-T with 5% nonfat dry
milk and twice for 5 min in NaCl ⁄ Tris-T. The proteins were
visualized by enhanced chemiluminescence (Amersham)
according to the manufacturer’s instructions. The mem-
branes were reprobed with a-tubulin antibody (Sigma, final
dilution 1 : 50 000) for normalization.
Preparation of nuclear extracts
Nuclear protein extracts in high salt buffer were prepared
as described previously [27]. HeLa cells were grown to sub-
confluence in T75 cm
2
flasks and incubated under normoxia
or hypoxia for 5 h before cell lysis. The cells were washed
with ice-cold NaCl ⁄ P
i
containing 1 mm Na
2
MoO
4
and
5mm NaF. Then, the cells were incubated for 3 min with
ice-cold hypotonic buffer (HB) containing 20 mm Hepes
pH 7.9, 5 mm NaF, 1 mm Na
2
MoO
4
and 0.1 mm EDTA.
The cells were harvested in lysis buffer containing HB, sup-
plemented with 5% Nonidet P40 (Sigma). The lysates were
centrifuged for 30 s at 13 000 g and the supernatants were
discarded. The pellets were dissolved in 50 lL of RE buffer,
composed of HB supplemented with 20% glycerol and pro-
tease inhibitors (Complete, Roche) and phosphatase inhibi-
tors (25 mm Na
2
VO
4
,10mm para-nitrophenyl phosphate,
10 mm b-glycero-phosphate and 5 mm NaF). Then, 50 lL
of SA buffer, composed of RE buffer, supplemented with
800 mm NaCl, was added. The samples were placed at 4 °C
for 30 min under gentle rotation for nuclear protein extrac-
tion under high salt concentration. Then, the samples were
centrifuged for 10 min at 13 000 g at 4 °C, and the super-
natants containing the nuclear proteins were stored at
)70 °C. The pellets containing the DNA were discarded.
Colorimetric assay for HIF-1, c-myc or AP-1 DNA
binding
HIF-1, c-myc and AP-1 DNA binding activity was mea-
sured using a colorimetric assay (Trans-AM) developed in
our laboratory [28], and sold by Active Motif (Carlsbad,
CA, USA). Assays were performed according to the manu-
facturer’s instructions.
Transient transfection and luciferase activity
measurement
HepG2 transfections were performed in 24–well plates
(50 000 cells per well) with SuperFect reagent (Qiagen,
Hilden, Germany); 1846 ng of the reporter plasmid contain-
ing binding sites for the transcription factor to be assayed,
or the HIF-1A promoter sequences upstream of the firefly
luciferase gene, was cotransfected with 1154 ng of normali-
zation vector (pCMVb vector coding for b-galactosidase,
Promega, Madison, WI, USA) in DMEM without serum
for 7 h. The reporter plasmids were the pGL3-SV40 ⁄ 6HRE
vector containing six HRE binding sites upstream of the
firefly luciferase gene [29], pAP1-Luc (Stratagene, La Jolla,
CA, USA), pGL2-M4-luciferase containing four c-myc
binding sites upstream of the firefly luciferase gene [30] and
pSp1-Luc containing three Sp1 binding sites upstream of
the firefly luciferase gene [31]. The different constructs for
the HIF-1A promoter are described in [26]. The cells were
then directly incubated under hypoxia for 16 h. After incu-
bation under hypoxia, b-galactosidase was assayed in paral-
lel with the firefly luciferase activity in a luminometer using
the Luciferase Reporter Assay System (Promega). Experi-
ments were performed in triplicate. The results are
expressed as means of the ratio between the firefly luciferase
activity and the b-galactosidase activity.
Real-time PCR analysis
The levels of HIF-1a, BNIP3 and aldolase transcripts were
determined by real-time RT-PCR using SYBR Green (Invi-
trogen). To normalize for the input load of cDNA between
samples, human RPL13 was used as an endogenous stan-
dard. Specific primers were used: HIF-1a forward,
5¢-TCAAGCAGTAGCGAATTGGAACATTATT-3¢; HIF-
1a reverse, 5¢-TTTACACGTTTCCAAGAAAGTGATG
TA-3¢; BNIP3 forward, 5¢-TTTGCTGGCCATCGGATT-
3¢; BNIP3 reverse, 5¢-ACCAAGTCAGACTCCAGTTCTT
CA-3¢; aldolase forward, 5¢-GAATTGGATGAAAGATA
AAGCCCTTA-3¢; aldolase reverse, 5¢-TTGCCAGACC
ATCCGTACTG-3¢; RPL13A forward, 5¢-CTCAAGGTC
GTGCGTCTGAA,-3¢: RPL13 reverse, 5¢-TGGCTGTCAC
TGCCTGGTACT-3¢. cDNA was added to SYBR Green
Master Mix PCR (300 nm of each specific primer). PCRs
were performed in a total volume of 25 lL. PCRs were car-
ried out in a real time PCR cycler (ABI Prism 7700
Sequence Detector, Applied Biosystems, Branchburg, NJ,
USA). The thermal cycling conditions were as follows: ini-
tial incubation of 10 min at 95 °C, followed by 40 cycles of
30 s at 95 °C, 1 min at an annealing temperature of 57 °C
and 30 s at 72 °C. All cDNA samples were tested in dupli-
cate and analysed with ABI Prism Sequence Detection Soft-
ware version 1.7 (PE Applied Biosystems). Samples were
compared using the relative Ct method. The Ct value, which
is inversely proportional to the initial template copy num-
ber, is the calculated cycle number for which the fluores-
cence signal is significantly above background levels. Fold
induction or repression was measured relative to controls,
and was calculated after adjusting for a-tubulin using
Dual effect of echinomycin on HIF-1 activity B. Vlaminck et al.
5540 FEBS Journal 274 (2007) 5533–5542 ª 2007 The Authors Journal compilation ª 2007 FEBS
2
–[DDCt]
, where DCt ¼ Ct(tested gene) ) Ct(a-tubulin) and
DDCt ¼ DCt(control) ) DCt(treatment).
Statistical analysis
Statistical analyses were performed using Student’s t-test.
For each set of data, real triplicates were performed in one
experiment. Each experiment was repeated at least twice.
Acknowledgements
B. Vlaminck and B. Ghislain are recipients of a grant
from Fonds de la Recherche en Industrie et pour
l’Agriculture (Brussels, Belgium). S. Toffoli is a recipi-
ent of a Televie grant (FNRS, National Funds for Sci-
entific Research, Belgium) and Carine Michiels is a
senior research associate of FNRS.
We thank Professor R.N. Eisenman (Fred Hutchin-
son Cancer Research Center, Seattle, WA, USA) for the
pGL2-M4-luciferase plasmid and Professor H. Nomura
(Chugai Research Institute for Molecular Medicine,
Ibaraki, Japan) for the pSp1-luc plasmid. This article
presents results of the Belgian Programme on Inter-
university Poles of Attraction initiated by the Belgian
State, Prime Minister’s Office, Science Policy Program-
ming. Responsibility is assumed by the authors.
References
1 Semenza GL (2000) Expression of hypoxia-inducible
factor 1: mechanisms and consequences. Biochem Phar-
macol 59, 47–53.
2 Brahimi-Horn C, Mazure N & Pouyssegur J (2005) Sig-
nalling via the hypoxia-inducible factor-1alpha requires
multiple posttranslational modifications. Cell Signal 17,
1–9.
3 Semenza GL (2003) Targeting HIF-1 for cancer ther-
apy. Nat Rev Cancer 3, 721–732.
4 Gordan JD & Simon MC (2007) Hypoxia-inducible
factors: central regulators of the tumor phenotype.
Curr Opin Genet Dev 17, 71–77.
5 Zhong H, De Marzo AM, Laughner E, Lim M, Hilton
DA, Zagzag D, Buechler P, Isaacs WB, Semenza GL,
Simons JW et al. (1999) Overexpression of hypoxia-
inducible factor 1alpha in common human cancers and
their metastases. Cancer Res 59, 5830–5835.
6 Talks KL, Turley H, Gatter KC, Maxwell PH, Pugh
CW, Ratcliffe PJ & Harris AL (2000) The expression
and distribution of the hypoxia-inducible factors
HIF-1alpha and HIF-2alpha in normal human tissues,
cancers, and tumor-associated macrophages. Am J
Pathol 157, 411–421.
7 Beasley NJ, Leek R, Alam M, Turley H, Cox GJ,
Gatter K, Millard P, Fuggle S & Harris AL (2002)
Hypoxia-inducible factors HIF-1alpha and HIF-2alpha
in head and neck cancer: relationship to tumor biology
and treatment outcome in surgically resected patients.
Cancer Res 62, 2493–2497.
8 Melillo G (2006) Inhibiting hypoxia-inducible factor 1
for cancer therapy. Mol Cancer Res 4, 601–605.
9 Mabjeesh NJ, Escuin D, La Vallee TM, Pribluda VS,
Swartz GM, Johnson MS, Willard MT, Zhong H,
Simons JW, Giannakakou P et al. (2003) 2ME2 inhibits
tumor growth and angiogenesis by disrupting microtu-
bules and dysregulating HIF. Cancer Cell 3, 363–375.
10 Rapisarda A, Uranchimeg B, Scudiero DA, Selby M,
Sausville EA, Shoemaker RH & Melillo G (2002) Iden-
tification of small molecule inhibitors of hypoxia-induc-
ible factor 1 transcriptional activation pathway. Cancer
Res 62, 4316–4324.
11 Mabjeesh NJ, Post DE, Willard MT, Kaur B, Van Meir
EG, Simons JW & Zhong H (2002) Geldanamycin
induces degradation of hypoxia-inducible factor 1alpha
protein via the proteosome pathway in prostate cancer
cells. Cancer Res 62, 2478–2482.
12 Isaacs JS, Jung YJ, Mimnaugh EG, Martinez A, Cuttitta
F & Neckers LM (2002) Hsp90 regulates a von Hippel
Lindau-independent hypoxia-inducible factor-1 alpha-
degradative pathway. J Biol Chem 277, 29 936–29 944.
13 Kung AL, Zabludoff SD, France DS, Freedman SJ,
Tanner EA, Vieira A, Cornell-Kennon S, Lee J, Wang
B, Wang J et al. (2004) Small molecule blockade of
transcriptional coactivation of the hypoxia-inducible
factor pathway. Cancer Cell 6, 33–43.
14 Kong D, Park EJ, Stephen AG, Calvani M, Cardellina
JH, Monks A, Fisher RJ, Shoemaker RH & Melillo G
(2005) Echinomycin, a small-molecule inhibitor of
hypoxia-inducible factor-1 DNA-binding activity.
Cancer Res 65, 9047–9055.
15 Yeo EJ, Chun YS, Cho YS, Kim J, Lee JC, Kim MS &
Park JW (2003) YC-1: a potential anticancer drug tar-
geting hypoxia-inducible factor 1. J Natl Cancer Inst 95,
516–525.
16 Formica JV & Waring MJ (1983) Effect of phosphate and
amino acids on echinomycin biosynthesis by Streptomy-
ces echinatus. Antimicrob Agents Chemother 24, 735–741.
17 Van Dyke MM & Dervan PB (1984) Echinomycin bind-
ing sites on DNA. Science
225, 1122–1127.
18 Gordan JD, Bertout JA, Hu CJ, Diehl JA & Simon
MC (2007) HIF-2alpha promotes hypoxic cell prolifera-
tion by enhancing C-myc transcriptional activity. Cancer
Cell 11, 335–347.
19 Zhang H, Gao P, Fukuda R, Kumar G, Krishnamach-
ary B, Zeller KI, Dang CV & Semenza GL (2007)
HIF-1 inhibits mitochondrial biogenesis and cellular res-
piration in VHL-deficient renal cell carcinoma by
repression of C-MYC activity. Cancer Cell 11, 407–420.
20 Ivan M, Kondo K, Yang H, Kim W, Valiando J, Ohh
M, Salic A, Asara JM, Lane WS, Kaelin WG Jr et al.
B. Vlaminck et al. Dual effect of echinomycin on HIF-1 activity
FEBS Journal 274 (2007) 5533–5542 ª 2007 The Authors Journal compilation ª 2007 FEBS 5541
(2001) HIFalpha targeted for VHL-mediated destruction
by proline hydroxylation: implications for O
2
sensing.
Science 292, 464–468.
21 Jaakkola P, Mole DR, Tian YM, Wilson MI, Gielbert J,
Gaskell SJ, Kriegsheim AV, Hebestreit HF, Mukherji M,
Schofield CJ et al. (2001) Targeting of HIF-alpha to the
von Hippel-Lindau ubiquitylation complex by O
2
-regu-
lated prolyl hydroxylation. Science 292, 468–472.
22 Laughner E, Taghavi P, Chiles K, Mahon PC & Semen-
za GL (2001) HER2 (neu) signaling increases the rate of
hypoxia-inducible factor 1alpha (HIF-1alpha) synthesis:
novel mechanism for HIF-1-mediated vascular endothe-
lial growth factor expression. Mol Cell Biol 21,
3995–4004.
23 Treins C, Giorgetti-Peraldi S, Murdaca J, Semenza GL
& Van Obberghen E (2002) Insulin stimulates hypoxia-
inducible factor 1 through a phosphatidylinositol
3-kinase ⁄ target of rapamycin-dependent signaling path-
way. J Biol Chem 277, 27 975–27 981.
24 Bonello S, Zahringer C, BelAiba RS, Djordjevic T, Hess
J, Michiels C, Kietzmann T & Gorlach A (2007) Reac-
tive oxygen species activate the HIF-1alpha promoter
via a functional NFkappaB site. Arterioscler Thromb
Vasc Biol 27, 755–761.
25 Huang J, Song D, Flores A, Zhao Q, Mooney SM,
Shaw LM & Lee FS (2007) IOP1, a novel hydrogenase-
like protein that modulates hypoxia-inducible factor-
1alpha activity. Biochem J 401, 341–352.
26 Minet E, Ernest I, Michel G, Roland I, Remacle J, Raes
M, Michiels C (1999) HIF1A gene transcription is
dependent on a core promoter sequence encompassing
activating and inhibiting sequences located upstream
from the transcription initiation site and cis elements
located within the 5¢UTR. Biochem Biophys Res
Commun 261, 534–540.
27 Chen Y, Takeshita A, Ozaki K, Kitano S & Hanazawa
S (1996) Transcriptional regulation by transforming
growth factor beta of the expression of retinoic acid
and retinoid X receptor genes in osteoblastic cells is
mediated through AP-1. J Biol Chem 271, 31 602–31
606.
28 Renard P, Ernest I, Houbion A, Art M, Le Calvez H,
Raes M & Remacle J (2001) Development of a sensitive
multi-well colorimetric assay for active NFkappaB.
Nucleic Acids Res 29, E21.
29 Michel G, Minet E, Mottet D, Remacle J & Michiels C
(2002) Site-directed mutagenesis studies of the hypoxia-
inducible factor-1alpha DNA-binding domain. Biochim
Biophys Acta 1578, 73–83.
30 James L & Eisenman RN (2002) Myc and Mad bHLHZ
domains possess identical DNA-binding specificities but
only partially overlapping functions in vivo. Proc Natl
Acad Sci USA 99, 10 429–10 434.
31 Sowa Y, Orita T, Minamikawa S, Nakano K, Mizuno
T, Nomura H & Sakai T (1997) Histone deacetylase
inhibitor activates the WAF1 ⁄ Cip1 gene promoter
through the Sp1 sites. Biochem Biophys Res Commun
241, 142–150.
Dual effect of echinomycin on HIF-1 activity B. Vlaminck et al.
5542 FEBS Journal 274 (2007) 5533–5542 ª 2007 The Authors Journal compilation ª 2007 FEBS