Báo cáo khoa học: Ternary complex formation of pVHL, elongin B and elongin C visualized in living cells by a fluorescence resonance energy transfer–fluorescence lifetime imaging microscopy technique docx
Bạn đang xem bản rút gọn của tài liệu. Xem và tải ngay bản đầy đủ của tài liệu tại đây (475.8 KB, 9 trang )
Ternary complex formation of pVHL, elongin B and
elongin C visualized in living cells by a fluorescence
resonance energy transfer–fluorescence lifetime
imaging microscopy technique
Koshi Kinoshita
1,
*, Kenji Goryo
1,
*, Mamiko Takada
2
, Yosuke Tomokuni
1
, Teijiro Aso
3
,
Heiwa Okuda
4
, Taro Shuin
4
, Hiroshi Fukumura
2
and Kazuhiro Sogawa
1
1 Department of Biomolecular Sciences, Graduate School of Life Sciences, Tohoku University, Aoba-ku Sendai, Japan
2 Department of Chemistry, Graduate School of Science, Tohoku University, Aoba-ku Sendai, Japan
3 Department of Functional Genomics, Kochi Medical School, Kohasu, Okoh-cho, Nankoku Kochi, Japan
4 Department of Urology, Kochi Medical School, Kohasu, Okoh-cho, Nankoku Kochi, Japan
The von Hippel–Lindau (VHL) gene is located on the
short arm of chromosome 3 and its deletions or muta-
tions are associated with VHL disease [1,2]. Affected
individuals develop a variety of tumors, including
retinal hemangioblastomas, hemangioblastomas of the
central nervous system, renal cell carcinomas and
pheochromocytomas. Biallelic VHL gene defects are
also found in sporadic malignancies, such as renal cell
carcinomas and hemangioblastomas [3,4]. The VHL
gene product exists in two forms, a larger p30 protein
(pVHL30) and a smaller p19 protein (pVHL19), the
latter generated by internal translation initiation at the
Keywords
conformation change; FRET–FLIM; live cell
imaging; protein complex; ubiquitin ligase
Correspondence
K. Sogawa, Department of Biomolecular
Science, Graduate School of Life Sciences,
Tohoku University, Aoba-ku Sendai
980-8578 Japan
Fax: +81 22 795 6594
Tel: +81 22 795 6590
E-mail:
*These authors contributed equally to this
work
(Received 26 June 2007, revised 21 August
2007, accepted 29 August 2007)
doi:10.1111/j.1742-4658.2007.06075.x
The tumor suppressor von Hippel–Lindau (VHL) gene product forms a com-
plex with elongin B and elongin C, and acts as a recognition subunit of a
ubiquitin E3 ligase. Interactions between components in the complex were
investigated in living cells by fluorescence resonance energy transfer
(FRET)–fluorescence lifetime imaging microscopy (FLIM). Elongin B–ceru-
lean or cerulean–elongin B was coexpressed with elongin C-citrine or citrine-
elongin C in CHO-K1 cells. FRET signals were examined by measuring a
change in the fluorescence lifetime of donors and by monitoring a corre-
sponding fluorescence rise of acceptors. Clear FRET signals between elon-
gin B and elongin C were observed in all combinations, except for the
combination of elongin B-cerulean and citrine-elongin C. Although similar
experiments to examine interaction between pVHL30 and elongin C linked
to cerulean or citrine were performed, FRET signals were rarely observed
among all the combinations. However, the signal was greatly increased by
coexpression of elongin B. These results, together with results of coimmuno-
precipitation experiment using pVHL, elongin C and elongin B, suggest that
a conformational change of elongin C and ⁄ or pVHL was induced by binding
of elongin B. The conformational change of elongin C was investigated by
measuring changes in the intramolecular FRET signal of elongin C linked to
cerulean and citrine at its N- and C-terminus, respectively. A strong FRET
signal was observed in the absence of elongin B, and this signal was modestly
increased by coexpression of elongin B, demonstrating that a conformation
change of elongin C was induced by the binding of elongin B.
Abbreviations
FLIM, fluorescence lifetime imaging microscopy; FRET, fluorescence resonance energy transfer; GFP, green fluorescent protein; VHL, von
Hippel–Lindau.
FEBS Journal 274 (2007) 5567–5575 ª 2007 The Authors Journal compilation ª 2007 FEBS 5567
second methionine [5,6]. Both pVHL proteins are asso-
ciated with two ubiquitous proteins, elongin B and
elongin C, to form a ternary complex (hereafter
referred to as the VBC complex), and its formation is
required for tumor suppressor functions.
Elongin B and elongin C were initially found
together with elongin A in the elongin (SIII) complex
that increases the efficiency of elongation by RNA
polymerase II [7,8]. Biochemical analysis of the com-
plex revealed that elongin A functions as a trans-
criptionally active subunit whereas elongin B and
elongin C act as regulatory subunits. Elongin B and
elongin C bind stably to each other (elongin BC com-
plex), and elongin A has the ability to bind to elon-
gin C but cannot bind directly to elongin B. Elongin B
has a ubiquitin homology domain, whereas elongin C
contains homology to Skp1, a subunit of Skp1-Cul1-F
box ubiquitin ligases. The ubiquitin-like domain of
elongin B was found to be necessary for binding to
elongin C [9]. pVHL shares a common binding site
with elongin A on elongin C, and no direct interaction
occurs between pVHL and elongin B. Thus, interaction
of elongin BC with elongin A and pVHL is mutually
exclusive. The elongin BC complex interacts not only
with elongin A and pVHL, but also with SOCS-box
proteins with a conserved BC-box motif located in the
SOCS-box [10]. Mutations of pVHL that inactivate
binding to elongin C result in the development of
malignant tumors. For formation of the VBC complex,
it has been elucidated that cooperation of the HSP70
and TRiC ⁄ CCT chaperone systems is required [11,12].
The VBC complex further associates with cullin-2 and
a ring-finger protein, Rbx1, to form a larger ubiquitin-
ligase complex, and pVHL acts as the substrate-
binding subunit in the E3 ubiquitin ligase. Hypoxia
activated transcription factors, HIF-1a, HLF (HIF-2a,
EPAS-1) and HIF-3a, are known substrates for ubiqu-
itin ligase [13–16]. Oxygen-dependent hydroxylation of
specific proline residues in the oxygen-dependent deg-
radation domain of the factors are recognized by the
pVHL in the E3 ligase and subsequent ubiquitination
of the factors results in degradation by proteasomes.
Lowered oxygen levels in hypoxia down-regulate prolyl
hydroxylation and increase stabilization of the factors.
Degradation of the factors in normoxia and their sta-
bilization in hypoxia comprise the pivotal mechanism
for cellular hypoxic responses such as the promotion
of glycolysis and vascularization [17,18].
Fluorescence lifetime imaging microscopy (FLIM) is
a recently developed technique that can be applied to
measure fluorescence lifetimes of fluorescent proteins
such as green fluorescent protein (GFP) in living cells.
When combined with fluorescence resonance energy
transfer (FRET), this measurement presents unambigu-
ous evidence for spatial and temporal interactions
between proteins and conformational changes of pro-
teins occurring in living cells. The occurrence of FRET
can be accurately and finely determined by measuring
the reduced fluorescence lifetime of donor proteins in
the presence of acceptors. Because fluorescence lifetime
is, in principle, unaffected by changes in probe concen-
tration or excitation intensity, FRET–FLIM has
advantages over intensity-based FRET techniques. In
particular, FRET–FLIM has advantages in intermole-
cular FRET measurement in which expression levels of
the two fluorescent proteins cannot be easily controlled
in individual cells [19–21].
In the present study, we monitored the fluorescence
rise of acceptor fluorescent proteins as distinctive evi-
dence for the occurrence of FRET in addition to the
decreased fluorescence lifetimes of donor proteins
using time-domain FLIM. Using the FRET–FLIM
technique, we observed strong intermolecular FRET
signals between elongin B and elongin C. For stable
binding of pVHL30 to elongin C, we found that the
coexistence of elongin B is necessary to induce a con-
formational change of elongin C.
Results
Imaging of interaction between elongin B and
elongin C
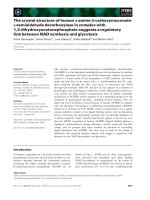
As shown in Fig. 1A, cerulean-elongin B and elon-
gin B-cerulean were expressed throughout cells, and
citrine-elongin C and elongin C-citrine were similarly
expressed in the cells. As a first step to examine interac-
tion between elongin B and elongin C by FRET–FLIM,
the fluorescence lifetime of cerulean-elongin B and
elongin B-cerulean, which were separately expressed in
CHO-K1 cells, was determined, using a subnanosecond
410 nm light-emitting diode and a time- and space-
correlated single photon counting detector on a FLIM
microscope. A representative FLIM image of cells
expressing cerulean-elongin B is shown in Fig. 1B.
Its lifetime was fairly constant throughout the cells,
and similar lifetimes were observed in different cells
expressing the fluorescent protein (Fig. 1B). Fig-
ure 1C,D shows a fluorescence decay curve of ceru-
lean-elongin B, which was further analyzed by
following a two-component model. Two lifetimes,
1.32 ns and 3.54 ns, were calculated from the curve
with ratio coefficients of 37.9% and 62.1%, respec-
tively (Table 1). The decay curve of elongin B-cerulean
was similarly analyzed as shown in Fig. 1E,F, and the
lifetimes, 1.38 ns and 3.41 ns, were almost identical to
FRET imaging of the VBC complex K. Kinoshita et al.
5568 FEBS Journal 274 (2007) 5567–5575 ª 2007 The Authors Journal compilation ª 2007 FEBS
those of cerulean-elongin B (Table 1). The v
2
values of
the fit were between 1.0 and 1.3 and between 1.0 and
1.2, respectively, indicating that the overall model fit-
ting was statistically significant. The decays were also
analyzed according to a three-exponential model as
reported by Millington et al. [22], resulting in only a
modest improvement of fit as judged from v
2
values;
the values were reduced by approximately 4% or less
by the three-exponential fitting.
Next, we coexpressed acceptor fluorescent proteins
together with donor fluorescent proteins in the follow-
ing four combinations: cerulean-elongin B and citrine-
elongin C; cerulean-elongin B and elongin C-citrine;
elongin B-cerulean and elongin C-citrine; and elon-
gin B-cerulean and citrine-elongin C. Transfected cells
with coexpression of moderate amounts of two fluo-
rescent proteins, cerulean-elongin B and citrine-
elongin C, were randomly chosen for measuring
fluorescence decay of the two proteins. As shown in
Fig. 1C, decay of fluorescence of cerulean-elongin B in
the presence of coexpressed citrine-elongin C was sig-
nificantly faster than that of separately expressed ceru-
lean-elongin B. The two lifetimes of donor, s
1
and s
2
,
were decreased to 0.93 ns and 3.05 ns, respectively, in
the presence of the acceptor (Table 1), indicating trans-
fer of energy between the two fluorescent proteins.
This decrease in the fluorescence lifetime of donors
was clearly observed when their FLIM images were
compared (Fig. 1B). The FLIM image of cerulean-
elongin B in the presence of citrine-elongin C suggests
that the interaction between the two fluorescent pro-
teins homogeneously occurred in the cells. The
0.01
0
1
0.1
Intensity/a.u.
2
4
6
810
12
14
Time/ns
Cit
Cit
0.01
0
1
0.1
Intensity/a.u.
2
4
6
810
12
14
Time/ns
Cit
0.01
0
1
0.1
Intensity/a.u.
2
4
6
810
12
14
Time/ns
0.01
0
1
0.1
Intensity/a.u.
2
4
6
810
12
14
Time/ns
550-600nm
450-500nm
0.01
0
1
0.1
Intensity/a.u.
2
4
6
810
12
14
Time/ns
0.01
0
1
0.1
Intensity/a.u.
2
4
6
810
12
14
Time/ns
Ceru
0.01
0
1
0.1
Intensity/a.u.
2
4
6
810
12
14
Time/ns
0.01
0
1
0.1
Intensity/a.u.
2
4
6
810
12
14
Time/ns
Ceru-EloB
Ceru-EloB
+ Cit-EloC
Ceru-EloB
+ Cit-EloC
Cit-EloC
Ceru-EloB
Ceru-EloB
+ EloC-Cit
EloC-Cit
Ceru-EloB
+ EloC-Cit
EloB-Ceru EloC-Cit
EloB-Ceru
+ EloC-Cit
EloB-Ceru
+ EloC-Cit
EloB-Ceru
Cit-EloC
+ Cit-EloC
EloB-Ceru
+ Cit-EloC
EloB-Ceru
2.0
2.5
3.0
3.5
4.0
ns)(
2.0
2.5
3.0
3.5
4.0
(ns)
Ceru-EloB
Ceru-EloB + Cit-EloC
Ceru-EloB Cit-EloCEloB-Ceru EloC-Cit
mock
Ceru-EloB
EloB-Ceru
Cit-EloC
EloC-Cit
A
C
D
E
F
B
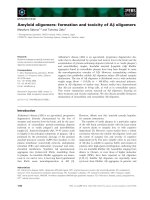
Fig. 1. FLIM analysis of interaction between elongin B and elon-
gin C in CHO-K1 cells. (A) Cellular localization of elongin B linked to
cerulean and elongin C linked to citrine. Chimeric proteins, ceru-
lean-elongin B (Ceru-EloB), elongin B-cerulean (EloB-Ceru), citrine-
elongin C (Cit-EloC) and elongin C-citrine (EloC-Cit) were transiently
expressed in CHO-K1 cells by DNA transfection using the lipofec-
tion method. Forty hours after transfection, fluorescence of ceru-
lean and citrine moieties of the chimeric proteins was observed
with an Olympus BX50 fluorescent microscope with a filter set
(Olympus U-MCFPHQ and U-MYFPHQ). Scale bar ¼ 20 lm. A typi-
cal result of immunoblot analysis of whole cell extracts of cells
expressing cerulean-linked elongin B or citrine-linked elongin C was
shown using anti-GFP serum, as shown below. Lane 1, mock;
lane 2, cerulean-elongin B; lane 3, elongin B-cerulean; lane 4,
citrine-elongin C; lane 5, elongin C-citrine. (B) FLIM image of ceru-
lean-elongin B in the presence or absence of citrine-elongin C. A
lifetime map was made from time- and space-correlated single pho-
ton counting data by fitting data to a single exponential decay. In
the FLIM map, color corresponds to the fluorescence lifetime indi-
cated by a false color scale. (C–F) CHO-K1 cells were transfected
with plasmids encoding: (C) cerulean-elongin B and elongin C-
citrine; (D) elongin B-cerulean and elongin C-citrine; (E) cerulean-
elongin B and citrine-elongin C; and (F) elongin B-cerulean and
citrine-elongin C. The fluorescence decay curve of cerulean (shown
in blue) and citrine (shown in green) represents an average of fluo-
rescence decay data obtained from cells observed. For comparison,
the decay curve of cerulean-linked elongin B without acceptor
(shown in black) or the decay curve of citrine-linked elongin C with-
out donor (shown in black) are also shown.
K. Kinoshita et al. FRET imaging of the VBC complex
FEBS Journal 274 (2007) 5567–5575 ª 2007 The Authors Journal compilation ª 2007 FEBS 5569
fluorescence decay curve of citrine-elongin C coex-
pressed with cerulean-elongin B was also obtained as
shown in Fig. 1C. When its decay curve was compared
with that of citrine-elongin C, a clear fluorescence rise
in the curve was observed. A similar level of FRET sig-
nals could be detected in the combination of cerulean-
elongin B and elongin C-citrine, as shown in Fig. 1D
and Table 1. FRET between elongin B-cerulean and
elongin C-citrine was weak (Fig. 1E), and FRET sig-
nals were very weak for the combination of elongin B-
cerulean and citrine-elongin C (Fig. 1F and Table 1).
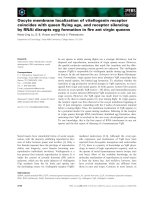
Interaction between elongin C and pVHL30
A chimeric fluorescent protein, pVHL30-cerulean, was
expressed in CHO-K1 cells by DNA transfection. As
shown in Fig. 2A, it was distributed throughout the
cells with stronger expression in the cytoplasm. By
western blotting analysis, it was found that a small
amount of pVHL19-cerulean was also expressed. Life-
times were determined on the FLIM microscope as
shown in Table 2. We constructed a plasmid only for
expression of pVHL19-cerulean, introduced it into the
Table 1. Fluorescence decay data for cerulean-linked elongin B and citrine-linked elongin C expressed in living CHO-K1 cells. Data are
derived from whole cell regions of interest and are expressed as mean ± SD. a
1
and a
2
are the exponential coefficients (%) for the s
1
and s
2
decay times, respectively. n, number of cells examined.
Combination of protein a
1
(%) s
1
(ns) a
2
(%) s
2
(ns) n v
2
Cerulean-elongin B 37.9 1.32 ± 0.06 62.1 3.54 ± 0.08 10 1.0–1.3
Elongin B-cerulean 36.2 1.38 ± 0.05 63.8 3.41 ± 0.04 8 1.0–1.2
Cerulean-elongin B-citrine-elongin C 52.4 0.93 ± 0.20 47.6 3.05 ± 0.23 8 1.0–1.3
Cerulean-elongin B-elongin C-citrine 44.1 1.17 ± 0.06 55.9 3.30 ± 0.28 12 1.0–1.8
Elongin B-cerulean-elongin C-citrine 38.0 1.20 ± 0.07 62.0 3.23 ± 0.07 10 1.0–1.4
Elongin B-cerulean-citrine-elongin C 37.5 1.26 ± 0.10 62.5 3.30 ± 0.11 10 1.0–1.3
pVHL-Ceru
mock
pVHL-Ceru
0.01
1
0.1
Intensity/a.u.
024 68101214
Time/ns
`
Ceru
Cit
450-500nm
550-600nm
0.01
1
0.1
Intensity/a.u.
02468101214
Time/ns
0.01
1
0.1
Intensity/a.u.
02468101214
Time/ns
0.01
1
0.1
Intensity/a.u.
02468101214
Time/ns
HA-pVHL
FLAG-EloC
Myc-EloB
-
-
-
-
+
-
+
+
-
-
+
+
+
+
+
WB : anti-FLAG
WB : anti-Myc
WB : anti-FLAG
WB : anti-HA
pVHL
Elongin C
Elongin B
Elongin C
pVHL
Elongin B
WB : anti-HA
WB : anti-Myc
IP :
anti-FLAG
Input
pVHL-Ceru
pVHL-Ceru
+ Cit-EloC
Cit-EloC
pVHL-Ceru
+ Cit-EloC
Cit-EloC
pVHL-Ceru
+ Cit-EloC
+ EloB
pVHL-Ceru
+ Cit-EloC
+ EloB
pVHL-Ceru
A
B
C
D
Fig. 2. Interaction between pVHL and elongin C induced by elon-
gin B. (A) Cellular localization of pVHL linked to cerulean. A chime-
ric protein, pVHL-cerulean (pVHL-Ceru), was transiently expressed
in CHO-K1 cells by DNA transfection using the lipofection method.
Forty hours after transfection, fluorescence of cerulean moiety of
the chimeric proteins was observed with an Olympus BX50 fluores-
cent microscope with a filter set (Olympus U-MCFPHQ). Scale
bar ¼ 20 lm. A typical result of western blotting for expressed pro-
teins of pVHL-cerulean is shown on the right. CHO-K1 cells were
transfected with plasmids encoding (B) pVHL-cerulean and citrine-
elongin C and (C) pVHL-cerulean and citrine-elongin C coexpressed
with elongin B. The fluorescence decay curve of cerulean (shown
in blue) and citrine (shown in green) represents an average of fluo-
rescence decay data obtained from cells observed. For comparison,
the decay curve of pVHL-cerulean without acceptor protein (shown
in black) or the decay curve of citrine-linked elongin C without
donor protein (shown in black) are also shown. (D) Coimmunopre-
cipitation analysis of pVHL, elongin B and elongin C. HA-pVHL,
myc-elongin B and Flag-elongin C were expressed in CHO-K1 cells.
Whole cell extracts were treated with anti-Flag serum. Co-precipi-
tated proteins were visualized with anti-HA, anti-Flag or anti-myc
sera after electrophoresis and subsequent electroblotting to a nitro-
cellulose membrane; 5% input is shown.
FRET imaging of the VBC complex K. Kinoshita et al.
5570 FEBS Journal 274 (2007) 5567–5575 ª 2007 The Authors Journal compilation ª 2007 FEBS
cells and measured lifetimes of expressed pVHL19-
cerulean. Almost identical lifetimes to those of
pVHL30-cerulean were obtained (data not shown).
When an acceptor chimeric protein, citrine-elongin C
was coexpressed with pVHL30-cerulean, the lifetimes
of cerulean moiety showed only a minimal decrease
(Fig. 2B and Table 2). We expressed donor and accep-
tor proteins in the pairs pVHL30-cerulean and elon-
gin C-citrine, cerulean-pVHL30 and citrine-elongin C,
and cerulean-pVHL30 and elongin C-citrine, and
determined lifetimes of donors. Non-existent or negli-
gible FRET signals were observed similar to the pair
of pVHL30-cerulean and citrine-elongin C (data not
shown). These results suggest two possibilities; one is
that interaction between pVHL30 and elongin C rarely
occurs in the cells, and the other is that interaction
occurs when the fluorophores are separated by more
than 10 nm. We expressed elongin B together with
pVHL30-cerulean and citrine-elongin C, and the inter-
action between pVHL30 and elongin C was investi-
gated by FRET–FLIM. As shown in Fig. 2C and
Table 2, clear FRET signals, decrease in lifetimes of
pVHL30-cerulean and fluorescence rise in the decay
curve of acceptors, could be detected, only when elon-
gin B was coexpressed. To examine the interaction
between pVHL and elongin C, a coimmunoprecipita-
tion experiment was performed. As shown in Fig. 2D,
an interaction between elongin C and VHL30 existed
in the absence of elongin B, and considerable stabiliza-
tion of pVHL and elongin C was observed with the
coexistence of elongin B.
Taken together, these results indicate that distance
between donor and acceptor in the pair of pVHL30-
cerulean and citrine-elongin C is so separated that
energy transfer was below the detection level.
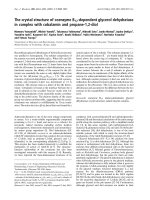
Conformational change of elongin C induced by
binding of elongin B
Increased FRET signals between pVHL-cerulean and
citrine-elongin C by coexpression of elongin B suggest
that a conformation change of elongin C induced by
binding of elongin B may occur and that this confor-
mational change of elongin C leads to stabilization of
elongin C and pVHL. To visualize the conformational
change in living cells, intramolecular FRET measure-
ment using a chimeric protein of cerulean-elongin C-
citrine was carried out in the presence or absence of
elongin B. Without the coexistence of elongin B, a con-
siderable decrease in donor fluorescence lifetime was
observed (Fig. 3B and Table 3) compared to that of
cerulean-elongin C-citrine(Y66A) in that fluorophore
formation in the citrine moiety was abolished by the
mutation of Tyr66 to Ala (Fig. 3A). A decrease in the
lifetimes was further augmented by the coexpression of
elongin B as shown in Fig. 3D and Table 3. This
decrease was modest but reproducible in three indepen-
dent experiments. Coimmunoprecipitation experiments
indicated that the presence of fluorescent proteins at
N- and C-terminal ends of elongin C did not affect the
binding of elongin B to elongin C moiety (Fig. 3C).
Discussion
We used cerulean as the FRET donor because the flu-
orescence lifetime of this protein is reported to be the
best fit by a single exponential [23], which greatly sim-
plifies quantitative analysis of FRET data compared to
donors with a double exponential decay. However, our
results clearly demonstrated that the decay curve of
cerulean is the best fit by a double exponential such as
CFP. This finding agrees with the results of Millington
et al. [22]. Two fluorescent lifetimes of cerulean and
their fraction ratios displayed in the literature are simi-
lar to those obtained in the present study. Despite the
complex decay profiles, cerulean was useful as a FRET
donor because it shows a higher quantum yield and
extinction coefficient than other donors like CFP. In
addition to analysis of the decay curve of donors, we
examined the decay of acceptors, and found a fluores-
cence rise in the curve that inevitably results from
energy transfer as shown in Figs 1–3. Simultaneous
determinations of the two FRET indicators clearly
demonstrate the occurrence of FRET and minimize
risk due to interference from sample autofluorescence.
It is also reported that reduced lifetimes of donors can
occur by the strong illumination from a mercury lamp
[24,25]. Excitation levels at the sample surface under
Table 2. Fluorescence decay data for cerulean-linked pVHL30 and citrine-linked elongin C. Data are derived from whole cell regions of inter-
est and are expressed as mean ± SD. a
1
and a
2
are the exponential coefficients (%) for the s
1
and s
2
decay times, respectively. n, number
of cells examined.
Combination of protein a
1
(%) s
1
(ns) a
2
(%) s
2
(ns) n v
2
VHL-cerulean 39.0 1.26 ± 0.06 61.0 3.40 ± 0.07 8 1.0–1.2
VHL-cerulean-citrine-elongin C 43.5 1.23 ± 0.13 56.5 3.38 ± 0.18 10 1.0–1.2
VHL-cerulean-citrine-elongin C-elongin B 51.4 1.05 ± 0.05 48.6 3.18 ± 0.20 10 1.0–1.2
K. Kinoshita et al. FRET imaging of the VBC complex
FEBS Journal 274 (2007) 5567–5575 ª 2007 The Authors Journal compilation ª 2007 FEBS 5571
the FLIM microscope used in the present study were
very low (approximately 15 mWÆcm
)2
) so that no pho-
todynamic reactions took place.
FRET signals between cerulean-linked elongin B
and citrine-linked elongin C can be detected in the fol-
lowing donor-acceptor combinations in decreasing
order: cerulean-elongin B and citrine-elongin C >
cerulean-elongin B and elongin C-citrine elongin B-
cerulean and elongin C-citrine. FRET signals from the
pair of elongin B-cerulean and citrine-elongin C were
modest (Table 1). Since the rate of energy transfer
depends on the inverse sixth power of the distance
between donor and acceptor, this result matches with
the results from the X-ray crystallography of the VBC
complex [26]; the distance between the C-terminal end
of elongin B and the N-terminal end of elongin C used
for the FRET pair of elongin B-cerulean and citrine-
450-500nm
0.01
1
0.1
Intensity/a.u.
0
2
4
6
810
12
14
Time/ns
550-600nm
Cerulean
Cit
Ceru
Cit
Cerulean
Cerulean
Cerulean
Cerulean
Cit
Cerulean
Cit
Cit
0.01
1
0.1
Intensity/a.u.
0
2
4
6
810
12
14
Time/ns
0.01
1
0.1
Intensity/a.u.
0
2
4
6
810
12
14
Time/ns
0.01
1
0.1
Intensity/a.u.
0
2
4
6
810
12
14
Time/ns
0.01
1
0.1
Intensity/a.u.
0
2
4
6
810
12
14
Time/ns
0.01
1
0.1
Intensity/a.u.
0
2
4
6
810
12
14
Time/ns
Myc-EloB
Ceru-EloC-Cit
Ceru(W66A)-EloC-Cit
Ceru-EloC-Cit(Y66A)
-
-
-
-
+
-
-
-
+
+
-
-
+
-
+
-
+
-
-
+
WB : anti-Myc
WB : anti-GFP
WB : anti-Myc
WB : anti-GFP
Elongin C
Elongin C
Elongin B
Elongin B
IP : anti-Myc
Input
Ceru(W66A)-EloC-Cit
+ EloB
Ceru-EloC-Cit
+ EloB
Cerulean
Ceru-EloC-Cit
+ EloB
Cerulean
Ceru-EloC-Cit
Ceru(W66A)-EloC-Cit
Ceru-EloC-Cit
Ceru-EloC-Cit(Y66A)
Ceru-EloC-Cit
Ceru-EloC-Cit(Y66A)
+ EloB
Ceru-EloC-Cit
+ EloB
Ceru-EloC-Cit
Ceru-EloC-Cit
+ EloB
mock
Ceru-EloC-Cit
Ceru(W66A)-EloC-Cit
Ceru-EloC-Cit(Y66A)
Cerulean
Citrine
Ceru-EloC-Cit Ceru-EloC-Cit(Y66A) Ceru(W66A)-EloC-Cit
A
B
C
D
E
Fig. 3. Intramolecular FRET of elongin C conjugated with cerulean
and citrine at its N- and C-termini, respectively. (A) Cellular
images expressing cerulean-elongin C-citrine or its mutant pro-
teins. Chimeric proteins, cerulean-elongin C-citrine and its mutant
proteins, cerulean(W66A)-elongin C-citrine and cerulean-elongin C-
citrine(Y66A), were transiently expressed in CHO-K1 cells by DNA
transfection using the lipofection method. Forty hours after trans-
fection, fluorescence of cerulean and citrine moieties of the chime-
ric proteins was observed with an Olympus BX50 fluorescent
microscope with a filter set (Olympus U-MCFPHQ and U-MY-
FPHQ). Scale bars ¼ 20 lm. A typical result of western blotting for
expressed proteins is shown on the right. (B) FLIM analysis of
cerulean-elongin C-citrine in living CHO-K1 cells. CHO-K1 cells
were transfected with a plasmid encoding cerulean-elongin C-
citrine for FLIM analysis. For comparison, the decay curve of ceru-
lean-elongin C-citrine(Y66A) or cerulean(W66A)-elongin C-citrine is
shown. (C) FLIM analysis of cerulean-elongin C-citrine expressed
with elongin B. For comparison, the decay curve of cerulean-
elongin C-citrine(Y66A) or cerulean(W66A)-elongin C-citrine coex-
pressed with elongin B is shown. (D) Comparison of the decay
curves of cerulean-elongin C-citrine expressed with or without
elongin B. Two decay curves of cerulean-elongin C-citrine obtained
in the absence or presence of elongin B are shown in blue and red,
respectively. (E) Coimmunoprecipitation analysis of cerulean-elon-
gin C-citrine with elongin B. A plasmid for cerulean-elongin C-citrine
or its mutants was introduced into CHO-K1 cells with a plasmid for
myc-elongin B. Whole cell extracts were treated with anti-myc
serum and coprecipitated cerulean-elongin C-citrine protein or its
mutants was visualized by anti-GFP serum after electrophoresis
and subsequent electroblotting to a nitrocellulose membrane; 5%
input is shown.
Table 3. Fluorescence decay data for elongin C-linked to cerulean and citrine. Citrine(Y66A) indicates a mutated citrine with mutation of
Tyr66 to Ala. Data are derived from whole cell regions of interest and are expressed as mean ± SD. a
1
and a
2
are the exponential coeffi-
cients (%) for the s
1
and s
2
decay times, respectively. n, number of cells examined.
Combination of protein a
1
(%) s
1
(ns) a
2
(%) s
2
(ns) n v
2
Cerulean-elongin C-citrine(Y66A) 34.7 1.32 ± 0.08 65.3 3.47 ± 0.02 6 1.0–1.3
Cerulean-elongin C-citrine(Y66A)-elongin B 36.5 1.31 ± 0.11 63.5 3.44 ± 0.08 6 1.0–1.2
Cerulean-elongin C-citrine 44.8 0.94 ± 0.07 55.2 2.98 ± 0.08 8 1.0–1.3
Cerulean-elongin C-citrine elongin B 43.1 0.93 ± 0.08 56.9 2.83 ± 0.09 10 1.0–1.2
FRET imaging of the VBC complex K. Kinoshita et al.
5572 FEBS Journal 274 (2007) 5567–5575 ª 2007 The Authors Journal compilation ª 2007 FEBS
elongin C is relatively long (4.7 nm) compared to dis-
tances (2–3 nm) between other combinations of termi-
nal ends of elongin B and elongin C, although the
effects caused by the binding of pVHL on the 3D struc-
ture of the elongin BC complex are not exactly known.
The present study has clarified that conformation of
pVHL and ⁄ or elongin C in the absence of elongin B
was different from that in the VBC complex and that
conformation of elongin C was changed upon binding
of elongin B. The coimmunoprecipitation experiment
(Fig. 2D) demonstrated that a remarkable stabilization
of elongin C was caused by the binding of elongin B
and, to a lesser extent, stabilization of pVHL was also
found as previously reported [27,28]. The conforma-
tional change of elongin C may be associated with the
stabilization of the proteins. To date, the role of elon-
gin B in the large E3 ubiquitin-ligase complex includ-
ing the VBC-Cul2-Rbx1 is not understood because no
direct interaction is present between elongin B and
other components except for elongin C, and the fact
that there is no obvious elongin B homologue in yeast
obscured its physiological function [29]. The present
study strongly suggests that elongin B is required to
alter the conformation of elongin C that leads to sta-
bilization of elongin C and pVHL.
In summary, we have shown that interactions
between components of the VBC complex can be visu-
alized in living cells by a FRET–FLIM technique.
Strong FRET signals were observed between elongin B
and elongin C. Conformational changes of elongin C
were caused by the binding of elongin B. In the pres-
ent study, we demonstrated that the fluorescence rise
in the decay curves of acceptors can be used as a sensi-
tive indicator for the occurrence of FRET as well as
donor lifetime-based measurements.
Experimental procedures
Plasmid construction
pCerulean-elongin B was constructed by inserting the
blunt-ended XspI-SmaI fragment of pCI neo-elongin B into
the blunt-ended BspEI site of pCerulean-C1. pCerulean-
elongin C and pcitrine-elongin C were similarly constructed
by inserting the blunt-ended BstBI-SmaI fragment of pCI
neo-elongin C into the blunt-ended BspEI site of pcerulean-
C1 and pcitrine-C1, respectively. For the plasmid construc-
tion for elongin C-citrine, the stop codon of elongin C
was changed to GGA by using primers 5¢-CCCAAGC
TTATGGATGGAGGAGGAGAAAAC-3¢ and 5¢-ACGT
ACCGGTCCACAATCTAGGAAGTTTGCAGC-3¢. After
digestion of the PCR fragment by EcoRI and AgeI, the
fragment was inserted into the EcoRI and AgeI sites of
pcitrine-N1. pVHL-cerulean was similarly constructed by
PCR using primers 5¢-CGGAATTCCGATGCCCCGGA
GGGCGGAGAACTG-3¢ and 5¢-ACGTACCGGTCCG
CAATCTCCCATCCGTTGATGTG-3¢, and pcerulean-N1.
pBOS-HA was constructed by insertion of the annealed
fragment of the synthesized oligonucleotides, 5¢-CTAGAC
CACCATGTACCCCTACGACGTGCCCGACTACGCCG
ATATCCCGGGTTAACT-3¢ and 5¢-CTAGAGTTAACC
CGGGATATCGGCGTAGTCGGGCACGTCGTAGGGG
TACATGGTGGT-3¢, into the XbaI site of pBOS Vector.
pBOS-Myc and pBOSFlag were constructed similarly by
using the synthesized oligonucleotides 5¢-CTAGACCA
CCATGGAGGAACAGAAGCTGATCAGTGAGGAAG
ACCTGGATATCCCGGGTTAACT-3¢ and 5¢-CTAGAG
TTAACCCGGGATATCCAGGTCTTCCTC ACTGATCA
GCTTCTGTTCCTCCATGGTGGT-3¢, and 5¢-CTAGAC
CACCATGGACTACAAAGACGATGACGATAAAGAT
ATCCCGGGTTAACT-3¢ and 5¢-CTAGAGTTAACCCGG
GATATCTTTATCGTC ATCGTCTTT GTAGTCC ATGG
TGGT-3¢, respectively. pBOS-HA-pVHL was constructed
by inserting the blunt-ended XhoI-AgeI fragment of pVHL-
cerulean into the HpaI site of pBOS-HA. PBOS-FLAG-
elongin C was constructed by inserting the blunt ended
BstBI-SmaI fragment of pCIneo-elongin C into the SmaI
site of pBOS-FLAG. PBOS-Myc-elongin B was constructed
by inserting blunt-ended XhoI-SmaI fragment of pCIneo-
elongin B into the HpaI site of pBOS-Myc. pCerulean-elon-
gin C-citrine was constructed by inserting the EcoRV-HpaI
fragment of the plasmid for elongin C-citrine into the
EcoRV-HpaI site of pcerulean-elongin C. pCerulean
(W66A)-C1 was constructed by site-directed mutagenesis,
using the primers 5¢-CGTGACCACCCTGACCGCGGG
CGTGCAGTGCTTC-3¢ and 5¢-GAAGCACTGCACGCC
CGCGGTCAGGGTGGTCACG-3¢. pCerulean(W66A)-
elongin C-citrine was constructed by inserting the
BsrGI-EcoRI fragment of pcerulean-elongin C and the
EcoRI-HpaI fragment of elongin C-citrine into the BsrGI-
HpaI site of pcerulean(W66A)-C1. pcitrine(Y66A)-N1 was
similarly constructed by site-directed mutagenesis, using the
primers 5¢-TCGTGACCACCTTCGGCGCCGGCCTGAT
GTGCTTCG-3¢ and 5¢-CGAAGCACATCAGGCCGGCG
CCGAAGGTGGTCACGA-3¢. pCerulean-elongin C-citrine
(Y66A) was constructed by inserting the BsrGI-AgeI frag-
ment of pcerulean-elongin C-citrine and the AgeI-HpaI
fragment of pcitrine(Y66A)-N1 into the BsrGI-HpaI site of
pcerulean-C1.
Cell culture and DNA transfection
CHO-K1 cells were provided by the Cell Resource Center
for Biomedical Research (Institute of Development, Aging
and Cancer, Tohoku University, Japan) and grown on poly
d-lysine coated glass bottom culture dishes (35 mm, MatTeK
Corporation, Ashland, MA, USA) in phenol red-free
K. Kinoshita et al. FRET imaging of the VBC complex
FEBS Journal 274 (2007) 5567–5575 ª 2007 The Authors Journal compilation ª 2007 FEBS 5573
Dulbecco’s modified Eagle’s medium (Invitrogen, Carlsbad,
CA, USA) supplemented with 10% fetal bovine serum, 1%
nonessential amino acid solution (Invitrogen), 2 mml-gluta-
mine (Sigma, Saint Louis, MO, USA) and 40 lgÆmL
)1
kana-
mycin. DNA (0.5 lg) consisting of equal amounts of each
expression plasmid was introduced into CHO-K1 cells by the
lipofection method using FuGene 6 reagent (Roche, Basel,
Switzerland). Cells were incubated 40 h after transfection
and observed by a FLIM microscope. The transfected cells
were fixed with 4% formaldehyde and the cells were observed
by fluorescence microscope as described previously [30].
Western blotting and immunoprecipitation
Whole cell extracts were prepared from CHO-K1 cells
transfected with plasmids encoding chimeric fluorescent
proteins by mixing 10 mm Tris ⁄ HCl buffer, pH 7.5, con-
taining 1 mm EDTA, 0.15 m NaCl, 1 mm dithiothreitol,
1% Triton X-100, 1% sodium deoxycholate, 0.1% SDS,
10 lm MG132 and protease inhibitor cocktail (Roche). Pro-
teins were resolved by 12% SDS ⁄ PAGE, and transferred to
a nitrocellulose membrane (GE Healthcare, Piscataway, NJ,
USA). Polyclonal anti-GFP serum (Clontech, Mountain
View, CA, USA) diluted 1 : 1000 and donkey anti-rabbit
horseradish peroxidase linked IgG (GE Healthcare) diluted
1 : 10000 were used as the first and second antibodies,
respectively. The membrane was developed using the ECL
plus detection system (GE Healthcare). CHO-K1 cells were
transfected with plasmids for HA-tagged pVHL, Flag-
tagged elongin C and myc-tagged elongin B, harvested,
lysed and exposed to Flag-affinity agarose beads (Sigma)
that had been pretreated with anti-Flag serum. Proteins
bound to washed beads were eluted, boiled and separated
by 15% SDS ⁄ PAGE. After electrophoresis, the proteins
were blotted onto a nitrocellulose membrane and probed
with anti-FLAG (Sigma), anti-HA (MBL, Nagoya, Japan)
or anti-Myc (MBL) sera. Coimmunoprecipitation of elon-
gin B and cerulean-elongin C-citrine was similarly per-
formed.
Measurement of fluorescence lifetime
Techniques to measure FRET include FLIM to detect
decreases in the lifetime of donor fluorescence and fluores-
cence rise in the acceptor decay curve that are accompanied
by FRET. FLIM measurements were conducted on the live
cells at 37 °C after the culture medium was replaced with
fresh medium. The emission lifetimes of fluorescent cells
were measured on an inverted microscope (Axiovert 135,
· 100 oil immersion objective with NA ¼ 1.3; Carl Zeiss,
Oberkochen, Germany) equipped with a disk-anode
microchannel-plate photomultiplier (Europhoton, Berlin,
Germany), which can detect photons in a time- and space-
resolved fashion by using a time correlated single photon
counting technique. Spatial resolution can be obtained with
a quadrant-anode, the details of which are provided else-
where [31,32]. The excitation source was a 410 nm picosec-
ond diode laser (FWHM 78 ps, LDH-P-C-400; PicoQuant,
Berlin, Germany), which illuminates a relatively large area
of approximately 100 lm in diameter and was operated at
a repetition rate of 10 MHz. Average excitation power was
estimated to be approximately 15 mWÆcm
)2
, which is equiv-
alent to the single photon counting level. Fluorescence from
live cell samples was sequentially collected within the same
cells at 475 ± 25 nm for cerulean and 575 ± 25 nm for
citrine by band-pass filters. Fluorescence lifetime data were
analyzed using global analysis with multiexponential decays
[33]. Peak values of photon counting were approximately
2000 counts. CCD images of cells were obtained with an
Olympus DP70 CCD camera (Olympus, Tokyo, Japan).
Acknowledgements
This work was supported in part by Grant-In-Aid for
research from the Ministry of Education, Culture,
Sports, Science and Technology of Japan.
References
1 Latif F, Tory K, Gnarra J, Yao M, Duh FM, Orcutt
ML, Stackhouse T, Kuzmin I, Modi W, Geil L et al.
(1993) Identification of the von Hippel–Lindau disease
tumor suppressor gene. Science 260, 1317–1320.
2 Chen F, Kishida T, Yao M, Hustad T, Glavac D, Dean
M, Gnarra JR, Orcutt ML, Duh FM, Glenn G et al.
(1995) Germline mutations in the von Hippel–Lindau
disease tumor suppressor gene: correlations with pheno-
type. Hum Mutat 5, 66–75.
3 Foster K, Prowse A, van den Berg A, Fleming S, Huls-
beek MM, Crossey PA, Richards FM, Cairns P, Affara
NA, Ferguson-Smith MA et al. (1994) Somatic muta-
tions of the von Hippel–Lindau disease tumour suppres-
sor gene in non-familial clear cell renal carcinoma. Hum
Mol Genet 3, 2169–2173.
4 Gnarra JR, Tory K, Weng Y, Schmidt L, Wei MH, Li
H, Latif F, Liu S, Chen F, Duh FM et al. (1994) Muta-
tions of the VHL tumour suppressor gene in renal carci-
noma. Nat Genet 7, 85–90.
5 Iliopoulos O, Ohh M & Kaelin WG Jr (1998) pVHL
19
is a biologically active product of the von Hippel–Lin-
dau gene arising from internal translation initiation.
Proc Natl Acad Sci USA 95, 11661–11666.
6 Schoenfeld A, Davidowitz EJ & Burk RD (1998) A sec-
ond major native von Hippel–Lindau gene product, ini-
tiated from an internal translation start site, functions
as a tumor suppressor. Proc Natl Acad Sci USA 95,
8817–8822.
7 Bradsher JN, Jackson KW, Conaway RC & Conaway
JW (1993) RNA polymerase II transcription factor SIII.
FRET imaging of the VBC complex K. Kinoshita et al.
5574 FEBS Journal 274 (2007) 5567–5575 ª 2007 The Authors Journal compilation ª 2007 FEBS
I. Identification, purification, and properties. J Biol
Chem 268, 25587–25593.
8 Aso T, Lane WS, Conaway JW & Conaway RC (1995)
Elongin (SIII): a multisubunit regulator of elongation
by RNA polymerase II. Science 269, 1439–1443.
9 Brower CS, Shilatifard A, Mather T, Kamura T, Takagi
Y, Haque D, Treharne A, Foundling SI, Conaway JW
& Conaway RC (1999) The elongin B ubiquitin homol-
ogy domain. Identification of elongin B sequences
important for interaction with elongin C. J Biol Chem
274, 13629–13636.
10 Kamura T, Sato S, Haque D, Liu L, Kaelin WG Jr,
Conaway RC & Conaway JW (1998) The elongin BC
complex interacts with the conserved SOCS-box motif
present in members of the SOCS, ras, WD-40 repeat,
and ankyrin repeat families. Genes Dev 12, 3872–3881.
11 Feldman DE, Thulasiraman V, Ferreyra RG & Fryd-
man J (1999) Formation of the VHL-elongin BC tumor
suppressor complex is mediated by the chaperonin
TRiC. Mol Cell 4, 1051–1061.
12 Melville MW, McClellan AJ, Meyer AS, Darveau A &
Frydman J (2003) The Hsp70 and TRiC ⁄ CCT chaper-
one systems cooperate in vivo to assemble the von Hip-
pel–Lindau tumor suppressor complex. Mol Cell Biol
23, 3141–3151.
13 Bruick RK & McKnight SL (2001) A conserved family
of prolyl-4-hydroxylases that modify HIF. Science 294,
1337–1340.
14 Epstein AC, Gleadle JM, McNeill LA, Hewitson KS,
O’Rourke J, Mole DR, Mukherji M, Metzen E, Wilson
MI, Dhanda A et al. (2001) C. elegans EGL-9 and mam-
malian homologs define a family of dioxygenases that
regulate HIF by prolyl hydroxylation. Cell 107, 43–54.
15 Ivan M, Kondo K, Yang H, Kim W, Valiando J, Ohh
M, Salic A, Asara JM, Lane WS & Kaelin WG Jr
(2001) HIFa targeted for VHL-mediated destruction by
proline hydroxylation: implications for O
2
sensing. Sci-
ence 292, 464–468.
16 Jaakkola P, Mole DR, Tian YM, Wilson MI, Gielbert
J, Gaskell SJ, Kriegsheim AV, Hebestreit HF, Mukherji
M, Schofield CJ et al. (2001) Targeting of HIF-a to the
von Hippel–Lindau ubiquitylation complex by O
2
-regu-
lated prolyl hydroxylation. Science 292, 468–472.
17 Hirota K & Semenza GL (2005) Regulation of hypoxia-
inducible factor 1 by prolyl and asparaginyl hydroxylas-
es. Biochem Biophys Res Commun 338, 610–616.
18 Masson N & Ratcliffe PJ (2003) HIF prolyl and aspar-
aginyl hydroxylases in the biological response to intra-
cellular O(2) levels. J Cell Sci 116, 3041–3049.
19 Suhling K, French PM & Phillips D (2005) Time-
resolved fluorescence microscopy. Photochem Photobiol
Sci 4, 13–22.
20 Wallrabe H & Periasamy A (2005) Imaging protein mole-
cules using FRET and FLIM microscopy. Curr Opin
Biotechnol 16, 19–27.
21 Becker W, Bergmann A, Hink MA, Konig K, Benndorf
K & Biskup C (2004) Fluorescence lifetime imaging by
time-correlated single-photon counting. Microsc Res
Tech 63, 58–66.
22 Millington M, Grindlay GJ, Altenbach K, Neely RK,
Kolch W, Bencina M, Read ND, Jones AC, Dryden
DTF & Magennis SW (2007) High-precision FLIM-
FRET in fixed and living cells reveals heterogeneity in a
simple CFP-YFP fusion protein. Biophys Chem 127,
155–164.
23 Rizzo MA, Springer GH, Granada B & Piston DW
(2004) An improved cyan fluorescent protein variant
useful for FRET. Nat Biotechol 22, 445–449.
24 Bae JH, Rubini M, Jung G, Wiegand G, Seifert MH,
Azim MK, Kim JS, Zumbusch A, Holak TA, Moroder
L et al. (2003) Expansion of the genetic code enables
design of a novel ‘gold’ class of green fluorescent pro-
teins. J Mol Biol 328, 1071–1081.
25 Tramier M, Zahid M, Mevel JC, Masse MJ & Coppey-
Moisan M (2006) Sensitivity of CFP ⁄ YFP and
GFP ⁄ mCherry pairs to donor photobleaching on FRET
determination by fluorescence lifetime imaging micros-
copy in living cells. Microsc Res Tech 69, 933–939.
26 Stebbins CE, Kaelin WG Jr & Pavletich NP (1999)
Structure of the VHL-elongin C-elongin B complex:
implications for VHL tumor surppressor function.
Science 284, 455–461.
27 Schoenfeld AR, Davidowitz EJ & Burk RD (2000)
Elongin BC complex prevents degradation of von Hip-
pel–Lindau tumor suppressor gene products. Proc Natl
Acad Sci USA 97, 8507–8512.
28 Kamura T, Brower CS, Conaway RC & Conaway JW
(2002) A molecular basis for stabilization of the von
Hippel–Lindau (VHL) tumor suppressor protein by
components of the VHL ubiquitin ligase. J Biol Chem
277, 30388–30393.
29 Koth C, Botuyan MV, Moreland RJ, Jansma DB,
Conaway JW, Conaway RC, Chazin WJ, Friesen JD,
Arrowsmith CH & Edwards AM (2000) Elongin from
Saccharomyces cerevisiae. J Biol Chem 275, 11174–11180.
30 Sato F, Yasumoto K, Numayama-Tsuruta K & Sogawa
K (2005) Heterodimerization with LBP-1b is necessary
for nuclear localization of LBP-1a and LBP-1c. Genes
Cells 10, 861–870.
31 Kemnitz K, Pfeifer L, Paul R & Coppey-Moisan M
(1997) Novel detectors for fluorescence lifetime imaging
on the picoscecond time scale. J Fluoresc 7, 93–98.
32 Kemnitz K, Pfeifer L & Ainbund MR (1997) Detector
for multichannel spectroscopy and fluorescence lifetime
imaging on the picosecond timescale. Nucl Instr Meth
Phys Res A 387, 86–87.
33 Beechem JM (1989) A second generation global analysis
program for the recovery of complex inhomogeneous
fluorescence decay kinetics. Chem Phys Lipids 50, 237–
251.
K. Kinoshita et al. FRET imaging of the VBC complex
FEBS Journal 274 (2007) 5567–5575 ª 2007 The Authors Journal compilation ª 2007 FEBS 5575