Báo cáo khoa học: Effects of the G376E and G157D mutations on the stability of yeast enolase – a model for human muscle enolase deficiency pdf
Bạn đang xem bản rút gọn của tài liệu. Xem và tải ngay bản đầy đủ của tài liệu tại đây (307.56 KB, 10 trang )
Effects of the G376E and G157D mutations on the stability
of yeast enolase – a model for human muscle enolase
deficiency
Songping Zhao*, Bonny S. F. Choy* and Mary J. Kornblatt
Department of Chemistry and Biochemistry, Concordia University, Montreal, Canada
Enolase (EC 4.2.1.11), an essential enzyme of glyco-
lysis and gluconeogenesis, catalyses the intercon-
version of 2-phosphoglyceric acid (PGA) and
phosphoenolpyruvate. Enolases from most species are
dimeric, with subunit molecular masses of 40 000–
50 000 Da. Mammals have three genes for enolase,
coding for the a, b and c subunits; the subunits asso-
ciate to form both homo- and heterodimers. The
a gene is expressed in many tissues, c primarily in
neurones and b in muscle. In 2001, the first human
case of enolase deficiency was reported [1]. The
affected individual showed reduced levels of enolase
activity in the muscles. Western blot analysis showed
the presence of normal levels of aa-enolase, but no
detectable bb-enolase. This individual was heterozy-
gous for the gene for b-enolase, and carried two mis-
sense mutations, one inherited from each parent. His
muscle cells synthesized two forms of b-enolase, each
carrying a different mutation. These mutations chan-
ged glycine at position 374 to glutamate (G374E) and
glycine at position 156 to aspartate (G156D). In
order to study the effects of each of these mutations
on the structure and function of enolase, we have
made the corresponding changes, G376E and G157D,
in yeast (Saccharomyces cerevisiae) enolase. We chose
to work with yeast enolase, not bb-enolase, as yeast
enolase has been extensively studied, a number of crys-
tal structures are available [2,3] and the recombinant
Keywords
muscle enolase; mutations; proteolysis;
stability; subunit interactions
Correspondence
M. J. Kornblatt, Department of Chemistry
and Biochemistry, Concordia University,
7141 Sherbrooke Street, W., Montreal, QC,
Canada, H3G 1A7
Fax: +1 514 848 2868
Tel: +1 514 848 2424, ext 3384
E-mail:
*These authors contributed equally to this
work
(Received 12 September 2007, revised
1 November 2007, accepted 5 November
2007)
doi:10.1111/j.1742-4658.2007.06177.x
The first known human enolase deficiency was reported in 2001 [Comi GP,
Fortunato F, Lucchiari S, Bordoni A, Prelle A, Jann S, Keller A, Ciscato
P, Galbiati S, Chiveri L et al. (2001) Ann Neurol 50, 202–207]. The subject
had inherited two mutated genes for b-enolase. These mutations changed
glycine 156 to aspartate and glycine 374 to glutamate. In order to study
the effects of these changes on the structure and stability of enolase, we
have introduced the corresponding changes (G157D and G376E) into yeast
enolase. The two variants are correctly folded. They are less stable than
wild-type enolase with respect to thermal denaturation, and both have
increased K
d
values for subunit dissociation. At 37 °C, in the presence of
salt, both are partially dissociated and are extensively cleaved by trypsin.
Under the same conditions, wild-type enolase is fully dimeric and is only
slightly cleaved by trypsin. However, wild-type enolase is also extensively
cleaved if it is partially dissociated. The identification of the cleavage sites
and spectral studies of enolase have revealed some of the structural differ-
ences between the dimeric and monomeric forms of this enzyme.
Abbreviations
AUC, analytical ultracentrifugation; MES, 2-(N-morpholino)ethanesulfonic acid; PGA, 2-phosphoglyceric acid; PhAH,
phosphonoacetohydroxamate; Q-TOF, quadrupole time-of-flight; s
20,w
, sedimentation coefficient at 20 °C in pure water;
TLCK, N-a-tosyl-
L-lysine chloromethyl ketone.
FEBS Journal 275 (2008) 97–106 ª 2007 The Authors Journal compilation ª 2007 FEBS 97
yeast enolase can be overexpressed and purified in
quantity [4,5]. The basic three-dimensional structure
of the monomeric unit is the same in all enolases
crystallized to date [6–10]. Yeast and bb-enolase share
79% sequence similarity. All residues that have been
described as being involved in subunit interactions
(salt bridges and hydrogen bonds) [6], or contributing
to the active site, are conserved [2–5]. These two gly-
cines are conserved and are in highly conserved
regions of the protein: G376E is in a totally con-
served sequence of 25 amino acids, whereas G157D is
in a loop in which 11 of the 15 residues are con-
served. In view of the structural similarities between
yeast and mammalian enolases and the high degree of
sequence conservation, we believe that the effects of
these mutations on the structure and function of
yeast enolase will be similar to their effects on human
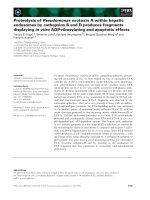
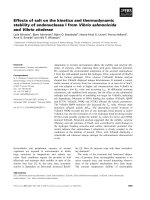
bb-enolase. Figure 1 shows the basic fold of yeast
enolase, including the location of the active site and
glycines 157 and 376.
Comi et al. [1] reported that the levels of mRNA
for b-enolase were normal, and suggested that the
lack of b-enolase protein in the muscle could be the
result of improper folding and assembly, which, in
turn, would lead to increased proteolysis of the pro-
tein. In this article, we focus on the structure and
stability of these variants relative to wild-type yeast
enolase. As the substitution of glutamate or aspartate
for glycine is nonconservative, we introduced alanine
at these two positions, with the aim of determining
whether any of the observed effects were a result of
changes in the size and charge of the amino acid at
these positions.
Results
Preliminary characterization
The G157D and G376E mutations were successfully
introduced into the gene for yeast enolase; sequencing
of the plasmids confirmed that the desired mutations
were present and that no other changes had been
introduced. The variant proteins were expressed in
Escherichia coli and purified. As a result of the low
activity of both variants under standard assay condi-
tions, SDS-PAGE was used to monitor the purifica-
tion. Typical yields of pure protein, from a 4 L
culture, were 350 mg for wild-type enolase, 80 mg for
G157D and 100 mg for G376E. All enolases were
highly pure, as judged by SDS-PAGE (not shown).
The specific activities of the variants, relative to wild-
type enolase, were 0.1% (G157D) and 0.01% (G376E).
MS confirmed that the desired mutations were present
(data not shown).
Secondary and tertiary structure
CD was used to examine the structure of these pro-
teins. In the peptide bond region, there were no signifi-
cant differences between wild-type enolase and the
variants, indicating that the variants were folded cor-
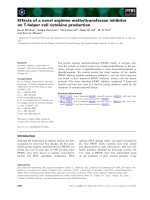
rectly. However, there were significant differences in
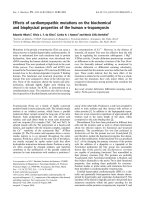
the aromatic region. The spectrum of the G157D vari-
ant was very similar to that of the wild-type protein
(Fig. 2A) in the region 280–300 nm; however, there
were differences in intensity below 280 nm. The CD
spectrum in the aromatic region of the G376E variant
was markedly different from that of the wild-type eno-
lase (Fig. 2A).
Quaternary structure and K
d
value for
dissociation
Analytical ultracentrifugation (AUC) was used to
examine the quaternary structure of the variants.
Wild-type enolase and the G157D variant had the
same sedimentation coefficient at 20 °C in pure water
(s
20,w
) at both 10.6 and 1.06 lm, indicating that they
were both dimeric at these concentrations (Table 1).
How can we determine the K
d
values for the wild-type
and G157D variant? Previous experiments have shown
that the incubation of yeast enolase in NaClO
4
results
in the dissociation of the protein into monomers, as
indicated by changes in s
20,w
(see below). There was no
loss of CD signal in the peptide bond region (210–
230 nm), indicating that the protein was not being
unfolded. However, there were large changes in the
Fig. 1. Yeast enolase (1one.pdb). The product, phosphoenolpyru-
vate, and glycines 157 and 376 are space-filled.
The G376E and G157D mutations in yeast enolase S. Zhao et al.
98 FEBS Journal 275 (2008) 97–106 ª 2007 The Authors Journal compilation ª 2007 FEBS
CD signal in the aromatic region (260–300 nm)
(Fig. 2B), as well as small changes in the UV spectrum
(data not shown) and a loss of activity. All of these
processes appeared to be complete by 0.3 m NaClO
4
.
The changes in the aromatic CD spectrum and in s
20,w
were used to calculate the K
d
value as a function of
NaClO
4
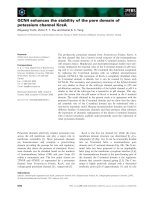
. For wild-type enolase, the K
d
value, extrapo-
lated to 0 m NaClO
4
(Fig. 3), was (1.5 ± 0.3) · 10
)8
.
The K
d
value for the G157D variant, determined in
a similar experiment, was increased by a factor of 10
relative to the wild-type (Table 1). Based on the AUC
data, the mutation at position 376 had a major effect
on the quaternary structure (Table 1). The s
20,w
value
for the G376E variant was measured at four protein
concentrations and the K
d
value for this variant was
calculated; K
d
was increased by a factor of 10
3
(Table 1).
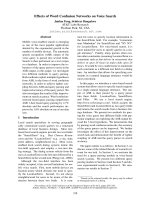
Thermal denaturation
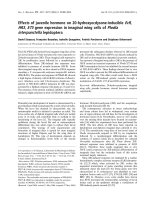
Temperature stability was studied by monitoring the
loss of the CD signal at 222 nm (Fig. 4). Both variants
were less stable than the wild-type by 4–5 °C (Table 1).
The wild-type and G157D variant were both stabilized
Fig. 2. CD spectra of wild-type yeast enolase and its variants in
the aromatic region. Spectra were normalized to 10 l
M protein. All
samples are in TME buffer. (A) Full line, wild-type; short broken
lines, G376E; long broken lines, G157D. (B) Full line, wild-type; long
broken lines, wild-type in 0.3
M NaClO
4
; short broken lines, W56F.
The W56F sample contained 0.5 m
M PhAH in order to ensure that
the protein was fully dimeric.
Table 1. K
d
and T
m
values of wild-type enolase and variants.
Enolase s
20,w
a
K
d
(M) T
m
(°C)
e
Wild-type 5.61 ± 0.023 (1.5 ± 0.3) · 10
)8b
55.4
G367E 4.51 ± 0.14 (1.4 ± 0.3) · 10
)5c
51.2
G157D 5.65 ± 0.02 (1.8 ± 0.4) · 10
)7d
49.9
a
Average and standard deviations of two (G376E), three (G157D)
or four (wild-type) determinations; the standard deviation for individ-
ual deviations was < 0.01.
b
From perchlorate dissociation experi-
ment using AUC and CD data (Fig. 4).
c
Determined from AUC data
at four protein concentrations.
d
From perchlorate dissociation
experiment using CD data.
e
Mid-point of curves shown in Fig. 4.
Fig. 3. K
d
value for dissociation of wild-type enolase by NaClO
4
.
Enolase was incubated in varying concentrations of NaClO
4
and
then analysed by CD and AUC, as described in Experimental proce-
dures. Open circles, K
d
based on the CD signal at 284 nm; filled cir-
cles, K
d
based on s
20,w
.
S. Zhao et al. The G376E and G157D mutations in yeast enolase
FEBS Journal 275 (2008) 97–106 ª 2007 The Authors Journal compilation ª 2007 FEBS 99
by the presence of 50 lm phosphonoacetohydroxamate
(PhAH), with T
m
increasing by 11.6 °C (wild-type) and
7.6 °C (G157D). PhAH, even at 0.5 mm, increased the
T
m
value for the G376E variant by only 1 °C.
Proteolytic digestion
The susceptibility of the two variants to limited prote-
olysis was examined under physiological conditions:
0.15 m KCl, 37 °C. Trypsin cleaved both variants;
under the same conditions, but little cleavage of the
wild-type occurred (Fig. 5). Further experiments were
performed at 15 °C, without the addition of KCl.
Under these conditions, at a trypsin ⁄ enolase ratio of
1 : 1000, cleavage of the G376E variant was complete
within 60 min at 15 °C, producing three fragments.
Under the same conditions, there was partial cleavage
at one site by chymotrypsin, but no cleavage by pep-
sin, endoproteinase Glu-c or elastase (data not shown).
The cleaved samples were analysed by quadrupole
time-of-flight (Q-TOF) MS and the cleavage sites were
identified (Table 2). At 15 °C, there was no cleavage of
the wild-type enolase or of G157D by either trypsin or
chymotrypsin.
Does enolase become susceptible to cleavage by
trypsin when it is partially dissociated? Table 3 sum-
marizes the results of several experiments performed to
determine whether there is a correlation between disso-
ciation and susceptibility to cleavage by trypsin. For
all three forms of enolase, cleavage by trypsin occurs
when there is measurable dissociation. Shifting the
equilibrium towards monomers (37 °C and KCl for
G157D, NaClO
4
for the wild-type) promotes cleavage.
Shifting the equilibrium towards dimers (G376E plus
0.5 mm PhAH) provides substantial protection against
proteolysis. MS confirmed that the fragments produced
Fig. 4. Thermal denaturation of wild-type enolase and its variants,
as monitored by the CD signal at 222 nm. Full line, G376E at
10.6 l
M; long broken lines, wild-type at 10.6 lM; short broken lines,
G157D at 5.3 l
M; broken lines–dots, wild-type at 5.3 lM.
Fig. 5. SDS-PAGE analysis of tryptic digests. Samples were incu-
bated at 37 °C in the presence (+) or absence of trypsin for
30 min; proteolysis was stopped by the addition of TLCK All sam-
ples contained 0.15
M KCl, except for lane 8, which contained
0.15
M NaClO
4
. Lane 1, molecular mass markers of 97, 66, 45, 31,
21 and 14 kDa. Lanes 2 and 3, G157D. Lanes 4 and 5, G376E.
Lanes 6, 7 and 8, wild-type.
Table 2. Masses of fragments formed by cleavage of the G376E
variant of yeast enolase. Following the proteolysis of enolase, the
fragments were analyzed by Q-TOF MS.
Enzyme Mass of fragment (Da) Cleavage site
Trypsin 5282, 11 515, 29 982 49–50, 329–330
Chymotrypsin 6098, 40 662 56–57
Table 3. Relationship between dissociation and cleavage by tryp-
sin. Enolase (wild-type and mutants) was incubated in the stated
conditions and then analysed by AUC or subjected to limited pro-
teolysis by trypsin.
Enzyme and conditions Dimeric (%)
a
Cleavage by
trypsin?
G376E, 15 °C, TME 70 Yes
G376E, 15 °C, TME, 0.5 m
M PhAH 96 Slight
G157D, 15 °C, TME 100 No
Wild-type, 15 °C, TME 100 No
Wild-type, 15 °C, TME, 0.3
M NaClO
4
0 Yes
G376E, 37 °C, TME, 0.15
M KCl 50 Yes
G157D, 37 °C, TME, 0.15
M KCl 88–90 Yes
Wild-type, 37 °C, TME, 0.15
M KCl 100 Very slight
a
Based on s
20,w
.
The G376E and G157D mutations in yeast enolase S. Zhao et al.
100 FEBS Journal 275 (2008) 97–106 ª 2007 The Authors Journal compilation ª 2007 FEBS
during the trypsin digest of wild-type monomers were
the same as those produced from the G376E variant.
Is monomeric enolase cleaved because it is partially
unfolded? Although the CD spectra of monomeric and
dimeric wild-type enolase appear to be identical in the
region 205–240 nm, differences become apparent when
spectra are recorded at lower wavelengths (Fig. 6).
These spectra were analysed using dichroweb [11,12],
with the variable selection method (cdsstr) [13].
According to this analysis, the percentage of unordered
structure in enolase increases from 17% in the dimeric
protein to 21% in the monomeric form. Three pairs of
monomeric and dimeric enolases, including enzyme
from two separate purifications, were examined. All
three showed a 4% increase in unordered structure on
dissociation.
Origin of the CD signal
A CD difference spectrum for the wild-type enzyme
(monomeric enolase – dimeric enolase) resembled the
spectrum of tryptophan, with a major peak at 284 nm
and shoulders at 274 and 291 nm. This spectrum sug-
gests that, on dissociation, there is a major change in
the environment of one or more tryptophans. The only
tryptophan near the interface is residue 56. This resi-
due was changed to phenylalanine. The aromatic CD
spectra of the dimeric forms of the wild-type enolase
and the W56F variant are shown in Fig. 2B. The
major change in the CD spectrum of the wild-type
enolase, which is seen on dissociation, is mimicked by
a loss of W56.
Discussion
The two mutations (G157D and G376E) were success-
fully introduced into yeast enolase. The resulting vari-
ant proteins had the correct secondary structure, based
on the CD spectra in the peptide bond region. Both
variants could bind Mg
2+
and substrate, as evidenced
by their enzymatic activity. They also bound PhAH, a
tight binding inhibitor [14], as evidenced by the effects
of this compound on thermal denaturation, proteolysis
and subunit dissociation. Both mutations clearly desta-
bilized the protein towards thermal denaturation and
decreased subunit affinity. The K
d
value for dissocia-
tion of the subunit was increased by approximately 10
3
for the G376E variant: at 1 mgÆmL
)1
and 15 °C, the
protein was partially dissociated. The K
d
value for the
G157D variant was also increased, but by a smaller
amount, such that the protein was dimeric under our
standard conditions of 1 mgÆmL
)1
and 15 °C. Physio-
logical conditions of ionic strength and temperature
promoted the dissociation of both variants. This is not
surprising, as it has been reported that both salt [15]
and increasing temperature [16,17] favour dissociation
of the wild-type enolase. Conditions which promoted
dissociation also promoted proteolysis by trypsin.
The initial observation that we are trying to under-
stand is the lack of any bb-enolase in the muscle of
the patient [1]. We recognize that yeast enolase is not
identical to bb-enolase and that the cytoplasm of
mammalian cells does not contain trypsin or chymo-
trypsin. However, the results with the G376E and
G157D variants of yeast enolase show that these muta-
tions destabilize the protein and result in partial disso-
ciation. If, in muscle cells, the monomer is recognized
as abnormal and is degraded, the proteolysis of the
monomer would continually shift the dimer–monomer
equilibrium towards monomer, until all the enolase
had been degraded. As the yeast enolase and its vari-
ants were expressed in E. coli at 37 °C, the significantly
lower yield of the variants may also be the result of
dissociation followed by proteolysis of the monomers.
The effects of these mutations on temperature stabil-
ity is not surprising. Brewer et al. [18,19] have pre-
pared a number of variants of yeast enolase and, in
many cases, the introduction of mutations has
decreased the temperature stability. Although a
Fig. 6. Peptide bond CD of the monomeric and dimeric forms of
wild-type yeast enolase. Enolase (10.6 l
M) was in the usual buffer,
except that Tris was titrated with H
2
SO
4
, not HCl; the monomeric
form of enolase was prepared by incubating the enzyme in buffer
plus 0.3
M NaClO
4
overnight at 15 °C. The spectra were recorded
at 15 °C using a 0.01 cm path length cuvette. Full line, dimeric eno-
lase; broken line, monomeric enolase.
S. Zhao et al. The G376E and G157D mutations in yeast enolase
FEBS Journal 275 (2008) 97–106 ª 2007 The Authors Journal compilation ª 2007 FEBS 101
number of variant forms of yeast enolase have been
produced by various groups, in almost no cases have
the effects on subunit interactions been examined.
Replacing glycine by glutamate or aspartate is a very
nonconservative change, although one that occurs in
nature as it requires only a single base change. Are the
effects that we have observed a result of a change in
the size or charge of the amino acid? Variants with
alanine at these positions were also studied. For tem-
perature denaturation, any change at these positions
was destabilizing. G376A and G376E had identical T
m
values. At position 157, alanine had a smaller effect
than aspartate, but even alanine decreased the T
m
value by 4 °C. There was no correlation between the
degree of dissociation and T
m
. Under the conditions
used for thermal denaturation, the G376E variant was
30% monomeric, whereas the G376A variant was
100% dimeric; however, their T
m
values were identical
and about 4 °C lower than that of the wild-type. A
different picture emerged when dissociation was stud-
ied, at least for G376E. In this case, alanine had little
or no effect on the K
d
value; G376A, at 1 mgÆmL
)1
,
had the same s
20,w
value as wild-type enolase and was
not cleaved by trypsin.
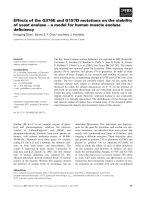
How do these changes in amino acids decrease sub-
unit interactions? Glycine 376 is in a small loop: resi-
dues 373–381. This loop includes glutamate 379, whose
side chain is hydrogen bonded to the side chain of
asparagine 410 in the other subunit, and glutamate 377
and threonine 378, both within 4.0 A
˚
of the other sub-
unit (Fig. 7). Glycine 376 is close to residues arginine
14, serine 403 and glutamate 404, all of which are
involved in subunit interactions. Introducing a large,
negatively charged amino acid at this position would
probably change the positions of some of these side
chains, thereby weakening interactions between the
subunits. Mutations at position 373 also increase the
subunit dissociation constant [19]. Glycine 157 does
not seem to be close to residues involved in subunit
interactions. However, it is also in a loop and the w ⁄ /
angles at position 157 are in a region of the Rama-
chandran plot that is allowed only for glycine. Substi-
tuting any amino acid at this position would result in
a change in the conformation of this loop. Changes in
the conformation of the backbone at this point and
changes in the orientation of other side chains, as a
result of the introduction of the large charged aspar-
tate residue, would undoubtedly have subtle effects on
other residues that are involved in subunit interactions.
During the course of this study, it was observed that
both variants showed reduced enzymatic activity rela-
tive to the wild-type enolase. This is not surprising,
considering the location of these changes. Glycine 157
is in one of the loops that moves on binding of sub-
strate and divalent cation. This loop contains histidine
159, which is essential for catalysis. Nearby residues
that contribute to the stabilization of one of the transi-
tion states include 152, 155 and 168 [20]. Glycine 376
is close to residues 373 and 374, which are also impor-
tant for the reaction [20].
How does dissociation into monomers promote pro-
teolysis? Studies on these variants have revealed some
interesting differences between the monomeric and
dimeric forms of enolase. Trypsin cleaves at arginine
49. This residue is in a long loop (residues 36–60),
most of which is on the surface of the protein. How-
ever, this residue points into the protein, is surrounded
by other amino acids and is not accessible to trypsin.
On dissociation, there must be significant changes in
the conformation of this loop, leading to the exposure
of arginine 49. The chymotrypsin cleavage site,
between residues 56 and 57, is also in this loop. Tryp-
tophan 56 is surrounded by residues from both mono-
mers, and the backbone amide at position 56 of one
subunit is hydrogen bonded to the side chain of gluta-
mate 188 of the other subunit. Therefore, it is not sur-
prising that it is not accessible in the dimer.
The identification of the 56–57 bond as a site that is
hidden in the dimer, but accessible to chymotrypsin in
the monomer, leads to the question of whether trypto-
phan 56 contributes to the large changes in aromatic
CD that are observed on dissociation. As shown in
Fig. 2B, the aromatic CD spectrum of the fully dimeric
W56F variant is very similar to that of monomeric
wild-type enolase. In the wild-type dimer, tryptophan
Fig. 7. The subunit interface of wild-type enolase (1ebh.pdb).
Those atoms of subunit B that are within 4.0 A
˚
of subunit A are
shown as a surface. Loop 373–381 of subunit A is shown as sticks
with Corey–Pauling–Koltun colouring; G376 is space-filled. Resi-
dues 14, 403 and 404 of subunit A are shown as yellow sticks.
The G376E and G157D mutations in yeast enolase S. Zhao et al.
102 FEBS Journal 275 (2008) 97–106 ª 2007 The Authors Journal compilation ª 2007 FEBS
56 is relatively immobile and has a strong, negative
CD signal. On dissociation, tryptophan 56 becomes
mobile, resulting in a loss of this negative signal. Yeast
enolase can also be dissociated by hydrostatic pressure
or by KCl plus EDTA. In both cases, dissociation is
accompanied by changes in intrinsic fluorescence of
the protein [15,21,22], which are probably caused by a
change in the environment of this residue.
Loop 36–60 includes a highly mobile region, residues
37–41, which folds over the active site on binding of
substrate and divalent cation. We have observed differ-
ences, at positions 56 and 49, between the dimeric and
monomeric forms of enolase. The loss of activity
observed in most studies [23–25] on dissociation of
enolase may be the result of changes in other regions
of this same loop. In a study of the pressure dissocia-
tion [26], we demonstrated that pressure dissociation
and inactivation of yeast enolase is a multistep process.
The first step, dissociation of the dimer into mono-
mers, is accompanied by small changes in the UV spec-
trum of the protein, changes which were attributed to
changes in the environment of several tyrosine resi-
dues. This is followed by conformational changes in
the monomer, which are reflected in further spectral
changes (both absorbance and fluorescence) and a loss
of activity. Based on our current data, we now propose
that the transition between the initial active monomers
formed by pressure and the subsequent inactive mono-
mers is a result of changes in the conformation of loop
36–60, changes similar to those observed in the current
experiments.
The other bond cleaved by trypsin is between resi-
dues 329 and 330. This bond is located in the last turn
of a small a-helix and far from the subunit interface.
We have no idea why it becomes susceptible to cleav-
age. We do not know whether the small increase in
disordered structure, observed in the CD spectrum,
affects this part of the protein, or whether there is
transient unfolding of the end of this helix. There are
examples of helices in proteins that undergo transient
unfolding, unfolding that is not apparent from the
crystal structure [27]. However, in neither case is it
obvious why this region of the enolase monomer
would be affected.
Comi et al. [1] suggested that the lack of bb-protein
in the subject’s muscle was a result of improper folding
and assembly of the dimer, leading to increased prote-
olysis. Our results indicate that the two variants are
correctly folded and form normal dimers. However,
because of the increased values of K
d
for subunit disso-
ciation, both variants are partially dissociated; it is the
presence of the monomeric form of enolase that leads
to the increased proteolysis.
Experimental procedures
Oligonucleotides were obtained from BioCorp Inc. (Mon-
treal, Canada), restriction enzymes from MBI Fermentas
(Burlington, Canada), CM-Sepharose and Q-Sepharose from
Amersham (Piscataway, NJ, USA) and phosphoenolpyru-
vate from Roche (Basel, Switzerland). PGA was prepared
enzymatically by either of two methods: (a) phosphoenol-
pyruvate was converted to PGA enzymatically, following
the procedure of Shen and Westhead [28] with minor modi-
fications [29]; or (b) PGA was synthesized enzymatically
from ATP and glyceric acid [30]. PhAH was synthesized
according to Anderson and Cleland [14]. The plasmid
containing the d-glycerate-2-kinase gene was a gift from
G. Reed (University of Wisconsin, Milwaukee, WI, USA).
A plasmid containing the gene for yeast enolase 1
(ENO1) was a gift from T. Nowak (University of Notre
Dame, Notre Dame, IN, USA). The enolase gene was
removed from this plasmid and inserted into pET-3a. XL1-
Blue E. coli was used for the storage of plasmids containing
the enolase genes (mutant or wild-type); BL21(DE3) E. coli
was used for the expression of the protein.
Mutagenesis was performed using the QuickChange
method (Stratagene, La Jolla, CA, USA). The primer
sequences were as follows: 5¢-GG GGT GTT ATG GTT
TCC CATCGA TCT GAA GAA A CT GAA GAC (G376E)
and 5¢-CCA TTC TTG AAC GTT TTA AAC GGT GAT
TCC CAC GCT GGT GG (G157D). Each sequence differs
from that of the wild-type in two ways (the bases changed
are indicated in italic type): (a) a glycine codon was changed
to either a glutamate or aspartate; and (b) silent mutations
were introduced that produced new restriction sites. These
sites, BglII for G376E and AhaIII for G157D, were used for
screening purposes following mutagenesis of the gene. Ala-
nine was introduced at these positions using the same strat-
egy. DNA sequencing was performed by BioS&T, Inc.
(Lachine, Canada).
The expression of enolase was performed as described
previously [4]. The cell paste was either used immediately
or stored at )20 °C. Cell paste from 4 L of cells was sus-
pended in 60 mL of TME buffer [50 mm Tris ⁄ HCl, pH 7.4,
1mm Mg(OAc)
2
and 0.1 mm EDTA] containing 1 mm
phosphonoacetic acid and about 3 mg each of DNase and
RNase. The suspension was sonicated, on ice, using six 30 s
bursts per 10 g of cell paste. The suspension was cooled on
ice for 30–60 s between bursts. The pH was adjusted to 7.4
using 1 m Tris base and the sonicated cell suspension was
centrifuged at 24 000 g for 30 min at 4 °C. The supernatant
was decanted and recentrifuged at the same speed for
another 30 min. All subsequent steps were performed on
ice or in a cold room. Enolase was precipitated between
40 and 85% (NH
4
)
2
SO
4
; the precipitated protein was dia-
lysed against TME buffer and applied to a column of
Q-Sepharose Fast Flow resin equilibrated in the same buffer.
Enolase binds very weakly to this resin under these
S. Zhao et al. The G376E and G157D mutations in yeast enolase
FEBS Journal 275 (2008) 97–106 ª 2007 The Authors Journal compilation ª 2007 FEBS 103
conditions and is slowly eluted with TME buffer. Based on
the specific activity, SDS-PAGE and the ratios of absor-
bance at 280 and 260 nm, the enolase was often highly pure
at this step. The protein was precipitated in 4.3 m
(NH
4
)
2
SO
4
and stored at 4 °C as the precipitate.
If further purification was necessary, the enzyme was pre-
cipitated as above, centrifuged to collect the protein and di-
alysed against 20 mm 2-(N-morpholino)ethanesulfonic acid
(MES), pH 6.0, containing 2 mm Mg(OAc)
2
and 0.2 mm
EDTA. It was then applied to a CM-Sepharose Fast Flow
column equilibrated in MES buffer. Enolase was eluted by
a gradient of 0–0.25 m KCl in the same buffer. The purified
enolase was precipitated and stored as described above.
Purification of the G157 variants was identical to that of
the wild-type enzyme, except that the initial (NH
4
)
2
SO
4
cut
was 60–95%. For the G376E mutant, the (NH
4
)
2
SO
4
cut was 50–85% and the order of the chromatography steps
was reversed. The enzyme was first applied to the CM-
Sepharose column and eluted with the KCl gradient. Fol-
lowing precipitation of the pooled fractions by 4.3 m
(NH
4
)
2
SO
4
and dialysis against TME buffer containing
0.1 m NaCl, the enzyme was applied to a small (about
2 mL bed volume) column of Q-Sepharose and eluted with
the same buffer. The purified enzyme was precipitated and
stored as described above.
During purification of the wild-type enolase, the enzyme
activity was monitored by following the conversion of
phosphoenolpyruvate to PGA at 244 nm. The buffer con-
tained 50 mm imidazole, pH 7.1, 250 mm KCl, 1 mm
Mg(OAc)
2
and 0.1 mm EDTA. The specific activities of the
purified enzymes were measured in the same buffer by fol-
lowing the conversion of PGA to phosphoenolpyruvate at
240 nm. During purification of the mutant enolases, the
chromatography steps were monitored by absorbance at
280 nm and by SDS-PAGE of column fractions. Protein
concentrations were measured at 280 nm; e = 8.46 ·
10
4
m
)1
cm
)1
[26].
Sedimentation velocity experiments were performed in a
Beckman (Fullerton, CA, USA) XL-I analytical ultracen-
trifuge at the Concordia University Centre for Structural
and Functional Genomics. Samples were prepared in
TME buffer, containing 0.3 m Na(OAc), unless stated
otherwise. Samples were centrifuged at 12 800 g at 15 °C,
unless stated otherwise, and monitored at either 280 or
230 nm, depending on the protein concentration. Data
were analysed using dcdt+, version 1.15 or 2.02 (J. Philo,
www.jphilo.mailway.com); the viscosity and density of this
buffer were determined by sednterp, version 1.07 (D. B.
Hayes, T. Laue and J. Philo, available at www.bbri.org/
RASMB/rasmb.html). In order to determine the sedimen-
tation coefficients of dimeric and monomeric enolase,
measurements were made over a range of protein concen-
trations. In the presence of 0.14 m Na(OAc), enolase is
fully dimeric; s
20,w
, over a range of 2.1–0.056 mgÆmL
)1
,
was constant, with an average value of 5.49 ± 0.16. Simi-
larly, in the presence of 0.3 m NaClO
4
and protein con-
centrations ranging from 1.22 to 0.122 mgÆmL
)1
, s
20,w
was
also constant, with an average value of 3.35 ± 0.13. For
enolases that were partially dissociated, the concentration
of dimeric enzyme was calculated from the total protein
concentration and the s
20,w
value [31]:
s
w
¼ðs
M
½Mþ2s
D
½DÞ=ð½Mþ2½DÞ ð1Þ
where s
W
, s
M
and s
D
are the s
20,w
values for the sample,
monomer and dimer, respectively. The concentrations of
dimeric and monomeric enzyme were then used to calculate
K
d
.
MS was performed on a Q-TOF instrument at the Con-
cordia University Centre for Biological Applications of
Mass Spectrometry. CD spectra were recorded on a Jasco
(Easton, MD, USA) J-810 spectropolarimeter, with a ther-
mostatically controlled sample compartment. When spectra
were being recorded, samples were scanned from 320 to
250 nm (aromatic region) or 260 to 200 nm (peptide bond
region) at 20 nmÆs
)1
, with a 1 nm bandwidth and a 1 s
response time. A minimum of four scans was averaged;
baseline subtraction and smoothing were performed using
jasco software. For temperature denaturation studies, the
sample was monitored at 222 nm. The temperature was
increased at a rate of 15 °C per hour. The CD signal was
used to calculate the fraction unfolded:
f
U
¼ðy
F
À yÞ=ðy
F
À y
U
Þð2Þ
where y
F
and y
U
are the CD signals at 222 nm for the ini-
tial and final forms of the protein, respectively [32] and y is
the signal of the sample. Samples for all CD experiments
were in TME buffer, unless otherwise stated. The protein
concentration was either 0.5 or 1.0 mgÆmL
)1
; in any given
experiment, mutant and wild-type enolases were at the same
concentration.
The K
d
value for subunit dissociation of wild-type and
G157D enolases was determined using NaClO
4
to dissociate
the enzyme. Samples were incubated in TME buffer con-
taining varying amounts of Na(OAc) and NaClO
4
, such
that the total salt concentration was 0.3 m. After incubation
at 15 °C for 24 h, the CD spectra in the aromatic region
were recorded with the sample compartment at 15 °C. The
spectrum of the enzyme in 0.3 m Na(OAc) was taken as
that of the fully dimeric enzyme. As the spectral changes
were complete by 0.3 m NaClO
4
, the spectrum of this sam-
ple was assumed to be that of fully monomeric enolase.
For each sample, the CD signal at 284 nm was used to
calculate the fraction dissociated. These data were used to
calculate K
d
:
K
d
¼ 4½enolaseðf
M
Þ
2
=ðf
D
Þð3Þ
where f
M
and f
D
are the fractions of monomeric and
dimeric enzyme, respectively. A plot of K
d
versus [NaClO
4
]
gives K
d
at 0 m NaClO
4
. The K
d
value for wild-type enolase
was also determined, using the same experimental design,
The G376E and G157D mutations in yeast enolase S. Zhao et al.
104 FEBS Journal 275 (2008) 97–106 ª 2007 The Authors Journal compilation ª 2007 FEBS
but measuring the s
20,w
value of each sample, in addition to
recording the CD spectrum. The data were then analysed
as described above.
Samples of enolase (1 mgÆmL
)1
) were incubated with
N-a-tosyl-l-lysine chloromethyl ketone (TLCK)-treated
trypsin (Sigma, St Louis, MO, USA) at a trypsin ⁄ enolase
ratio of 1 : 1000. At varying times, aliquots were removed,
an excess of TLCK (Roche) was added, followed by SDS-
PAGE sample buffer. Samples were then boiled for 2 min
and analysed by SDS-PAGE, using a 12% separating gel.
A similar protocol, without addition of an inhibitor, was
used with other proteolytic enzymes. Figs 1 and 7 were cre-
ated using pymol ().
Acknowledgements
We thank P. Ulycznyj (Concordia Centre for Struc-
tural and Functional Genomics) for running many of
the analytical ultracentrifugation samples, A. Padovani
for making the W56F variant and J. A. Kornblatt for
encouragement and advice. Financial support was
provided by the Natural Sciences and Engineering
Research Council of Canada.
References
1 Comi GP, Fortunato F, Lucchiari S, Bordoni A, Prelle
A, Jann S, Keller A, Ciscato P, Galbiati S, Chiveri L
et al. (2001) b-Enolase deficiency, a new metabolic
myopathy of distal glycolysis. Ann Neurol 50, 202–207.
2 Wedekind JE, Poyner RR, Reed GH & Rayment I
(1994) Chelation of serine 39 to Mg
2+
latches a gate at
the active site of enolase: structure of the bis(Mg
2+
)
complex of yeast enolase and the intermediate analog
phosphonoacetohydroxamate at 2.1-A
˚
resolution.
Biochemistry 33, 9333–9342.
3 Lebioda L & Stec B (1991) Mechanism of enolase: the
crystal structure of enolase-Mg
2+
-2-phosphoglycer-
ate ⁄ phosphoenolpyruvate complex at 2.2-A
˚
resolution.
Biochemistry 30, 2817–2822.
4 Poyner RR, Laughlin LT, Sowa GA & Reed GH
(1996) Toward identification of acid ⁄ base catalysts in
the active site of enolase: comparison of the properties
of K345A, E168Q, and E211Q variants. Biochemistry
35, 1692–1699.
5 Vinarov DA & Nowak T (1999) Role of His159 in yeast
enolase catalysis. Biochemistry 38, 12138–12149.
6 Stec B & Lebioda L (1990) Refined structure of yeast
apo-enolase at 2.25-A
˚
resolution. J Mol Biol 211,
235–248.
7 da Silva Giotto MT, Hannaert V, Vertommen D, de
AS Navarro MV, Rider MH, Michels PA, Garratt RC
& Rigden DJ (2003) The crystal structure of Trypano-
soma brucei enolase: visualisation of the inhibitory
metal binding site III and potential as target for selec-
tive, irreversible inhibition. J Mol Biol 331, 653–665.
8 Chai G, Brewer JM, Lovelace LL, Aoki T, Minor W &
Lebioda L (2004) Expression, purification and the 1.8 A
˚
resolution crystal structure of human neuron specific
enolase. J Mol Biol 341, 1015–1021.
9 Kuhnel K & Luisi BF (2001) Crystal structure of the
Escherichia coli RNA degradosome component enolase.
J Mol Biol 313, 583–592.
10 Duquerroy S, Camus C & Janin J (1995) X-ray struc-
ture and catalytic mechanism of lobster enolase.
Biochemistry 34, 12513–12523.
11 Lobley A, Whitmore L & Wallace BA (2002)
DICHROWEB: an interactive website for the analysis
of protein secondary structure from circular dichroism
spectra. Bioinformatics 18, 211–212.
12 Whitmore L & Walllace BA (2004) DICHROWEB, an
online server for protein secondary structure analyses
from circular dichroism spectroscopic data. Nucleic
Acids Res 32, W668–W673.
13 Manavalan P & Johnson WC (1987) Variable selection
method improves the prediction of protein secondary
structure from circular dichroism. Anal Biochem 167,
76–85.
14 Anderson VE & Cleland WW (1990) Phosphonate ana-
logue substrates for enolase. Biochemistry 29, 10498–
10503.
15 Brewer JM & Weber G (1968) The reversible dissocia-
tion of yeast enolase. Proc Natl Acad Sci USA 59, 216–
223.
16 Keresztes-Nagy S & Orman R (1971) Dissociation of
yeast enolase into active monomers. Biochemistry 10,
2506–2508.
17 Holleman WH (1973) The use of absorption optics to
measure dissociation of yeast enolase into enzymati-
cally active monomers. Biochim Biophys Acta 327,
176–185.
18 Brewer JM, Robson RL, Glover CV, Holland MJ &
Lebioda L (1993) Preparation and characterization of
the E168Q site-directed mutant of yeast enolase 1.
Proteins 17, 426–434.
19 Brewer JM, Glover CV, Holland MJ & Lebioda L
(1997) Effect of site-directed mutagenesis of His373 of
yeast enolase on some of its physical and enzymatic
properties. Biochim Biophys Acta 1340, 88–96.
20 Liu HY, Zhang YK & Yang WT (2000) How is the
active site of enolase organized to catalyze two different
reaction steps? Journal of the American Chemical
Society 122, 6560–6570.
21 Paladini AA & Weber G (1981) Pressure-induced
reversible dissociation of yeast enolase. Biochemistry 20,
2587–2593.
22 Brewer JM, Bastiaens P & Lee J (1987) Investigation of
conformational changes in yeast enolase using dynamic
S. Zhao et al. The G376E and G157D mutations in yeast enolase
FEBS Journal 275 (2008) 97–106 ª 2007 The Authors Journal compilation ª 2007 FEBS 105
fluorescence and steady-state quenching measurements.
Biochem Biophys Res Commun 147, 329–334.
23 Kornblatt MJ, Al-Ghanim A & Kornblatt JA (1996)
The effects of sodium perchlorate on rabbit muscle eno-
lase – spectral characterization of the monomer. Eur J
Biochem 236, 78–84.
24 Kornblatt MJ, Lange R & Balny C (1998) Can mono-
mers of yeast enolase have enzymatic activity? Eur J
Biochem 251, 775–780.
25 Brewer JM, Faini GJ, Wu CA, Goss LP, Carreira LA
& Wojcik R (1995) Characterization of the subunit dis-
sociation of yeast enolase. In Physical Aspects of Pro-
tein Interactions (Catsimpoolas N, ed.), pp. 57–78.
Elsevier, North-Holland, Amsterdam.
26 Kornblatt MJ, Lange R & Balny C (2004) Use of
hydrostatic pressure to produce ‘native’ monomers of
yeast enolase. Eur J Biochem 271, 3897–3904.
27 Horn JR, Kraybill B, Petro EJ, Coales SJ, Morrow JA,
Hamuro Y & Kossiakoff AA (2006) The role of protein
dynamics in increasing binding affinity for an engi-
neered protein–protein interaction established by H ⁄ D
exchange mass spectrometry. Biochemistry 45, 8488–
8498.
28 Shen TYS & Westhead EW (1973) Divalent cation and
pH-dependent primary isotope effects in the enolase
reaction. Biochemistry 12, 3333–3337.
29 Kornblatt MJ & Klugerman A (1989) Characterization
of the enolase isozymes of rabbit brain: kinetic differ-
ences between mammalian and yeast enolases. Biochem
Cell Biol 67, 103–107.
30 Sims PA & Reed GH (2005) Method for the enzymatic
synthesis of 2-phospho-D-glycerate from adenosine 5¢-
triphosphate and D-glycerate via D-glycerate-2-kinase.
J Mol Catal, B Enzym 32, 77–81.
31 Cole JL (1996) Characterization of human cytomegalo-
virus protease dimerization by analytical centrifugation.
Biochemistry 35, 15601–15610.
32 Pace CN & Scholtz JM (1997) Measuring the confor-
mational stability of a protein. In Protein Structure
(Creighton TE, ed.), pp 299–321. IRL Press, Oxford.
The G376E and G157D mutations in yeast enolase S. Zhao et al.
106 FEBS Journal 275 (2008) 97–106 ª 2007 The Authors Journal compilation ª 2007 FEBS