opentuition acca paper f5 december 2013
Bạn đang xem bản rút gọn của tài liệu. Xem và tải ngay bản đầy đủ của tài liệu tại đây (700.48 KB, 176 trang )
PERFORMANCE
MANAGEMENT
Paper
F5
OpenTuition Course Notes can be downloaded FREE
from www.OpenTuition.com
Copyright belongs to OpenTuition.com - please do not support piracy by
downloading from other websites.
Visit opentuition.com for the latest updates, watch free video lectures
and get free tutors’ support on the forums
ACCA QuAlifiCAtion
Course notes
December 2013 examinations
For the latest free course notes, free lectures and
forum support please visit opentuition.com/acca
The besT Things
in life are free
FREE ACCA RESOURCES BY PAPER
(free course notes / lectures / revision lectures / tests /
ashcards and more - on line on />F1 Accountant in Business / FAB Foundations in Accountancy
F2 Management Accounting / FMA Foundations in Accountancy
F3 Financial Accounting / FFA Foundations in Accountancy
F4 Corporate & Business Law (English & Global)
F5 Performance Management
F6 Taxation (UK)
F7 Financial Reporting
F8 Audit and Assurance
F9 Financial Management
P1 Governance, Risk & Ethics
P2 Corporate Reporting
P3 Business Analysis
P4 Advanced Financial Management
P5 Advanced Performance Management
P7 Advanced Audit & Assurance
To fully benefit from these notes
do not forget to watch free ACCA Lectures
on OpenTuition.com website
Paper F5
CONTENTS
Formulae i
1 Activity based costing 1
2 Target costing 5
3 Life-cycle costing 9
4 Environmental Management Accounting 13
5 roughput accounting 15
6 Limiting factors 19
7 Pricing 23
8 Cost Volume Prot Analysis 33
9 Short-term decision making 39
10 Risk and Uncertainty 45
11 Budgeting 51
12 Quantitative analysis in budgeting 59
13 Standard Costing and Basic Variance Analysis 69
14 More variance analysis 77
15 Financial Performance Measurement 87
16 Non-nancial performance measurement 91
17 Divisional performance measurement 93
18 Transfer Pricing 99
19 Performance in the not-for-prot sector 105
20 Performance Management Information Systems 107
21 Performance Management Systems, Measurement and Control 109
Answers to Examples 113
Practice Questions 139
Practice Answers 151
OpenTuition Course Notes can be downloaded FREE from www.OpenTuition.com
Copyright belongs to OpenTuition.com - please do not support piracy by downloading
from other websites.
Visit opentuition.com for the latest updates, watch free video lectures
and get free tutors’ support on the forums
December 2013 Examinations Paper F5
December 2013 Examinations Paper F5
FORMULAE
8
Formulae Sheet
Learning curve
Y = ax
b
Demand curve
Wh
ere
Y
= cumu
l
a
ti
ve average
ti
me per un
it t
o pro
d
uce x un
it
s
a = the time taken for the first unit of output
x = the cumulative number of units produced
b = the index of learning (log LR/log2)
LR = the learning rate as a decimal
P = a – bQ
b=
change in price
change in quantity
a=pricewhenQ=0
MR = a – 2bQ
End of Question Paper
December 2013 Examinations Paper F5
December 2013 Examinations Paper F5
FORMULAE
ii
Chapter 1
ACTIVITY BASED COSTING
1 Introduction
e traditional method of dealing with overheads is to split them between variable overheads
and xed overheads. If we are using absorption costing we then decide on a suitable basis for
absorption (e.g. labour hours) and absorb the overheads on that basis.
Activity Based Costing (ABC) attempts to absorb overheads in a more accurate (and therefore
more useful) way.
2 e steps to be followed are as follows:
• identify the major activities that give rise to overheads (e.g. machining; despatching of orders)
• determine what causes the cost of each activity – the cost driver (e.g. machine hours; number of
despatch orders)
• calculate the total cost for each activity – the cost pool (e.g. total machining costs; total costs of
despatch department)
• calculate an absorption rate for each cost driver
• calculate the total overhead cost for each product manufactured
• calculate the overhead cost per unit for each product
1
December 2013 Examinations Paper F5
Free lectures available for Paper F5 - click here
ExamplE 1
Una manufactures three products: A, B, and C.
Data for the period just ended is as follows:
A B C
Production (units) 20,000 25,000 2,000
Sales price ( per unit) $20 $20 $20
Material cost (per unit) $5 $10 $10
Labour hours (per unit) 2 hours 1 hour 1 hour
(Labour is paid at the rate of $5 per hour)
Overheads for the period were as follows:
Set-up costs 90,000
Receiving 30,000
Despatch 15,000
Machining
55,000
$190,000
Cost driver data:
A B C
Machine hours per unit 2 2 2
Number of set-ups 10 13 2
Number of deliveries received 10 10 2
Number of orders despatched 20 20 20
(a) Calculate the cost (and hence prot) per unit, absorbing all the overheads on the basis of labour
hours.
(b) Calculate the cost (and hence prot) per unit absorbing the overheads using an Activity Based
Costing approach.
December 2013 Examinations Paper F5
ACTIVITY BASED COSTING Chapter 1
2
3
December 2013 Examinations Paper F5
ACTIVITY BASED COSTING Chapter 1
3 Advantages of, and problems with, activity based costing.
December 2013 Examinations Paper F5
ACTIVITY BASED COSTING Chapter 1
4
Chapter 2
TARGET COSTING
1 Introduction
An important reason for calculating the cost of the product or service is in order to decide on
a selling price. ere is a chapter later in these notes that covers pricing decisions in detail, but
traditionally a very common approach to determining a selling price has been to take the cost and
then add on a prot percentage.
One problem with this approach is that it can clearly result in a price that is unacceptable to
customers and at the same time provides no direct incentive to cut costs.
Target costing is a more modern and more market driven approach.
2 Target costing
2.1 e steps involved are:
• From research of the market determine a selling price at which the company expects to achieve
the desired market share (the target selling price)
• Determine the prot required (e.g. a required prot margin, or a required return on investment)
• Calculate the maximum cost p.u. in order to achieve the required prot (the target cost)
• Compare the estimated actual costs with the target cost. If the actual cost is higher than the target
cost then look for ways of reducing costs. If no way can be found of meeting the target cost then
the product should not be produced.
Examp lE 1
Packard plc are considering whether or not to launch a new product. e sales department have determined
that a realistic selling price will be $20 per unit.
Packard have a requirement that all products generate a gross prot of 40% of selling price.
Calculate the target cost.
5
December 2013 Examinations Paper F5
Free lectures available for Paper F5 - click here
Examp lE 2
Hewlett plc is about to launch a new product on which it requires a pre-tax ROI of 30% p.a
Buildings and equipment needed for production will cost $5,000,000.
e expected sales are 40,000 units p.a. at a selling price of $67.50 p.u
Calculate the target cost.
December 2013 Examinations Paper F5
TARGET COSTING Chapter 2
6
3 e use of the target cost
Once the target cost has been determined, it will be compared with the estimated actual cost of
production. e excess of the actual cost over the target cost is known as the target cost gap, and
the company will then be looking for ways of closing this gap.
4 Possible ways of attempting to close the target cost gap
7
December 2013 Examinations Paper F5
TARGET COSTING Chapter 2
Spread the word about OpenTuition.com
so that all ACCA Students can benefit
from free ACCA resources
Print and share our poster
Free resources for ACCA students
100% Free
250,000 members can’t be wrong
Free course notes,
Free lectures
Free Tests and Flashcards
Free Forums with tutor support
StudyBuddy Finder
Chat and Study Groups
and much more
5 Target costing in service industries
It is much more dicult to use target costing in service industries due to the characteristics of
service businesses.
5.1 e ve major characteristics that distinguish services from manufacturing are:
Intangibility
Inseparability / Simultaneity
Variability / heterogeneity
Perishability
No transfer of ownership
December 2013 Examinations Paper F5
TARGET COSTING Chapter 2
8
Chapter 3
LIFECYCLE COSTING
1 Introduction
e costs involved in making a product, and the sales revenues generated, are likely to be dierent
at dierent stages in the life of a product. For example, during the initial development of the
product the costs are likely to be high and the revenue minimal – i.e. the product is likely to be
loss-making.
If costings (and decision based on the costings) were only to be ever done over the short term it
could easily lead to bad decisions.
Life-cycle costing identies the phases in the life-cycle and attempts to accumulate the costs over
the entire life of the product.
2 e product life cycle
2.1 e product life cycle may be divided into ve phases:
Development
Introduction
Growth
Maturity
Decline
9
December 2013 Examinations Paper F5
Free lectures available for Paper F5 - click here
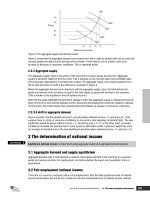
e eect of these can be illustrated diagrammatically as follows:
Development
Sales and
prots
Time
Prot
Sales revenue
DeclineMaturityGrowthIntroduction
2.2 Maximising the return over the product life cycle
Design costs out of products
Minimise the time to market
Minimise breakeven time
Maximise the length of the life span
December 2013 Examinations Paper F5
LIFECYCLE COSTING Chapter 3
10
Examp lE 1
A company is planning a new product. Market research suggests that demand for the product would last for
5 years. At a selling price of $10.50 per unit they expect to sell 2,000 units in the rst year and 12,000 units in
each of the other four years.
e company wishes to achieve a mark up of 50% on cost.
It is estimated that the lifetime costs of the product will be as follows:
1. Manufacturing costs - $6.00 per unit
2. Design and development costs - $60,000
3. End of life costs - $30,000
You are required to:
(a) Calculate the target cost for the product.
(b) Calculate the lifecycle cost per unit and determine whether or not the product is worth making.
It has been further estimated that if the company were to spend an additional $20,000 on design, then the
manufacturing costs per unit could be reduced.
(c) If the additional amount on design were to be spent, calculate the maximum manufacturing cost
per unit that could be allowed if the company is to achieve the required mark-up.
11
December 2013 Examinations Paper F5
LIFECYCLE COSTING Chapter 3
December 2013 Examinations Paper F5
LIFECYCLE COSTING Chapter 3
12
Chapter 4
ENVIRONMENTAL MANAGEMENT
ACCOUNTING
1 Introduction
Environmental management accounting (EMA) focuses on the ecient use of resources, and the
disposal of waste and euent.
In this chapter we will discuss the types of costs faced by businesses, and describe the dierent
methods a business may use to account for these costs.
2 e importance of considering environmental costs
If a company is wasteful in its use of resources, or alternatively causes pollution, then this impacts
in three ways:
(a) there is the direct cost to the company of spending more than is needed on resources, or
having to spend money cleaning up the pollution
(b) there is the damage to the reputation of the company – consumers are becoming more and
more environmentally aware
(c) there are possible nes or penalties as a result of breaking environmental regulations.
For all of the above reasons it is important for the company to attempt to identify and to manage
the various costs involved.
3 Typical environmental costs
e cost that comes to the mind of most people immediately are those relating to dealing with
waste. However there are many other costs that are likely to be just as important.
For example:
e amount of raw materials used in production. A publisher should consider ways of using
less paper (or recyclable paper) as a way of saving costs for themselves as well as helping the
environment.
Transport costs. Consideration of alternative ways of delivering goods could perhaps reduce costs
and reduce the impact on the environment.
Water and energy consumption. EMA may help to identify ineciencies and wasteful practices
and, therefore, opportunities for cost savings.
13
December 2013 Examinations Paper F5
Free lectures available for Paper F5 - click here
4 Dierent methods of accounting for environmental costs
Although you cannot be required to perform any calculations for this section of the syllabus, you
should be able to explain briey four methods that have been suggested as ways of accounting for
environmental costs.
(a) Inow / Outow analysis
is approach balances the quantity of resources that is input with the quantity that is output
either as production or as waste. Measuring these in physical quantities and in monetary
terms forces the business to focus on environmental costs.
(Resources includes not simply raw materials but also energy and water. i.e. all resources)
(b) Flow cost accounting
is is really inow/outow analysis (as described above) but instead of applying simply to
the business as a whole, it takes into account the organisational structure. Resources input
into the business are divided into three categories:
Material: the resources used in storing raw materials and in production
System: the resources used in (for example) storing production and quality control
Delivery and disposal: resources used in delivering to the customer and in disposing of any
waste.
As in (a), the aim is to reduce the quantities of resources used, which saves costs for the
company and leads to increased ecological eciency.
(c) Lifecycle costing
is has been discussed in an earlier chapter. e relevance to EMA is that it is important
to include environmentally driven costs such as the costs of disposal of waste. It may be
possible to design-out these costs before the product is launched.
(d) Environmental Activity Based Costing
Activity Based Costing has been discussed in an earlier chapter. Its application to
environmental costs is that those costs that are environment-related (e.g. costs related to a
sewage plant) are attributed to joint environmental cost centres.
As with ABC in general, this focusses more attention on these costs and potentially leads to
greater eciency and cost reduction.
December 2013 Examinations Paper F5
ENVIRONMENTAL MANAGEMENT ACCOUNTING Chapter 4
14
Chapter 5
THROUGHPUT ACCOUNTING
1 Introduction
You should previously have studied limited factor (or key factor) analysis. is deals with the
situation where several products are being made but where there are limited resources available.
In this chapter we will quickly revise limited factor analysis and then explain how this may be
adapted in a modern environment to perhaps a more meaningful approach known as throughput
accounting.
2 Key Factor Analysis
In a situation where we are manufacturing several products, all of which use the same limited
resource, then we need to decide on how best to use the limited resource in production.
e standard key factor approach is to rank the products on the basis of the contribution earned
per unit of the limited resources.
Examp lE 1
Pi plc manufactures 2 products, A and B.
e cost cards are as follows:
A B
Selling price
25 28
Materials 8 20
Labour 5 2
Other variable costs 7 2
Fixed costs
3 2
23 26
Prot $2 $2
Machine hours p.u. 2 hrs 1 hr
Maximum demand 20,000 units 10,000 units
e total hours available are 48,000.
Calculate the optimum production plan and the maximum prot using conventional key factor
analysis
15
December 2013 Examinations Paper F5
Free lectures available for Paper F5 - click here
3 roughput Accounting
e key factor approach described in the previous section is very sensible, and the throughput
approach is eectively the same. However, there are two main concepts of throughput accounting
which result in us amending the approach.
3.1 e main concepts of throughput accounting are:
• in the short run, all costs in the factory are likely to be xed with the exception of materials costs
• in a JIT environment then we should be attempting to eliminate inventories. Use of a limited
resource in production of inventories should be avoided and therefore any work-in-progress
should be valued at only the material cost
4 Denitions:
• roughput = sales revenue – material cost
• Total factory costs = all production costs except materials
•
Return per factory hour =
roughput
Time on key resource
•
Cost per factory hour =
Total factory cost
Total time available on key resource
•
roughput accounting ratio =
Return per factory hour
Cost per factory hour
4.1 Target for decision making:
e TA ratio should be greater than 1 if a product is to be viable. Priority should be given to those
products which generate the highest TA ratios.
December 2013 Examinations Paper F5
THROUGHPUT ACCOUNTING Chapter 5
16
Examp lE 2
Pi plc manufactures 2 products, A and B.
e cost cards are as follows:
A B
Selling price
25 28
Materials 8 20
Labour 5 2
Other variable costs 7 2
Fixed costs
3 2
23 26
Prot $2 $2
Machine hours p.u. 2 hrs 1 hr
Maximum demand 20,000 units 10,000 units
e total hours available are 48,000.
(a) Calculate the optimum production plan and the maximum prot, on the assumption that in the
short-term only material costs are variable i.e. using a throughput accounting approach
(b) Calculate the roughput Accounting ratios
17
December 2013 Examinations Paper F5
THROUGHPUT ACCOUNTING Chapter 5