Báo cáo khoa học: Isothermal unfolding studies on the apo and holo forms of Plasmodium falciparum acyl carrier protein Role of the 4¢-phosphopantetheine group in the stability of the holo form of Plasmodium falciparum acyl carrier protein docx
Bạn đang xem bản rút gọn của tài liệu. Xem và tải ngay bản đầy đủ của tài liệu tại đây (1015.64 KB, 14 trang )
Isothermal unfolding studies on the apo and holo forms
of Plasmodium falciparum acyl carrier protein
Role of the 4¢-phosphopantetheine group in the stability of the holo
form of Plasmodium falciparum acyl carrier protein
Rahul Modak
1
, Sharmistha Sinha
2
and Namita Surolia
1
1 Molecular Biology and Genetics Unit, Jawaharlal Nehru Centre for Advanced Scientific Research, Jakkur, Bangalore, India
2 Molecular Biophysics Unit, Indian Institute of Science, Bangalore, India
Malaria continues to exact the highest mortality and
morbidity rate after tuberculosis. ‘The scourge of the
tropics’, malaria is endemic in 100 countries in the
world. Approximately 500 million cases of malaria are
reported every year, and 3000 children die of malaria
every day [1]. Our recent demonstration of the occur-
rence of the type II fatty acid synthesis (FAS) pathway
in the malaria parasite, Plasmodium falciparum, and
its inhibition by triclosan, an inhibitor of the rate-
determining enzyme of type II FAS, enoyl-acyl carrier
protein (ACP) reductase, proved the pivotal role
played by this pathway in the survival of the malarial
parasite. The essential role of fatty acids and lipids in
cell growth and differentiation, and the occurrence of
a different type (type I) of fatty acid biosynthetic
pathway in the human host from that of the malaria
parasite, make this pathway an attractive target for
developing antimalarial agents [2,3].
Keywords
apo-ACP; conformational stability; holo-ACP;
isothermal unfolding; 4¢-phosphopantetheine
Correspondence
N. Surolia, Molecular Biology and Genetics
Unit, Jawaharlal Nehru Centre for Advanced
Scientific Research, Jakkur, Bangalore
560064, India
Fax: +91 80 22082766
Tel: +91 80 2208282021
E-mail:
(Received 29 January 2007, revised 15 April
2007, accepted 1 May 2007)
doi:10.1111/j.1742-4658.2007.05856.x
The unfolding pathways of the two forms of Plasmodium falciparum acyl
carrier protein, the apo and holo forms, were determined by guanidine
hydrochloride-induced denaturation. Both the apo form and the holo form
displayed a reversible two-state unfolding mechanism. The analysis of iso-
thermal denaturation data provides values for the conformational stability
of the two proteins. Although both forms have the same amino acid
sequence, and they have similar secondary structures, it was found that the
– DG of unfolding of the holo form was lower than that of the apo form at
all the temperatures at which the experiments were done. The higher stabil-
ity of the holo form can be attributed to the number of favorable contacts
that the 4¢-phosphopantetheine group makes with the surface residues by
virtue of a number of hydrogen bonds. Furthermore, there are several
hydrophobic interactions with 4¢-phosphopantetheine that firmly maintain
the structure of the holo form. We show here for the first time that the
interactions between 4¢-phosphopantetheine and the polypeptide backbone
of acyl carrier protein stabilize the protein. As Plasmodium acyl carrier pro-
tein has a similar secondary structure to the other acyl carrier proteins and
acyl carrier protein-like domains, the detailed biophysical characterization
of Plasmodium acyl carrier protein can serve as a prototype for the analysis
of the conformational stability of other acyl carrier proteins.
Abbreviations
AAS, acyl-ACP synthase; ACP, acyl carrier protein; AcpS, holo-ACP synthase; apo-ACP, Plasmodium falciparum acyl carrier protein (apo
form); FAS, fatty acid synthesis; holo-ACP, Plasmodium falciparum acyl carrier protein (holo form); holo-ACP, acyl carrier protein (holo form);
LEM, linear extrapolation model; 4¢-PP, 4¢-phosphopantetheine; PfACP, Plasmodium falciparum acyl carrier protein (both apo and halo
forms).
FEBS Journal 274 (2007) 3313–3326 ª 2007 The Authors Journal compilation ª 2007 FEBS 3313
The type II FAS pathway, found in most bacteria,
plants and the malaria parasite, consists of distinct
enzymes, each catalyzing individual reactions required
to complete successive cycles of fatty acid elongation,
in contrast to the multifunctional enzyme catalyzing all
the steps of the type I FAS pathway [4,5]. ACP is an
essential component of both type I and type II fatty
acid synthesis pathways. Whereas in the type I FAS
pathway, it is an integral part of the multifunctional
enzyme, it is a discrete entity shuttling acyl groups to
the successive enzymes in the type II FAS pathway.
ACP is a small protein of molecular mass 8–10 kDa.
It plays essential roles in a myriad of metabolic path-
ways. Assorted functions involve fatty acid and lipid
biosynthesis, lipid A formation, membrane-derived
oligosaccharide biosynthesis, and activation of RTX
(repeats in toxin), toxins of Gram-negative bacteria [6–
13]. In particular instances, specialized ACPs operate
in restricted pathways such as rhizobial nodulation
signaling, and polyketide and lipoteichoic acid synthe-
sis [11,12].
ACP plays a pivotal role in fatty acid synthesis as
well as in its utilization. It carries the growing acyl
chain from one enzyme of the FAS pathway to the
other in a sequential manner. Given its crucial roles in
metabolism, the high degree of conservation of ACP’s
primary structure is not surprising. The three-dimen-
sional structure of Escherichia coli ACP is the proto-
type of bacterial and plant ACP structures [14–17].
The solution structure of ACPs consists of a three-
helix bundle and a short fourth helix, all connected by
loops, with a long, structured turn between helices I
and II. ACP in its holo form exists in a dynamic equi-
librium between the two conformers [14–22].
ACP is synthesized as an apoprotein (apo-ACP)
and undergoes post-translational modification by
holo-ACP synthase. Holo-ACP synthase transfers the
4¢-phosphopantetheine (4¢-PP) group from CoA to a
particular serine residue of apo-ACP (Ser37 in
PfACP). The growing fatty acid chain is attached
to the terminal sulfhydryl group of the phospho-
pantetheine, the only sulfhydryl group in most ACPs.
All known ACPs (or ACP-like domains) undergo
this modification, and all share sequence similarities
around the modified serine [22].
PfACP is a protein of 137 residues, inclusive of
signal and transit sequences, required for targeting of
the protein to the apicoplast. The mature protein com-
prises 79 amino acids (residues 58–137) [23]. Recently,
the solution structure of P. falciparum holo-ACP
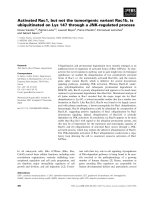
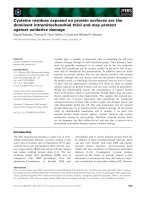
Fig. 1. (A) PfACP expression: SDS ⁄ PAGE (15%) showing the elution profile of PfACP with N-terminal His-tag. Lane 1: supernatant of isopro-
pyl-b-
D-thiogalactopyranoside-induced E. coli cultures transformed with pET-28a(+)-ACP. Lane 2: protein markers; the protein bands corres-
pond to 116 kDa, 66.2 kDa, 45 kDa, 35 kDa, 25 kDa, 18.4 kDa, and 14.4 kDa (from top to bottom). Lanes 3–7: different fractions of PfACP
eluted at 50 m
M imidazole. (B) PfACP expression: native PAGE (12%) showing the ratio of holo-ACP and apo-ACP in the eluted fractions
from an Ni–nitrilotriacetic acid agarose column. Lanes 1–3: different fractions of PfACP eluted at 50 m
M imidazole. (C) Size exclusion chro-
matography profile of PfACP: holo-ACP dimer has been separated from a mixture of apo-ACP and holo-ACP monomers by size exclusion
chromatography using a Superdex 75 column (30 cm) equilibrated and eluted with 20 m
M Tris (pH 6.5) and 200 mM NaCl. Peak 1: holo-ACP
dimer. Peak 2: mixture of apo-ACP and holo-ACP monomers. (D) Separation profile of holo-ACP dimer and apo-ACP and holo-ACP mono-
mers: 12% native PAGE showing the separation of holo-ACP dimer from a mixture of apo-ACP and holo-ACP monomers. Lane 1: holo-ACP
dimer without dithiothreitol. Lane 2: holo-ACP dimer with dithiothreitol. Lane 3: mixture of apo-ACP and holo-ACP monomers. (E) Removal
of His-tag from recombinant PfACP. For the cleavage of His-tag, 1 unit of thrombin was used for 1 mg of Pf ACP at 25 °C for 2 h. On 12%
native PAGE, ACPs with and without His-tag showed significant differences in mobility. Lane 1: holo-ACP with His-tag. Lane 2: holo-ACP
without His-tag. Lane 3: mixture of holo-ACP monomer and apo-ACP with His-tag. Lane 4: mixture of holo-ACP monomer and apo-ACP with-
out His-tag. (F) Separation of apo-ACP and holo-ACP by anion exchange chromatography. Elution profile of apo-ACP and holo-ACP on a
MonoQ HR 5 ⁄ 5 anion exchange column. Peak 1: apo-ACP. Peak 2: holo-ACP. (G) Separation of apo-ACP and holo-ACP; 12% native PAGE
showing the separation of apo-ACP and holo-ACP by anion exchange chromatography. Lane 1: mixture of apo-ACP and holo-ACP. Lane 2:
purified apo-ACP. Lane 3: purified holo-ACP. (H) Dynamic light-scattering data of PfACP. (a) Particle size distribution of apo-ACP. The solid
lines indicate the accumulation percentages of particles. (b) Particle size distribution of holo-ACP. The solid lines indicate the accumulation
percentages of particles. (I) Sucrose density gradient sedimentation analysis. Forty micrograms of apo-ACP and holo-ACP were layered on
top of a 4 mL continuous 0–10% (w ⁄ v) sucrose density gradient, and this was followed by centrifugation, fractionation and 12% native
PAGE, as described in Experimental procedures. Protein bands were visualized by silver staining. (a) Lane 1: apo-ACP. Lane 2: holo-ACP.
Lanes 3–9: fractions 18–12 of sucrose density gradient for apo-ACP. Lanes 10–15: fractions 18–13 of sucrose density gradient for holo-ACP.
(b) Lanes 1, 2 and 3, respectively, are fractions 16–18 of sucrose density gradient for holo-ACP under oxidizing conditions. (c) Apo-ACP (O)
and holo-ACP (h) in each fraction was quantified by measuring the intensity of the silver-stained protein bands using
QUANTITY ONE software
and plotted against the fraction number (AU, arbitrary unit). (d) The apparent molecular masses of apo-ACP and holo-ACP were estimated on
the basis of the linear regression of the fraction number of the molecular mass markers cytochrome c (CyC), carbonic anhydrase (CA), and
BSA. From the calibration curve of the sucrose density gradient, the estimated molecular masses of apo-ACP, holo-ACP monomer and holo-
ACP dimer are $ 16.75 kDa, 21 kDa and 26.5 kDa, respectively.
Plasmodium falciparum acyl carrier protein R. Modak et al.
3314 FEBS Journal 274 (2007) 3313–3326 ª 2007 The Authors Journal compilation ª 2007 FEBS
(holo-ACP) has been solved by Sharma et al. and it is
found to exist in conformational equilibrium between
the two states [24,25]. These two states have been iden-
tified as the major and the minor forms of the holo-
ACP structure, on the basis of their percentage contri-
butions (65% and 35%, respectively) to the overall
structure of the protein. The structures of the major
and minor conformations of holo-ACP bear close
resemblance to that of E. coli butyryl-ACP, with rmsd
values of 2.24 A
˚
and 2.19 A
˚
, when superimposed on
their backbone atoms.
In the present study, we report the detailed biophysi-
cal characterization of both apo-ACP and holo-ACP
to ascertain their conformational stabilities. An inter-
esting outcome of the study, reported for the first time,
for this large family of essential proteins, is that the
4¢-PP prosthetic group imparts considerably higher
conformational stability (– DG) to holo-ACP as com-
pared to its apo-ACP counterpart.
Results
Expression and purification of ACP
The mature PfACP (without the signal and transit
sequence) was expressed in E. coli BL21 (DE3) cells
with an N-terminal His-tag. PfACP was purified by
Ni–nitrilotriacetic acid agarose affinity chromatogra-
phy to homogeneity, as shown in Fig. 1A. The purified
protein on 15% SDS ⁄ PAGE gel has a monomeric
A
E
H-a
H-b
I-c I-d
I-a I-b
FG
B
Holo-ACP dimer
123
12 3
Holo-ACP dimer
1
2
Retention time (min)
Apo-ACP with his-tag
Apo-ACP
Holo-ACP with his-tag
Holo-ACP
1234
A
280
(mAU)
1
2
Retention time (min)
Apo-ACP
Apo-ACP
Holo-ACP
Holo-ACP
Apo-ACP
1
12
CyC
Apo
Holo
CA
BSA
2.01.81.61.41.21.0
18
16
14
12
10
8
Fraction no.
Fraction no.
Lo
g
(M.W.)
6
4
2
0
1800
1600
1400
1200
1000
800
600
400
200
0
10
Band intensity (A.U.)
12 14 16 18
34 567
1
14.4
18.4
25
35
45
66.2
116
23 45 6 7
8 9 10 11 12 13 14 15
123
23
Holo-ACP
CD
A
280
(mAU)
R. Modak et al. Plasmodium falciparum acyl carrier protein
FEBS Journal 274 (2007) 3313–3326 ª 2007 The Authors Journal compilation ª 2007 FEBS 3315
molecular mass of $ 9 kDa. The ratio of holo-ACP
and apo-ACP was determined to be in the range of
±50% by 12% native PAGE (Fig. 1B).
Heterologously expressed PfACP is partly converted
to holo-ACP by E. coli holo-ACP synthase. Holo-ACP
forms a disulfide-bonded dimer through the thiol
group of phosphopantetheine in a nonreducing envi-
ronment. The holo-ACP dimer was separated from the
mixture of apo-ACP and holo-ACP monomers by size
exclusion chromatography under nonreducing condi-
tions (Fig. 1C,D). From the calibration curve for the
Superdex 75 column, with standard globular proteins,
the apparent molecular mass of holo-ACP dimer and
the mixture of holo-ACP monomer and apo-ACP were
found to be 33 kDa and 25 kDa, respectively.
Purified holo-ACP and the mixture of apo-ACP and
holo-ACP monomer were subjected to thrombin clea-
vage to remove the histidine tag from the protein.
Approximately 90% ACP cleavage was achieved, and
uncleaved ACP was removed by passage through an
Ni–nitrilotriacetic acid affinity column (Fig. 1E). Apo-
ACP and holo-ACP monomers from the mixture were
purified by anion exchange chromatography using a
Mono Q HR 5 ⁄ 5 column (Fig. 1F,G). The elution pro-
file (Fig. 1F) shows that apo-ACP has weaker affinity
and eluted with 190 mm NaCl, whereas holo-ACP
was eluted with 200 mm NaCl. MALDI-TOF MS
yielded molecular masses of 9418.845 Da (calculated
9417.65 Da) and 9752.831 Da (calculated 9751.65 Da)
for apo-ACP and holo-ACP, respectively [Figs 2Aa,b].
Dynamic light-scattering studies of PfACP
Apo-ACP and holo-ACP yielded hydrodynamic radii
of 1.95 ± 0.05 nm and 1.9 ± 0.1 nm, respectively,
confirming that they have a single species over the
entire experimental concentration range [Fig. 1Ha,b].
Sucrose density gradient sedimentation
In sucrose density gradient sedimentation experiments,
both apo-ACP and holo-ACP were detected between
fractions 12 and 18 [Fig. 1Ia–d]; apo-ACP showed a
major peak in fraction 15, whereas holo-ACP showed
a peak in fraction 14 [Fig. 1Ia–d]. From the calibration
curve of the sucrose density gradient, the estimated
molecular masses of apo-ACP and holo-ACP mono-
mers are $ 16.75 kDa and 21 kDa, respectively. The
dimeric peak of holo-ACP was found in major
amounts in fraction 17 when sucrose density gradient
sedimentation for holo-ACP under oxidizing condi-
tions was performed.
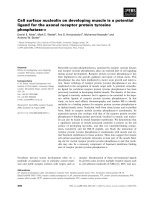
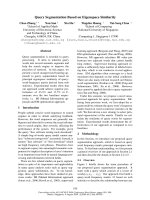
Fig. 2. (A). Molecular mass determination of apo-ACP and holo-ACP. Molecular masses of apo-ACP and holo-ACP were determined with an
Ultra Flex TOF ⁄ MALDI-TOF mass spectrometer. (a) Mass spectrum of holo-ACP single major peak (9752.83 Da) [holo-ACP (calculated
9751.65 Da)]. (b) Mass spectrum of apo-ACP, showing a single major peak of molecular mass 9418.84 Da [apo-ACP (calculated
9417.65 Da)]. (B) Secondary structure of ACP. The secondary structures of both apo-ACP (O) and holo-ACP (h) were determined by far-UV
CD spectroscopy. CD spectra show the presence of only a-helices as the secondary structure element in both apo-ACP and holo-ACP. (C)
Guanidine hydrochloride-induced transitions for holo-ACP (.) and apo-ACP (O)at30°C as monitored by CD at 222 nm. The proteins were in
buffer containing 5 m
M NaCl ⁄ P
i
, 100 mM NaCl and 2 mM dithiothreitol, plus the indicated concentration of guanidine hydrochloride. The solid
lines indicate the best-fit values for each curve. (D) Refolding of ACP. Far-UV CD spectra of native apo-ACP (d) and holo-ACP (.), and refold-
ed apo-ACP (O) and holo-ACP (,). The CD spectra of native and refolded PfACP overlap, which shows that isothermal denaturation of PfACP
is completely reversible. (E) Fluorescence spectra of ACP at 25 °C. The samples were excited at 280 nm, and emission spectra were recor-
ded from 295 nm to 350 nm. No change of emission maxima from 305 nm was observed for denatured holo-ACP (,) and apo-ACP (d), and
native holo-ACP (.) and apo-ACP (O). For both forms, the only change in fluorescence intensity was observed upon denaturation. (F) Refold-
ing of ACP. Both apo-ACP and holo-ACP denatured in 6
M guanidine hydrochloride were refolded by dialysis (4 · 1000 mL) against 5 mM
Na ⁄ K phosphate (pH 6.5), 100 mM NaCl and 2 mM dithiothreitol. Both apo-ACP and holo-ACP are completely refolded after complete dena-
turation with 6
M guanidine hydrochloride, as revealed by the equal mobilities of the native and refolded proteins on 12% native PAGE.
Lane 1: native apo-ACP. Lane 2: refolded apo-ACP. Lane 3: native holo-ACP. Lane 4: refolded holo-ACP. There is no degradation of holo-ACP
to apo-ACP during the refolding process. (G) AcpS assay. Both native and refolded apo-ACPs were used as substrates for the AcpS assay,
to convert them to lauroyl-ACP. The reaction mixtures are checked on 12% native PAGE. Lane 1: refolded apo-ACP. Lane 2: refolded
holo-ACP. Lane 3: reaction mixture with native apo-ACP. Lane 4: reaction mixture with refolded apo-ACP. (H) AAS assay. Both native and
refolded holo-ACPs were used as substrates for AcpS assay, to convert them to lauroyl-ACP. The reaction mixtures were checked on 20%
conformation-sensitive PAGE with 5
M urea. Lane 1: refolded holo-ACP. Lane 2: reaction mixture with refolded holo-ACP. Lane 3: reaction
mixture with native holo-ACP. (I) Confirmation of AcpS reaction product. The molecular masses of apo-ACP and holo-ACP were determined
with an Ultra Flex TOF ⁄ MALDI-TOF mass spectrometer. (a) Mass spectrum of refolded apo-ACP, showing a single major peak of molecular
mass 9420.639 Da [apo-ACP (calculated 9417.65 Da)]. (b) Mass spectrum of reaction mixture with native apo-ACP, showing a single major
peak of molecular mass 9943.976 (Da) [lauroyl-ACP (calculated 9935 Da)]. (c) Mass spectrum of reaction mixture with refolded apo-PfACP,
showing a single major peak of molecular mass 9941.941 (Da) [lauroyl-ACP (calculated 9935 Da)]. (d) Mass spectrum of refolded holo-ACP,
showing a single major peak (9759.106 Da) [holo-ACP (calculated 9751.65 Da)].
Plasmodium falciparum acyl carrier protein R. Modak et al.
3316 FEBS Journal 274 (2007) 3313–3326 ª 2007 The Authors Journal compilation ª 2007 FEBS
B
C
E
HI
FG
D
190
–1.8e+6
–2.5e+6
200
0
0
1
fraction native
[GdnHCI] M
165432
210
220 230
Wavelength (nm)
Wavelength (nm)
Molar ellipticity
240 250
–2.0e+6
–1.5e+6
–1.0e+6
–5.0e+5
0.0
5.0e+5
290
300
310
320
Wavelength (nm)
Fluorescence
330 340 350 360
1
holoACP
C12-ACP
23
123
41234
a
b
c
9941.941
9943.938
9920.639
9758.108
d
1.0e+6
1.5e+6
2.0e+6
2.5e+6
3.0e+6
3.5e+6
4.0e+6
4.5e+6
–1.6e+6
–1.4e+6
–1.2e+6
–1.0e+6
–8.0e+5
–6.0e+5
–4.0e+5
–2.0e+5
0.0
2.0e+5
4.0e+5
Molar ellipticity
a
b
200 210
220
230 240 250 260
A
R. Modak et al. Plasmodium falciparum acyl carrier protein
FEBS Journal 274 (2007) 3313–3326 ª 2007 The Authors Journal compilation ª 2007 FEBS 3317
Biophysical studies with ACP
The conformations of both apo-ACP and holo-ACP at
pH 6.5 have been determined by far-UV CD spectros-
copy. Wavelength scans from 190 nm to 250 nm show
that both forms of ACP have predominantly a-helices,
which is in accordance with known ACP structures
(Fig. 2B) [24].
The conformational stability of holo-ACP and apo-
ACP was determined by chaotrope-dependent unfold-
ing at different temperatures. The reversibility of the
isothermal denaturation of ACP was shown by the
return of CD and fluorescence signals upon refold-
ing after complete denaturation with 6 m guanidine
hydrochloride (Fig. 2D,E). It was also found that the
refolded apo-ACP and holo-ACP have mobilities com-
parable to that of the nondenatured wild-type counter-
parts on 12% native PAGE, which further confirms
the reversibility of the transition (Fig. 2F). Unfolding
experiments monitored by the change in mean residue
ellipticity at 222 nm [h]
222
demonstrated that both
forms undergo a two-state unfolding transition.
(Fig. 2C). Unfolding transitions were also monitored
by following the tyrosine fluorescence at 305 nm upon
excitation at 280 nm. This was done because PfACP is
devoid of tryptophan but contains one tyrosine resi-
due. Fluorescence emission spectra of fully denatured
PfACPs showed no shift in their emission maxima
from 305 nm, but there was a substantial increase in
fluorescence intensity (Fig. 2E). The isothermal dena-
turation probed both by the far-UV CD and fluores-
cence coincided well for both apo-ACP and holo-ACP,
indicating that their denaturation process is a two-state
reaction (Fig. 3A,B).
Several representative guanidine hydrochloride-depe-
ndent denaturation experiments were done in the range
15°) 60 °C. The results of the analysis of these curves
using the linear extrapolation model (LEM) are shown
in Tables 1 and 2 and Fig. 4A–C. There is a slight
temperature dependence of the C
m
value (Fig. 4A),
but the m value is independent of temperature, as
per the expectations of LEM (Fig. 4C). The mean
m values for the apo form and the holo form
are ) 1.64 kcalÆmol
)1
Æm
)1
and ) 1.97 kcalÆmol
)1
Æm
)1
,
respectively. The DG
water
values showed strong tem-
perature dependence, with maximum stability at 30 °C
(Fig. 4B).
Unfolding experiments were also monitored by the
change in fluorescence anisotropy of the single tyrosine
residue at the C-terminus of ACP. The isothermal
denaturation probed by fluorescence anisotropy corre-
lated well with the far-UV CD and fluorescence
quenching studies for both apo-ACP and holo-ACP,
further indicating that their denaturation process is
a two-state reaction (Fig. 3C). These data further
indicate that apo-ACP has lower stability than holo-
ACP.
Acyl-ACP synthesis assay with apo-ACP
E. coli holo-ACP synthase (AcpS) has been cloned and
expressed in the laboratory as a His-tagged protein.
AB
C
Fluorescence (Fit)
1.0
0.8
0.6
0.4
Fraction native
Fraction native
Fraction native
0.2
0.0
1.0
0.8
0.6
0.4
0.2
0.0
0
1
GdnCI concentration [M]
234567
0
1
GdnCI concentration [M]
234567
0
0
1
1
[GdnHCI] M
234567
Fluorescence (Fit)
Fluorescence (Expt)
Fluorescence (Expt)
Far UV-CD (Fit)
Far UV-CD (Fit)
Far UV-CD (Expt)
Far UV-CD (Expt)
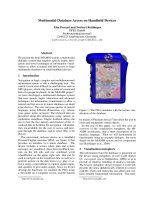
Fig. 3. Comparison of guanidine hydrochlo-
ride-induced transitions (A) Comparison of
guanidine hydrochloride-induced transitions
of apo-ACP at 30 °C as monitored by far-UV
CD at 222 nm (d) and tyrosine fluorescence
at 305 nm (O). (B) Comparison of guanidine
hydrochloride-induced transitions of
holo-ACP at 30 °C monitored by CD at
222 nm (m) and tyrosine fluorescence at
305 nm (n). (C) Comparison of guanidine
hydrochloride-induced transitions of
apo-ACP (O) and holo-ACP (d)at30°C
monitored by fluorescence anisotropy of
tyrosine fluorescence at 305 nm.
Plasmodium falciparum acyl carrier protein R. Modak et al.
3318 FEBS Journal 274 (2007) 3313–3326 ª 2007 The Authors Journal compilation ª 2007 FEBS
E. coli AcpS thus expressed has broad substrate specif-
icity. It utilizes apo-ACP and various acyl-CoAs as
substrates to give corresponding acyl-ACPs. This prop-
erty of AcpS was utilized to check the extent of the
reversibility of folding of apo-ACP. An acyl-ACP
synthesis assay clearly showed that both native and
refolded apo-ACP are equally and quantitatively con-
verted to lauroyl-ACP (Fig. 2G,I).
Acyl-ACP synthesis assay with holo-ACP
E. coli acyl-ACP synthase (AAS) utilizes holo-ACP as
a substrate and converts it to acyl-ACP. E. coli AAS
also utilizes fatty acids with various chain lengths as
substrates, producing the corresponding acyl-ACPs.
This property of AAS was utilized to check the correct
refolding of holo-ACP. An acyl-ACP synthesis assay
clearly showed that both native and refolded holo-
ACP are partially converted to lauroyl-ACP (Fig. 2H).
The band intensity indicates that the extent of conver-
sion of refolded holo-ACP is comparable to that of its
native counterpart.
Table 1. Parameters obtained from the fit of isothermal unfolding data by fitting Eqs (1)–(5). ND, not determined.
Temperature (K)
C
m
holo-ACP
(
M)
C
m
apo-ACP
(
M)
m-value
holo-ACP
(kcalÆmol
)1
ÆM
)1
)
m-value
apo-ACP
(kcalÆmol
)1
ÆM
)1
)
DG
water
holo-ACP
(kcalÆmol
)1
)
DG
water
apo-ACP
(kcalÆmol
)1
)
283 3.95 ± 0.07 3.56 ± 0.06 ) 1.55 ± 0.18 ) 1.31 ± 0.25 2.60 2.19
288 3.91 ± 0.14 3.48 ± 0.07 ) 2.12 ± 0.07 ) 1.90 ± 0.37 3.09 2.51
293 3.88 ± 0.04 3.46 ± 0.09 ) 3.12 ± 0.55 ) 1.92 ± 0.43 3.17 2.89
298 3.83 ± 0.04 3.37 ± 0.06 ) 2.37 ± 0.31 ) 1.40 ± 0.14 3.12 2.78
303 3.92 ± 0.06 3.59 ± 0.05 ) 1.67 ± 0.17 ) 1.42 ± 0.37 3.57 2.99
313 3.62 ± 0.14 3.35 ± 0.12 ) 1.95 ± 0.62 ) 1.51 ± 0.37 2.71 2.38
318 3.68 ± 0.07 3.49 ± 0.05 ) 1.75 ± 0.78 ) 1.43 ± 0.08 2.28 1.99
323 3.74 ± 0.17 ND ) 1.87 ± 0.65 ND 2.04 ND
328 3.61 ± 0.04 3.31 ± 0.09 ) 1.97 ± 0.65 ) 2.17 ± 0.37 1.86 1.08
333 3.58 ± 0.07 3.27 ± 0.05 ) 1.67 ± 0.21 ) 1.70 ± 0.37 1.01 0.74
Table 2. Average C
m
and m for apo-ACP and holo-ACP in the
experimental temperature range.
Protein
Average C
m
(M)
Average m
(kcalÆmol
)1
ÆM
)1
)
Apo-ACP 3.43 ± 0.04 ) 1.64 ± 0.12
Holo-ACP 3.77 ± 0.05 ) 1.97 ± 0.09
AB
C
280
3
4
GdnCI concentration [M]
ΔG (kcal/mol)
m [cal mol
–1
M
–1
]
290
300
Temperature [K]
310
320
330
340
260
0
1
2
3
280
300
Temperature [K]
320
340
280
0
–1
–2
–3
–4
290
300
Temperature [K]
310
320
330
340
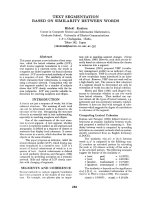
Fig. 4. Effects of temperature on the best-
fit C
m
(A), m value (B) and DG
water
(C) for
the guanidine hydrochloride denaturation
curves at 10 different temperatures for holo-
PfACP (d) and apo-PfACP (O). The solid line
indicates the best-fit values of C
m
(A) and
DG
water
.
R. Modak et al. Plasmodium falciparum acyl carrier protein
FEBS Journal 274 (2007) 3313–3326 ª 2007 The Authors Journal compilation ª 2007 FEBS 3319
Discussion
Overexpression of several ACPs including E. coli ACP,
has been reported to be toxic for E. coli. The active
forms of ACP, the holo-ACPs, are even more difficult
to overexpress in E. coli, presumably due to ineffi-
ciency of the E. coli holo-ACP synthase in modifying
the ACP in vivo, resulting in the production of mostly
apo-ACP, which has been shown to have inhibitory
effects on E. coli growth [26]. In our previous studies
[24,27] and also in this study, we have standardized
conditions for overexpression of PfACP in E. coli with
high yield (30–35 mgÆ L
)1
E. coli culture). PfACP
appears to be converted to holo-ACP by E. coli holo-
ACP synthase. These studies also show that PfACP is
utilized as a substrate by E. coli holo-ACP synthase
and ACP phosphodiesterase. Although optimization of
culture conditions yields mostly holo-ACP [27], we
show that both holo-ACP and apo-ACP can be over-
expressed together and purified to homogeneity.
The secondary structures of apo-ACP and holo-
ACP, as determined by far-UV CD spectroscopy, have
shown the predominance of a-helices and a very low
percentage of b-pleated sheet in PfACP. Analysis of
CD spectra using k2d analysis software (http://www.
embl-heidelberg.de/$andrade/k2d.html) has shown
that both apo-ACP and holo-ACP contain 56%
a-helix, 10% b-pleated sheet and 34% random coil in
their secondary structure, demonstrating that PfACP
has a similar secondary structure to the other ACPs
and ACP-like domains [14–22]. Hence, detailed bio-
physical characterization of PfACP could serve as a
prototype for determining the conformational stability
of other ACPs. The NMR structure of PfACP has
been solved recently [24,25,27]; this study augments the
structural data and elucidates the interactions respon-
sible for the conformational stability of PfACP.
The size exclusion chromatography profile of PfACP
showed that the apparent molecular mass of PfACP
monomer is 25 kDa, whereas the actual molecular
masses of apo-ACP and holo-ACP are 9.4 kDa and
9.7 kDa, respectively, as is evident from MS studies.
The dynamic light-scattering experiments showed
both apo-ACP and holo-ACP exist as single species
[Fig. 1Ha,b]. The sucrose density gradient sedimenta-
tion showed that the apparent molecular masses of
apo-ACP and holo-ACP are 16.75 kDa and 21 kDa,
respectively. The glutaraldehyde crosslinking experi-
ment (Supplementary material) showed that both apo-
ACP and holo-ACP exist as monomers in solution
under reducing conditions, and that holo-ACP parti-
ally forms a dimer by forming a disulfide bridge invol-
ving the SH group of its pantothenyl moiety under
nonreducing conditions only. Therefore, the increased
apparent molecular masses of monomeric apo-ACP
and holo-ACP are not due to oligomerization but are
perhaps due to their relatively higher hydrodynamic
radii.
The chaotrope-induced unfolding was almost fully
reversible in both forms of the protein. Removal of the
perturbation makes the protein regain its native form.
The unfolding reactions of both forms are simple two-
state processes, A
´
U. The transitions monitored by
the two probes (far-UV CD and tyrosine fluorescence
at 305 nm) that report the secondary and tertiary
structures of the protein were completely superimposa-
ble, thus proving it to be a two-state process [38]. Both
native and refolded PfACP have comparable mobilities
on 12% native PAGE, and both of them are equally
utilized as substrates by E. coli AcpS and AAS, which
further shows the complete refolding of PfACP. The
fact that it is a small protein with a few hydrophobic
residues perhaps explainsd a lack of nonspecific aggre-
gation and the ease with which it can be reversibly
unfolded by the chaotrope guanidine hydrochloride.
Detailed analyses of the stability curves obtained
by chemical denaturation are consistent with the
LEM. The chaotrope-induced equilibrium unfolding
of PfACP, followed by fluorescence, fluorescence
anisotropy and far-UV CD, showed no evidence for
the existence of stable intermediates, substantiating
the assumption of a simple two-state transition
(Fig. 3A,B). Guanidine hydrochloride-induced dena-
turation experiments on PfACP are consistent with
the LEM of protein unfolding [29].
It is apparent from the solution denaturation studies
that the holo form of the protein has greater stability
than the apo form. The differences in the unfolding
thermodynamic parameters of the two forms are given
in Tables 1–3. In the entire experimental regime, it is
seen that the holo form presents better stability than
the other form (Fig. 4C). The DG of stability is on an
average 20% greater in the case of the holoprotein as
compared to the apoprotein. Similarly, the C
m
of the
holo form always lies above the apo form at all tem-
peratures at which the experiments were conducted.
The values of T
g
, DH
g
and DC
p
for the respective
Table 3. Thermodynamic parameters of holo-ACP and apo-ACP
analyzed on the basis of stability curves drawn for fitting Eqn (6).
Protein
DH
g
(kcalÆmol
)1
)
DC
p
(kcalÆmol
)1
ÆK
)1
) T
g
(K)
Holo-ACP 53.08 ± 1.09 1.18 ± 0.11 343.16 ± 1.48
Apo-ACP 49.52 ± 1.58 1.02 ± 0.13 337.20 ± 1.82
Plasmodium falciparum acyl carrier protein R. Modak et al.
3320 FEBS Journal 274 (2007) 3313–3326 ª 2007 The Authors Journal compilation ª 2007 FEBS
proteins were obtained from the fit of Eqn (6) in
Experimental procedures. It is interesting to note that
although the values of DH
g
and DC
p
are comparable,
the T
g
values of the proteins vary slightly; there is a
difference of almost 6 °C between the T
g
values of the
proteins, the value being higher for the holo form.
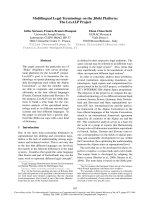
There have been contrasting reports about the inter-
action of the 4¢-PP group with the polypeptide back-
bone and its effect on the stability of holo-ACP. The
average major conformation of the holo-ACP NMR
structure was analyzed for ligand–protein contacts
[30] ( />cgi) to determine the contacts between the 4¢-PP group
and polypeptide backbone. The greater stability of the
holo form may be due to the fact that the 4¢-PP group
(structure shown in Fig. 5A) makes a number of favo-
rable contacts with the amino acid residues at the sur-
face of the protein by virtue of the presence of several
hydrogen bond donors and acceptors in it. Further-
more, there are several hydrophobic interactions that
hold the structure firmly. Closer scrutiny of Fig. 5C
reveals that whereas most of the surface of the holo-
ACP is lined by charged residues (shown in blue ⁄ red),
the interface between the cofactor and the protein is
predominantly hydrophobic (represented by gray).
Interestingly, a few constructive interactions between
carbon and oxygen atoms were also detected at the
4¢-PP–protein interface. These favorable interactions
might result from atypical CH–O hydrogen bonds.
According to a report by Jiang et al., these atypical
hydrogen bonds play an especially crucial role in sta-
bilizing the protein–protein interface [31]. All of the
interactions reported in Fig. 5 in the range between 3
and 6.0 A
˚
are identical in the major and minor frac-
tions of the holoprotein in solution. In fact, the archi-
tecture of the bound cofactor in holo-PfACP is like an
arch, where the proximal and the distal ends are closer
to the protein and the middle portion is away from it.
Consequently, we notice that although there are a sub-
stantial number of attractive interactions between the
4¢-PP group and the protein, they are balanced in a
subtle manner. This may be because the free move-
ment of the 4¢-PP group is required for its biological
activity, and hence extensive contacts between the
4¢-PP group and the peptide backbone may not be a
desirable property, which in turn explains the delicate
manner in which the stability of holo-ACP is regula-
ted. The differences in stability between the two pro-
teins (as indicated by the values of DG
water
, C
m
and
T
g
) hence arise from the changes in the surface of the
protein because of the interactions of the cofactor with
the protein. This is further substantiated when one
overlays the two forms of the protein (Fig. 5B). The
rmsd in this case happens to be 0.20 A
˚
. Again, differ-
ences are seen mostly in the loop regions where the
4¢-PP binds the protein.
In summary, our studies demonstrate that holo-ACP
has higher stability than apo-ACP. This work also
shows that the 4¢-PP group makes some contacts with
the polypeptide that stabilize the holo-ACP structure.
Experimental procedures
Chemicals and reagents
Imidazole, kanamycin, dithiothreitol, guanidine hydrochlo-
ride, thrombin from bovine plasma, sinapicnic acid, trifluor-
acetic acid, sucrose and SDS ⁄ PAGE reagents were obtained
from Sigma-Aldrich (St Louis, MO). Media components
were obtained from Difco (Franklin Lakes, NJ). All other
chemicals used were of analytical grade. All enzymes were
obtained from NEB (Ipswich, MA), MBI Fermentas GmbH
(St Leon-Rot, Germany) and Promega (Madison, WI).
Strains and plasmids
E. coli DH5a cells (Gibco BRL, Carlsbad, CA) were used
for cloning of the gene. pET-28a(+) vector (Novagen,
Darmstadt, Germany) and E. coli BL21(DE3) cells (Nov-
agen) were used for the expression of PfACP.
Cloning and expression of PfACP in E. coli
PfACP was cloned as described previously [27]. The plasmid
containing PfACP was transformed into E. coli BL21(DE3)
cells (Novagen). The culture was grown at 37 °C with vigor-
ous shaking (160 r.p.m.) in LB broth (Difco) to a cell den-
sity of D
600
% 1. The culture was then induced with 0.2 mm
isopropyl-b-d-thiogalactopyranoside, and further incubated
at 37 °C for 4 h to a D of $2.5. After induction, cells were
harvested at 5000 r.p.m. for 10 min, and the resultant pellet
was stored at ) 70 °C if not used immediately.
Purification of holo-ACP and apo-ACP
All the purification steps were carried out at 4 °C unless
otherwise indicated.
The cell pellet was resuspended in lysis buffer containing
20 mm Tris ⁄ HCl (pH 8.5), 200 mm NaCl, and 10 mm imi-
dazole. Lysozyme (2 mg) was added, and the mixture was
incubated on ice for 30 min. Cells were disrupted using a
probe-type ultrasonicator (Vibra-Cell; Sonics and Materials,
Newtown, CT, USA). MgCl
2
and MnCl
2
were added to the
lysate to final concentrations of 10 and 2 mm, respectively,
and the mixture was incubated at 35 °C for 2 h [32]. Cell
debris was removed by centrifugation at 30 000 g for
30 min using a Sorvall RC5C PLUS (Thermo Fisher
R. Modak et al. Plasmodium falciparum acyl carrier protein
FEBS Journal 274 (2007) 3313–3326 ª 2007 The Authors Journal compilation ª 2007 FEBS 3321
Scientific, Waltham, MA, USA). The supernatant obtained
was applied to an Ni–nitrilotriacetic acid metal affinity col-
umn [agarose resin; (Qiagen, Hildon, Germany)] equili-
brated with the lysis buffer. The column was initially
washed with column buffer (same as lysis buffer). The
protein was eluted using a step gradient of 50 mm to 1 m
II
II
III
IV
C
A
B
I
I
III
IV
Fig. 5. Interactions of the 4¢-PP moiety with the holo-ACP protein. The average major conformation was used for ligand–protein contact ana-
lysis. (A) The interacting atoms are labeled. The green dotted lines indicate hydrophobic interactions, and the blue lines denote CH–O hydro-
gen bonds. The 4¢-PP group is linked to the protein by the Ser37 O-c atom. Only residues 31–38 of the protein make extensive contacts
with the cofactor. For the sake of better understanding of the interactions, the entire figure has been divided into four parts (I, II, III and IV):
I, interactions with amino acids 30–33; II, interactions with amino acids 33–34; III, interactions with amino acids 35–37; IV, interactions with
amino acids 37–38. (B) The overlay of the apo (green) and holo (orange) forms of the protein (rmsd ¼ 0.20 A
˚
). (C) Diagram showing the nat-
ure of the surface in holo-ACP. It should be noted that the protein has a greater number of charged exposed surface (indicated by blue ⁄ red)
than hydrophobic ones. The red line denotes the area in the protein that makes contact with the cofactor.
Plasmodium falciparum acyl carrier protein R. Modak et al.
3322 FEBS Journal 274 (2007) 3313–3326 ª 2007 The Authors Journal compilation ª 2007 FEBS
imidazole, and fractions were tested for purity by 15%
SDS ⁄ PAGE. The ratio of apo-ACP and holo-ACP was
checked by 12% native PAGE. Purified PfACP (2 mgÆmL
)1
)
was injected onto a Superdex 75 HR 10 · 300 mm column
(Amersham Biosciences, Uppsala, Sweden) equilibrated in
20 mm Tris (pH 8.5) and 200 mm NaCl, connected to an
A
¨
KTA (Amersham Biosciences, Uppsala, Sweden) basic
FPLC system to separate the holo-ACP dimer from the
mixture of apo-ACP and holo-ACP monomers.
Purified holo-ACP dimer and the mixture of apo-ACP
and holo-ACP monomers were applied to a HI-Trap desalt-
ing column (Amersham Biosciences), for buffer exchange
to thrombin cleavage buffer (10 mm Na
2
HPO
4
, 1.8 mm
KH
2
PO
4
, 140 mm NaCl, 2.7 mm KCl, 10 mm b -mercapto-
ethanol, pH 7.3). A thrombin cleavage site was engineered in
the pET28a vector immediately after the N-terminal His-tag.
The N-terminus His-tag of ACP was cleaved by the addition
of 1 U of thrombin from bovine plasma (Sigma-Aldrich) per
mg of ACP and incubation at 25 °C for 2 h. The uncleaved
ACP was separated from the cleaved protein by passage
through the Ni–nitrilotriacetic acid agarose column.
The mixture of apo-ACP and holo-ACP monomers was
applied to a MonoQ HR 5 ⁄ 5 anion exchange column
(Amersham Biosciences) equilibrated with 20 mm Bis ⁄ Tris
(pH 6.5) and 2 mm dithiothreitol, and eluted with an NaCl
gradient in the same buffer [33]. Finally, both apo-ACP
and holo-ACP were subjected to buffer exchange in 5 mm
Na ⁄ K phosphate (pH 6.5), 100 mm NaCl and 2 mm dithio-
threitol using a HI-Trap desalting column, and stored at
) 80 °C until further use.
PAGE under native conditions
Samples were mixed with 6· sample loading buffer (300 mm
Tris, pH 6.8, 0.6% bromophenol blue, 60% glycerol) and
were analyzed by 12% PAGE without SDS. The electro-
phoresis was performed at room temperature under a con-
stant current of 25 mA per gel. The gels were stained with
Coomassie Blue. Urea PAGE for conformation-sensitive
PAGE was prepared similarly, except for the addition of
5 m urea and an increase in the acrylamide concentration to
20% [34]. The sample buffer also contained 2.5 m urea.
Determination of molecular masses of apo-ACP
and holo-ACP
Purified holo-ACP and apo-ACP were desalted in water
using a Hi-Trap desalting column (Amersham Biosciences).
Samples were mixed uniformly with 1 lL of the matrix, pre-
pared by adding 0.05% trifluoroacetic acid to a saturated
solution of sinapinic acid (3,5-dimethoxy-4-hydroxycinnam-
ic acid), and spotted onto the MALDI plate. The molecular
mass was determined with an ULTRA FLEX TOF ⁄
MALDI-TOF mass spectrometer from Bruker Daltonics
(Bremen, Germany).
Biophysical characterization of ACP
CD spectroscopy
CD spectra in the far-UV region (200–250 nm) were collec-
ted typically at 15 lm protein concentration in a JASCO-
J910 polarimeter (JASCO, Tokyo, Japan) in a 0.1 cm path-
length cell, with a slit width of 1 nm, response time of 4 s,
and scan speed of 50 nmÆs
)1
.
Isothermal guanidine hydrochloride denaturation
studies
Denaturant-dependent equilibrium unfolding studies were
done by CD and fluorescence spectroscopy. Guanidine
hydrochloride was prepared in buffer containing 5 mm
Na ⁄ K phosphate (pH 6.5), 100 mm NaCl and 2 mm
dithiothreitol, and its concentration was determined by
refractive index measurements [35]. The protein samples
were mixed with the desired concentration of the denatu-
rant and incubated at the given temperature for 1 h to
reach the chemical equilibrium, and the molar ellipticity at
222 nm was recorded. One hour was found to be sufficient
to attain equilibrium. No aggregation was noted during
this time.
Protein sequence analysis of PfACP showed the pres-
ence of a single tyrosine residue but no tryptophan resi-
due in the mature protein. Hence, the weak tyrosine
fluorescence was used to study equilibrium guanidine
hydrochloride-dependent denaturation. ACP at 60 lm was
used in all the fluorescence studies. Fluorescence spectra
were recorded on a Jobin-Yvon Horiba fluorometer
(Kyoto, Japan) under computer control. The excitation
and emission monochromator slit widths were 3 and
5 nm, respectively. Measurements were performed at
25 °C in a 1 mL quartz cuvette, by exciting the samples
at 280 nm and recording the emission between 295 and
350 nm.
Fluorescence anisotropy experiments
The anisotropy experiments for the single tyrosine residue
at the C-terminus were performed to study equilibrium
guanidine hydrochloride-dependent denaturation. A Jobin-
Yvon spectrofluorimeter with an excitation slit width of
2 nm and emission of 5 nm was used. Samples were excited
at 280 nm, and emission was recorded at 305 nm. Apo-
ACP and holo-ACP at 60 lm were used for the studies.
The anisotropy was calculated according to the following
equation [36]:
A ¼
I
q
À I
?
I
P
þ 2I
?
where I
||
is the fluorescence in the parallel direction, and I
^
is the fluorescence in the perpendicular direction.
R. Modak et al. Plasmodium falciparum acyl carrier protein
FEBS Journal 274 (2007) 3313–3326 ª 2007 The Authors Journal compilation ª 2007 FEBS 3323
Data analysis
According to the linear free energy model [29,37], the chan-
ges in the Gibbs free energy, enthalpy, entropy and heat
capacity that accompany protein unfolding have a linear
dependence on the molar concentration of the denaturant,
i.e.
DG
0
¼ DG
H2O
þ m½GdnHClð1Þ
where DG¢ represents the free energy of unfolding obtained
in the presence of a known guanidine hydrochloride concen-
tration. The denaturant concentration at which DG¢ ¼ 0at
any temperature is given by the C
m
, so that DG
H2O
¼ )C
m
m
[37]. For solvent denaturation curves, the key parameter is
the m value, defined as the gradient of change in the folding
free energy with molar denaturant concentration.
Isothermal guanidine hydrochloride denaturation curves
A simple two-state guanidine hydrochloride-induced dena-
turation curve determined at a temperature T was analyzed
in two different but equivalent ways to obtain DG
H2O
, the
free energy of unfolding in water at temperature T.
In the first method, a single guanidine hydrochloride-
induced denaturation, where the observed CD signal at
each point in the unfolding experiment is m
obs
, was
analyzed with the equation
where N
o
and D
o
represent the intercept and a
N
and a
D
represent the slopes of the folded and unfolded baselines,
respectively. This expression combines the LEM (Eqn 5),
[29] where DG
H2O
¼ ) mC
m
, the two-state assumption for
the unfolding reaction, and linear pretransition and post-
transition baselines, which are dependent on the concentra-
tion of guanidine hydrochloride by the equation X
o
+ a
X
[guanidine hydrochloride].
In the second method of analysis, the raw data were first
converted to plots of f
u
(fraction unfolded state) vs. [guani-
dine hydrochloride] using the following equations:
fu ¼
m
o
obs
ÀðN
o
þ a
N
½GdnHClÞ
D
o
þ a
D
½GdnHClÀðN
o
þ a
N
½GdnHClÞ
ð3Þ
Keq ¼
½U
½N
¼
fu
fn
¼
fu
1 À fu
ð4Þ
DG
0
¼ÀRTlnKeq ð5Þ
The unfolding of a protein is accompanied by the exposure
of the hydrophobic core region, which is reflected in
the change in heat capacity, C
p
. In order to calculate the
change in heat capacity (DC
p
) for the reaction, we used the
method of Pace, where the free energies (DG
o
) calculated at
different temperatures are fitted to the Gibbs–Helmholtz
equation.
DGðTÞ¼DH
g
ð1 À T=T
g
ÞþDC
p
½T À T
g
À T lnðT=T
g
Þ ð6Þ
Acyl-ACP synthesis assay for apo-ACP
E. coli AcpS [38] was cloned in the pET22b(+) vector as a
C-terminal hexa-histidine tag fusion protein in the laborat-
ory. The recombinant protein was heterologously expressed
in E. coli BL21(DE3) cells and purified by Ni–nitrilotriace-
tic acid affinity chromatography. Previously, it was
reported that AcpS catalyzes conversion of apo-ACP to
holo-ACP through the transfer of the 4¢-PP group from
CoA. In our studies, we have found that AcpS has broader
substrate specificity. It utilizes acyl-CoAs of various chain
lengths to convert apo-ACP to corresponding acyl-ACPs.
This property of AcpS was utilized to check the proper
refolding of apo-ACP to get a functionally active protein.
The acyl-ACP synthesis reaction buffer contained 5 mm
Na ⁄ K phosphate (pH 6.5), 10 mm MgCl
2
, 100 mm NaCl
and 2 mm dithiothreitol. Apo-ACP at 100 lm, AcpS at
3 lm and lauroyl-CoA at 200 lm were used in each assay.
Both native and refolded apo-ACP were used for the assay.
The reaction mixtures were incubated at 37 °C for 2 h, and
checked by 12% native PAGE. The products were con-
firmed by MS.
AAS assay for holo-ACP
E. coli AAS was cloned and expressed in the laboratory as
a C-terminal histidine-tagged protein [39]. The AAS assay
buffer contained 100 mm Tris ⁄ HCl (pH 8), 10 mm MgCl
2
,
400 mm LiCl, 2% Triton X-100, and 5 mm ATP. Holo-
ACP 100 lm, 1 mg of AAS per 100 lL of reaction mixture
and 200 lm lauric acid were used per assay. The reaction
mixtures were incubated at 37 °C for 2 h, and the product
was checked by 20% conformation-sensitive PAGE with
5 m urea [36].
Dynamic light-scattering studies of PfACP
Dynamic light-scattering studies were performed on a
Brookhaven Instruments (Holtsville, NY, USA) Dynamic
Light Scattering set-up that can measure sizes from 2 to
m
o
obs
¼
N
o
þ a
N
½GdnHClþðD
0
þ a
D
½GdnHClÞ Â exp ½
m
RT
ð½GdnHClÀCmÞ
1 þ exp½
m
RT
ð½GdnHClÀCmÞ
ð2Þ
Plasmodium falciparum acyl carrier protein R. Modak et al.
3324 FEBS Journal 274 (2007) 3313–3326 ª 2007 The Authors Journal compilation ª 2007 FEBS
4000 nm. The samples of apo-ACP and holo-ACP in 20 mm
Tris (pH 8.0), 200 mm NaCl and 2 mm dithiothreitol were
centrifuged at 13 000 g for 15 min in a Biofuge centrifuge
(Thermo Fisher Scientific, Waltham Mass, MA, USA) and
filtered through a 0.1 lm filter. The data acquisition time
was 3 min. The routines used to fit the data points were
cumulants, and non-negative least-squares analysis was
used to obtain the hydrodynamic radii of PfACP. A range
of PfACP concentrations from 2 mgÆmL
)1
(200 lm)to
8mgÆmL
)1
(800 lm) was used for these studies.
Sucrose density gradient sedimentation
Apo-ACP and holo-ACP were layered on top of continu-
ous 0–10% (w ⁄ v) 4 mL sucrose density gradients in a buf-
fer containing 20 mm Tris ⁄ HCl (pH 8), 200 mm NaCl and
2mm dithiothreitol. For sucrose density gradient experi-
ments for holo-ACP under oxidizing conditions, dithiothrei-
tol was omitted. The sedimentation was performed with a
Beckman SW60Ti rotor at 105 169 g (32 000 r.p.m.) for
20 h at 4 °C. Two-hundred-microliter fractions of the gradi-
ent were then collected. Proteins were analyzed by 12%
native PAGE and visualized by silver staining. Protein
markers, including cytochrome c (12.4 kDa), carbonic an-
hydrase (29 kDa) and BSA (66 kDa), were separated and
fractionated under the same conditions and detected by
SDS ⁄ PAGE and silver staining. The protein bands were
quantified by quantity one (BioRad, Hercules, CA, USA)
software.
Acknowledgements
This work was supported by the Department of Bio-
technology and the Department of Science and Tech-
nology, Government of India to N. Surolia. The
authors wish to thank Dr Siddharth Sarma and Alok
Sharma for discussions.
References
1 World Health Organization (1999) World Health Report,
pp. 49–63. WHO, Geneva, Switzerland.
2 Surolia N & Surolia A (2001) Triclosan offers protec-
tion against blood stages of malaria by inhibiting enoyl-
ACP reductase of Plasmodium falciparum. Nat Med 7,
167–173.
3 Kapoor M, Dar MJ, Surolia A & Surolia N (2001)
Kinetic determinants of the interaction of enoyl-ACP
reductase from Plasmodium falciparum with its
substrates and inhibitors. Biochem Biophys Res Commun
289, 832–837.
4 Surolia N, RamachandraRao SR & Surolia A (2002)
Paradigm shifts in malaria parasite biochemistry
and anti-malarial chemotherapy. Bioessays 24, 192–196.
5 Ramya TNC, Surolia N & Surolia A (2002) Survival
strategies of the malarial parasite Plasmodium falcipa-
rum. Curr Sci 83, 101–108.
6 Rock CO, Jackowski S & Cronan JE Jr (1996) Lipid
mentabolism in prokaryotes. In Biochemistry of Lipids
and Lipoproteins and Membranes (Vance EE & Vance J,
eds), pp. 35–74. Elsevier, Amsterdam.
7 Rock CO & Jackowski S (1982) Regulation of phos-
pholipid synthesis in Escherichia coli. Composition of
the acyl-acyl carrier protein pool in vivo. J Biol Chem
257, 10759–10765.
8 Raetz CRH (1996) Escherichia coli and Salmonella:
Cellular and Molecular Biology. American Society for
Microbiology, Washington, DC.
9 Tang L, Weissborn AC & Kennedy EP (1997) Domains
of Escherichia coli acyl carrier protein important for
membrane-derived-oligosaccharide biosynthesis.
J Bacteriol 179, 3697–3705.
10 Issart JP, Koronakis V & Hughes C (1991) Activation
of Escherichia coli prohaemolysin to the mature toxin
by acyl carrier protein-dependent fatty acylation. Nature
351, 759–761.
11 Geiger O, Spaink HP & Kennedy EP (1991) Isolation of
the Rhizobium leguminosarum NodF nodulation protein:
NodF carries a 4¢-phosphopantetheine prosthetic group.
J Bacteriol 173, 2872–2878.
12 Shen B, Summers RG, Gramajo H, Bibb MJ &
Hutchinson CR (1992) Purification and characterization
of the acyl carrier protein of the Streptomyces glauces-
cens tetracenomycin C polyketide synthase. J Bacteriol
174, 3818–3821.
13 Heaton MP & Neuhaus FC (1994) Role of the d-alanyl
carrier protein in the biosynthesis of d-alanyl-lipotei-
choic acid. J Bacteriol 176, 681–690.
14 Schulz H (1975) On the structure–function relationship
of acyl carrier protein of
Escherichia coli. J Biol Chem
250, 2299–2304.
15 Kim Y & Prestegard JH (1989) A dynamic model
for the structure of acyl carrier protein in solution.
Biochemistry 28, 8792–8797.
16 Kim Y & Prestegard JH (1990) Refinement of the
NMR structures for acyl carrier protein with scalar
coupling data. Proteins Struct Funct Genet 8, 377–385.
17 Fowler CA, Tian F, Al-Hashimi HM & Prestegard JH
(2000) Rapid determination of protein folds using resid-
ual dipolar couplings. J Mol Biol 304 , 447–460.
18 Andrec MR, Hill RB & Prestegard JH (1995) Amide
exchange rates in Escherichia coli acyl carrier protein:
correlation with protein structure and dynamics. Protein
Sci 4, 983–993.
19 Wong HC, Liu G, Zhang YM, Rock CO & Zheng J
(2002) The solution structure of acyl carrier protein
from Mycobacterium tuberculosis. J Biol Chem 277,
15874–15880.
R. Modak et al. Plasmodium falciparum acyl carrier protein
FEBS Journal 274 (2007) 3313–3326 ª 2007 The Authors Journal compilation ª 2007 FEBS 3325
20 Mayo KH & Prestegard JH (1985) Acyl carrier protein
from Escherichia coli. Structural characterization of
short-chain acylated acyl carrier proteins by NMR.
Biochemistry 24, 7834–7838.
21 Holak TA, Kearsley SK, Kim Y & Prestegard JH
(1988) Three-dimensional structure of acyl carrier pro-
tein determined by NMR pseudoenergy and distance
geometry calculations. Biochemistry 27, 6135–6142.
22 Rock CO, Cronan JE Jr & Armitage IM (1981)
Molecular properties of acyl carrier protein derivatives.
J Biol Chem 256, 2669–2674.
23 Gardner MJ, Tettelin H, Carucci DJ, Cummings LM,
Aravind L, Koonin EV, Shallom S, Mason T, Yu K,
Fujii C et al. (1998) Chromosome 2 sequence of the
human malaria parasite Plasmodium falciparum . Science
282, 1126–1132.
24 Sharma AK, Sharma SK, Surolia N & Sarma SP (2005)
NMR assignment of the Hholo-ACP from malaria
parasite Plasmodium falciparum. J Biomol NMR 32,
260.
25 Sharma AK, Sharma SK, Surolia A, Surolia N &
Sarma SP (2006) Solution structures of conformational-
ly equilibrium forms of holo-acyl carrier protein
(PfACP) from Plasmodium falciparum provides insight
into the mechanism of activation of ACPs. Biochemistry
45(22), 6904–6916.
26 Keating DH, Carey MR & Cronan JE Jr (1995) The
unmodified (apo) form of Escherichia coli acyl carrier
protein is a potent inhibitor of cell growth. J Biol Chem
270(38), 22229–22235.
27 Sharma SK, Modak R, Sharma S, Sharma AK, Sarma
SP, Surolia A & Surolia N (2005) A novel approach for
over-expression, characterization, and isotopic enrich-
ment of a homogeneous species of acyl carrier protein
from Plasmodium falciparum. Biochem Biophys Res
Commun 330, 1019–1026.
28 Barrick D & Baldwin RL (1993) The molten globule
intermediate of apo myoglobin and the process of
protein folding. Protein Sci 2 , 869–876.
29 Bolen DW & Santoro MM (1988) Unfolding free
energy changes determined by the linear extrapolation
method. 2. Incorporation of delta G degrees N-U values
in a thermodynamic cycle. Biochemistry 27(21),
8069–8074.
30 Sobolev V, Sorokine A, Prilusky J, Abola EE &
Edelman M (1999) Automated analysis of interatomic
contacts in proteins. Bioinformatics 15, 327–332.
31 Jiang L & Lai L (2002) CH O hydrogen bonds at
protein–protein interfaces. J Biol Chem 277(40), 37732–
37740.
32 Schaeffer ML, Agnihotri G, Kallender H, Brennan PJ
& Lonsdale JT (2001) Expression, purification, and
characterization of the Mycobacterium tuberculosis acyl
carrier protein, AcpM. Biochim Biophys Acta 1532,
67–78.
33 Revill WP & Leadlay PF (1991) Cloning, characteriza-
tion, and high-level expression in Escherichia coli of the
Saccharopolyspora erythraea gene encoding an acyl
carrier protein potentially involved in fatty acid
biosynthesis. J Bacteriol 173(14), 4379–4385.
34 Post-Beittenmiller D, Jaworski JG & Ohlrogge JB
(1991) In vivo pools of free and acylated acyl carrier
proteins in spinach. Evidence for sites of regulation of
fatty acid biosynthesis. J Biol Chem 266(3), 1858–1865.
35 Pace CN (1990) Conformational stability of globular
proteins. Trends Biochem Sci 15, 14–17.
36 Lakowicz JR (1999) Principles of Fluorescence Spectros-
copy, 2nd edn. Plenum Press, New York.
37 Schellman JA (1987) Selective binding and solvent dena-
turation. Biopolymers 26(4), 549–559.
38 Lambalot RH & Walsh CT (1995) Cloning, overproduc-
tion, and characterization of the Escherichia coli holo-
acyl carrier protein synthase. J Biol Chem 270(42),
24658–24661.
39 Shanklin J (2000) Overexpression and purification of
the Escherichia coli inner membrane enzyme acyl-acyl
carrier protein synthase in an active form. Protein Expr
Purif 18(3), 355–360.
Supplementary material
The following supplementary material is available
online:
Doc. S1. Crosslinking using glutaraldehyde.
Fig. S1. Oligomeric status of PfACP determined by
glutaraldehyde crosslinking.
This material is available as part of the online article
from
Please note: Blackwell Publishing is not responsible
for the content or functionality of any supplementary
materials supplied by the authors. Any queries (other
than missing material) should be directed to the corres-
ponding author for the article.
Plasmodium falciparum acyl carrier protein R. Modak et al.
3326 FEBS Journal 274 (2007) 3313–3326 ª 2007 The Authors Journal compilation ª 2007 FEBS