Báo cáo khoa học: RCAN1-1L is overexpressed in neurons of Alzheimer’s disease patients pot
Bạn đang xem bản rút gọn của tài liệu. Xem và tải ngay bản đầy đủ của tài liệu tại đây (741.1 KB, 10 trang )
RCAN1-1L is overexpressed in neurons of Alzheimer’s
disease patients
Cathryn D. Harris, Gennady Ermak and Kelvin J. A. Davies
Ethel Percy Andrus Gerontology Center, and Division of Molecular & Computational Biology, The University of Southern California,
Los Angeles, CA, USA
The RCAN1 gene is located on human chromosome 21
in region q22.12 (Fig. 1) [1]. Initially thought to lie
within the Down’s syndrome critical region, it was sub-
sequently found to lie outside of this region. RCAN1
consists of seven exons, which can undergo alternative
splicing to produce different mRNA isoforms and, con-
sequently, different proteins (Fig. 2) [2]. A cluster of 15
putative nuclear factor of activated T-cells (NFAT)-
binding sites lie in the intron, just 5¢ to exon 4 [3]. All
known mRNA isoforms contain exons 5–7, and the
three isoforms most studied also contain either 29 amino
acids (now RCAN1-1 ‘Short’ or RCAN1-1S), or 55
amino acids (RCAN1-1 ‘Long’ or RCAN1-1L) encoded
by exon 1, or 29 amino acids (RCAN1-4) encoded by
exon 4 (Fig. 2). It has been suggested that isoform 4
may be initiated by an alternative, calcineurin-respon-
sive, promoter, due to the cluster of 15 NFAT-binding
elements 5¢ to exon 5 [4]. A splice variant containing
exon 2 has been reported in fetal liver and brain [2], but
no isoforms containing exon 3 have yet been described.
The RCAN1 protein is able to bind to and inhibit the
catalytic subunit of calcineurin (protein phosphatase 2B)
Keywords
Alzheimer’s disease; calcipressin 1; DSCR1;
Adapt78; RCAN1
Correspondence
K. J. A. Davies, Ethel Percy Andrus
Gerontology Center, University of Southern
California, 3715 McClintock Avenue,
Los Angeles, CA 90089-0191, USA
Fax: +1 213 740 6462
Tel: +1 213 740 8959
E-mail:
Note
The new name RCAN1 (regulator of cal-
cineurin) has recently been accepted by the
HUGO Gene Nomenclature Committee for
the gene previously known as DSCR1 or
Adapt78. Similarly, RCAN1 is the new name
for its protein product, which was previously
know as calcipressin 1 or MCIP1
(Received 24 April 2006, revised 16 Decem-
ber 2006, accepted 29 January 2007)
doi:10.1111/j.1742-4658.2007.05717.x
At least two different isoforms of RCAN1 mRNA are expressed in neuro-
nal cells in normal human brain. Although RCAN1 mRNA is elevated in
brain regions affected by Alzheimer’s disease, it is not known whether the
disease affects neuronal RCAN1, or if other cell types (e.g. astrocytes or
microglia) are affected. It is also unknown how many protein isoforms are
expressed in human brain and whether RCAN1 protein is overexpressed in
Alzheimer’s disease. We explored the expression of both RCAN1-1 and
RCAN1-4 mRNA isoforms in various cell types in normal and Alzheimer’s
disease postmortem samples, using the combined technique of immunohist-
ochemistry and in situ hybridization. We found that both exon 1 and
exon 4 are predominantly expressed in neuronal cells, and no significant
expression of either of the exons was observed in astocytes or microglial
cells. This was true in both normal and Alzheimer’s disease brain sections.
We also demonstrate that RCAN1-1 mRNA levels are approximately two-
fold higher in neurons from Alzheimer’s disease patients versus non-Alzhei-
mer’s disease controls. Using western blotting, we now show that there are
three RCAN1 protein isoforms expressed in human brain: RCAN1-1L,
RCAN1-1S, and RCAN1-4. We have determined that RCAN1-1L is
expressed at twice the level of RCAN1-4, and that there is very minor
expression of RCAN1-1S. We also found that the RCAN1-1L protein is
overexpressed in Alzheimer’s disease patients, whereas RCAN1-4 is not.
From these results, we conclude that RCAN1-1 may play a role in Alzhei-
mer’s disease, whereas RCAN1-4 may serve another purpose.
Abbreviations
AD, Alzheimer’s disease; Cb, cerebellum; GAPDH, glyceraldehyde-3-phosphate dehydrogenase gene; GFAP, glial fibrillary acidic protein; Hc,
hippocampus; HLA-DR, human leukocyte antigen-DR; LA, long and accurate; NeuN, neuronal nuclei; NFAT, nuclear factor of activated T-cells.
FEBS Journal 274 (2007) 1715–1724 ª 2007 The Authors Journal compilation ª 2007 FEBS 1715
[3,5]. Calcineurin is a calcium-dependent serine–
threonine protein phosphatase, which has several
known substrates, including the transcription factor
NFAT, which is well characterized, and the tau pro-
tein. We have proposed that RCAN1 may have a role
in the development of Alzheimer’s disease (AD) (and
other ‘tauopathies’), because it inhibits calcineurin
from dephosphorylating the tau protein, resulting in
hyperphosphorylated tau, which may then promote the
formation of paired helical filaments and neurofibril-
lary tangles [6–8]. RCAN1 is chronically overexpressed
in AD, presumably due to to the stress of chronic
inflammation [6–8]. There are data showing decreased
calcineurin activity in AD, and other studies have
shown that calcineurin inhibition results in tau phos-
phorylation on serine and threonine residues, consis-
tent with those that occur in AD [9–13]. RCAN1 is
expressed primarily in neurons in both rat and human
brain tissue [6]. Importantly, this complements data
from rat tissues showing that calcineurin is also
expressed in neurons [14,15].
RCAN1 gene expression is significant in several tis-
sues, particularly human brain, spinal cord, kidney,
liver, mammary gland, placenta, skeletal muscle, and
heart [6]. We have previously found that there are
Detection of RCAN1 Isoforms with Various Antibodies
Quantification of RCAN1-1L and RCAN1-4 Isoforms
RCAN1 Antibody Used
Isoform Detected
RCAN1 Expression in Human Brain
A
B
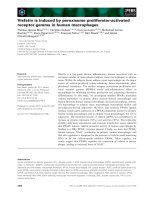
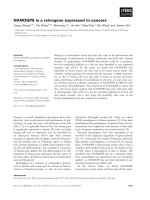
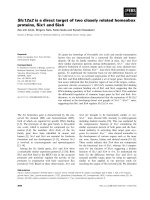
Fig. 2. RCAN1 protein expression in human brain. Using an anti-
body directed at exon 7, which should recognize all RCAN1 iso-
forms, three bands were detected by western blotting (A). These
bands appear at 70, 38 and 31 kDa. All three bands were present
regardless of the brain region tested or the presence or absence of
disease, although the 31 kDa band, in some cases, was very faint.
Using antibodies specific to exon 1 or exon 4, we have identified
the 70 kDa band as RCAN1-4, the 38 kDa band as RCAN1-1L, and
the 31 kDa band as RCAN1-1S. Combined data from western blots
from 12 control and 12 AD patients, in all regions tested (A10, A22,
Hc and Cb), were quantified by densitometry, and standard errors
were calculated (B). Fisher’s test was performed to analyze whe-
ther differences were statistically significant. In these samples,
RCAN1-1L was expressed at a level approximately two-fold higher
than RCAN1-4 (P<0.05), a significant difference.
RCAN1 Structure
4 5 6 7
1 5 6 7
1 5 6 7
FLISPP
RCAN1-1S Protein
197 Amino Acids29
CaN binding motif (PKIIQT)
197 Amino Acids29
252 Amino Acids55
Chromosome 21
31p
21p
2.11p
1.11p
11q
12q
11
.
2
2q
2.22q
3.22q
1NACR
1 2 3 4 5 6 7
5’
3’
15 NFAT
binding
sites
RCAN1 Genomic DNA
RCAN1-1L Protein
RCAN1-4 Protein
21.2
2
q
31.22q
DSCR
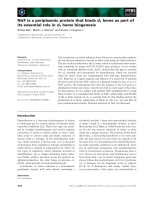
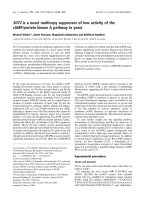
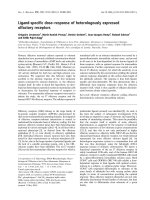
Fig. 1. Structure of the RCAN1 gene and the RCAN1 protein. Chro-
mosome 21 ) Human RCAN1 is located on chromosome 21 in
region q22.12, just outside of the Down’s syndrome candidate
region. RCAN1 genomic DNA ) RCAN1 consists of seven exons
that are alternatively spliced and vary in their 5¢-exon, but all contain
exons 5, 6, and 7. There is a cluster of 15 NFAT-binding sites on
the RCAN1 gene, 5¢ to exon 4 which may function as an alternative
promoter region for the exon 4 splice variant. RCAN1 protein ) We
have found evidence for three RCAN1 protein isoforms in human
brain, RCAN1-1S, RCAN1-1L, and RCAN1-4 (see Fig. 2 for these
data). All RCAN1 isoforms differ in their initial exon, but share the
168 amino acids encoded by exons 5, 6 and 7, as well as the con-
served FLISPP sequence found in all of the RCAN1 family mem-
bers. This motif shares homology with the serine–proline (SP)
boxes found in NFAT protein family members. All RCAN1 isoforms
contain a putative calcineurin-binding motif (PKIIQT).
RCAN1 in Alzheimer’s disease C. D. Harris et al.
1716 FEBS Journal 274 (2007) 1715–1724 ª 2007 The Authors Journal compilation ª 2007 FEBS
at least two isoforms of RCAN1 expressed at signifi-
cant levels in human brain (RCAN1-1 and RCAN1-4),
and that, in general, RCAN1 is overexpressed in AD
only in regions actually affected by the disease [6].
RCAN1 has also been shown to be upregulated in
Down’s syndrome postmortem brain tissue [5,6], and it
is interesting to note that Down’s syndrome patients
also suffer from an early-onset form of AD. It is poss-
ible that RCAN1 may be protective when expressed
transiently, but may be part of a maladaptive response
if its expression fails to be turned off, resulting in dis-
ease conditions.
There is, as yet, no explanation for why cells have
multiple isoforms of this gene and protein, or what the
differences in function of each form of the gene and
protein may be. We hypothesized that there might be
differences either in the levels of RCAN1 isoform
expression, or in the cellular localization of expression,
in brain regions affected by AD. We therefore felt that
it was first important to test for the expression of dif-
ferent RCAN1 mRNAs and proteins in AD human
brain tissue as compared to that of age-matched
controls. Second, we felt that it was important to investi-
gate the cel lular di stribu tion of the isoforms in br ain-
specific cell types: neurons, microglia, and astrocytes.
Results
RCAN1 isoform expression in human brain
Previous work from our laboratory has shown that
RCAN1 mRNA is significantly expressed in adult
human brain, and upregulated in those brain areas
affected by AD. Although both isoforms 1 and 4 of
the RCAN1 gene are expressed in brain tissue, no one
has reported any differences in function or localization
of these isoforms in the brain. In order to try to
understand how these isoforms may differ, we exam-
ined the expression of the isoforms known to be tran-
scribed in brain tissue, isoforms RCAN1-1 and
RCAN1-4. To determine which, if any, protein iso-
forms were expressed, brain tissue extracts were pre-
pared for western blotting. These blots were first
probed with an antibody raised against exon 7, which
is a portion of the C-terminus of RCAN1. This region
is common to all predicted isoforms, and the antibody
should therefore recognize all forms of the RCAN1
protein. The antibodies were first tested on cell extracts
to ensure reactivity. After the antibody had been affin-
ity purified, it recognized two major bands, and one
very light band, in brain lysates by western blot analy-
sis (Fig. 2A). These bands resolved at approximately
70, 38 and 31 kDa on denaturing polyacrylamide gels.
Next, antibodies specific for exon 1 or exon 4 were
tested on adult human brain tissues, again using west-
ern blotting, to try to match each band with the
unique isoform of the RCAN1 protein to which it cor-
responded. The band around 70 kDa was recognized
by the exon 4 antibody as RCAN1-4, and the 38 and
31 kDa bands were recognized by the exon 1 antibody
as RCAN1-1L and RCAN1-1S isoforms, respectively
(Fig. 2A). As this antibody is generated against a pep-
tide present in both RCAN1-1 isoforms, it recognizes
both bands. RCAN1-1S was the minor band, which
was very weak and difficult to detect and quantify.
The densities of the RCAN1-4 and RCAN1-1L bands
recognized by the common antibody were quanti-
fied using ipgel software (Scanalytics, Vienna, VA)
(Fig. 2B). In good agreement with our previous work on
RCAN1 mRNA isoforms in brain [6], the RCAN1-1L
protein was expressed at a much higher level than was
the RCAN1-4 protein. The RCAN1-1L protein concen-
tration was approximately double that of RCAN1-4 in
whole brain homogenates (combined regions). However,
our antibody specific for exon 4 binds with much greater
affinity to the RCAN1-4 protein, and produces a pro-
portionately stronger signal, than does our RCAN1-1
antibody (specific for exon 1), even though there is a
greater amount of RCAN1-1L. Thus, the actual quanti-
ties of RCAN1-1 and RCAN1-4 can only be directly
compared in western blots using the common antibody,
containing the exon 4 sequence.
RCAN1-1L is overexpressed in AD
Northern blots show that RCAN1 mRNA is upregulat-
ed in regions of the brain that are affected by AD, as
well as in a non-AD patients with neurofibrillary tan-
gles [6]. In this study, protein extracts originate from
regions of the brain including the cerebellum (Cb),
which should not be affected by AD and therefore can
serve as an internal control, and regions that are affec-
ted by AD, including the cerebral cortex (regions A10
and A22) and the hippocampus (Hc). To ensure that
effects were due to actual differences, and not loading,
membranes were stained with Ponceau S, and all sam-
ples were normalized to loading controls. We found
that RCAN1-1L was upregulated in brain regions
affected by AD as compared to control tissues (a rep-
resentative western blot is shown in Fig. 3A).
As human brain tissue is difficult to obtain, we
focused on the most interesting regions for further
studies. These regions included the Hc and the Cb (for
internal control). We found that there was significant
upregulation of RCAN1-1L in the Hc of AD patients,
but regulation did not appear to be significant for
C. D. Harris et al. RCAN1 in Alzheimer’s disease
FEBS Journal 274 (2007) 1715–1724 ª 2007 The Authors Journal compilation ª 2007 FEBS 1717
RCAN1-4 (Fig. 3B). Using Fisher’s protected least
significant difference (PLSD) test on RCAN1-1L
expression data, AD Hc was significantly different
from control Hc (P<0.05). Using Fisher’s PLSD test
on RCAN1-4 expression data, no group was signifi-
cantly different from any other. As the RCAN1-1S
isoform was difficult to detect, and represents only a
very minor fraction of RCAN1-1 expression, we have
not included it here.
Cellular distribution of RCAN1-1 mRNA in human
brain
As RCAN1-1 protein was upregulated in AD tissues,
we wanted to determine if there were any differences
in which brain cell types expressed RCAN1. We again
focused on RCAN1-1, as it was upregulated in AD,
using the combined techniques of in situ hybridization
and immunocytochemistry. In this experiment, expres-
sion of RCAN1-1 was identified using an antisense
RNA probe against exon 1. Expression was examined
in neurons, astrocytes and microglia, by labeling cells
with antibodies against each of these specific cell types.
We first created a construct that could produce both
an RCAN1-1 antisense and sense (control) transcript
for use as a radiolabeled probe (Fig. 4A). Our anti-
sense probe hybridized to tissue sample, as shown by
clusters of black grains, whereas our control, sense,
probe did not hybridize and only showed scattered
background grains (Fig. 4B). This indicates that our
system was working correctly.
Next we tested samples by labeling neurons, astro-
cytes, or microglia. We found that in both control and
AD postmortem samples, expression of RCAN1-1,as
shown by clusters of grains, highly colocalized with
neuronal cells and not with astrocytes or microglia
(Fig. 4C). The clusters were also larger and denser in
AD samples as compared with control samples. This is
in good agreement with our previously reported nor-
thern blot data, showing that RCAN1 mRNA expres-
sion is greater in AD than in age-matched control
samples [6]. Expression of RCAN1-4 also localized to
neurons, although, as it is expressed at low levels, its
concentration was still not dramatically higher than
background levels (Fig. 4C).
RCAN1-1 mRNA is overexpressed in neuronal
cells of AD patients
We examined mRNA expression of RCAN1 in brain
tissue from AD and age-matched control samples by
RT-PCR of cDNA (Fig. 5A). Upon quantification of
PCR, our results showed a clear upregulation of
RCAN1-1 mRNA in the primary region that is affected
by AD, the Hc (Fisher’s P-value of < 0.05). Expression
was not significantly increased in the Cb, as would be
expected, as this region is not affected by AD (Fig. 5B).
When quantifying mRNA expression in neurons
from our combined in situ hybridization–immunocyto-
chemistry, we obtained similar results to the RT-PCR
data above. By quantifying the grain cluster density
associated with a neuron, and subtracting the back-
ground expression density, expression of mRNA in
AD and control samples can be determined. With this
method, it appears that expression of RCAN1 is
almost doubled in AD (Fisher’s P-value of < 0.05)
compared to control samples (Fig. 5C).
The increase in RCAN1-1 mRNA levels seen in the
Hc (but not the Cb) of AD patients in Fig. 5B,C is in
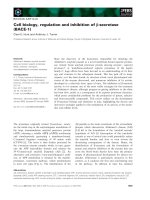
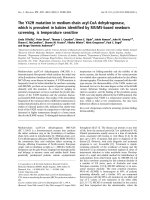
Fig. 3. RCAN1-1 is overexpressed in AD. RCAN1-1L and RCAN1-4
protein expression was measured via western blot [a representa-
tive blot is shown in (A)] in controls and AD patients. Blots contain-
ing control and AD patient samples were probed with antibody
against exon 1, stripped, and then probed with antibody against
exon 4. Ponceau S staining of membranes, and probing of blots
with b-tubulin antibody, were used to control loading levels. In (B),
densities of the bands from 12 control and 12 AD patient samples
were quantified using
IPGEL Laboratory software, and normalized to
a b-tubulin loading control, and standard errors were calculated.
Fisher’s test was performed to analyze whether differences were
statistically significant. The only significant difference (producing a
P-value of < 0.05) between the control and AD samples found was
in the RCAN1-1 protein in the Hc (marked with an asterisk). As
RCAN1-1 protein expression was approximately double that of
RCAN1-4 (Fig. 2B), the signal strength of the two isoforms has
been adjusted accordingly in this figure.
RCAN1 in Alzheimer’s disease C. D. Harris et al.
1718 FEBS Journal 274 (2007) 1715–1724 ª 2007 The Authors Journal compilation ª 2007 FEBS
good agreement with the increase in hippocampal
RCAN1-1 protein levels reported for AD patients in
Fig. 3C. Thus, it is possible that elevated RCAN1-1
protein concentrations in AD are the result of tran-
scriptional upregulation; this possibility will now have
to be rigorously tested.
Discussion
RCAN1 has been shown to bind to and inhibit the ser-
ine–threonine protein phosphatase calcineurin [5]. The
brain is an especially interesting organ in which to
examine RCAN1 expression, because calcineurin is
highly expressed in this organ, comprising approxi-
mately 1% of total protein. We have hypothesized that
a role for RCAN1 in the development of neurodegen-
erative ‘tauopathies’, such as AD, is that it may inhibit
calcineurin from dephosphorylating the tau protein,
resulting in hyperphosphorylated tau, which may then
promote the formation of paired helical filaments and
neurofibrillary tangles [6–8]. This fits nicely with data
from other studies showing decreased calcineurin activ-
ity in AD, and other data showing that calcineurin
inhibition results in tau phosphorylation on serine and
threonine residues consistent with those that occur in
AD [9–13].
In the studies presented in this article, we provide evi-
dence for the presence of at least three distinct RCAN1
C
A
B
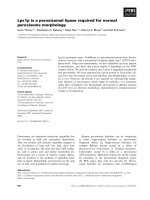
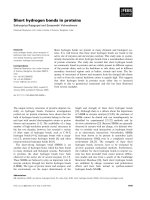
Fig. 4. Analysis of RCAN1 mRNA expres-
sion in human brain. Probes for in situ
hybridization were created by cloning
RCAN1-1 into the multiple cloning site of
the pBluescript II SK(+ ⁄ –) vector (A). Use of
this vector allowed for both sense (control)
and antisense probes to be produced from a
single clone. The sense probe did not
hybridize to the sample, whereas the anti-
sense probe did (B). In all slides, specific
cell types (either neurons, astrocytes or
microglia) are immunochemically stained
with diaminobenzidine and appear brown.
Cell type-specific antibodies used were:
anti-NeuN mAb for neurons, anti-GFAP for
astrocytes, and anti-HLA-DR for microglia,
and are shown at a magnification of 200·.
Expression of RCAN1-1 mRNA was detec-
ted by in situ hybridization, in which hybrid-
ization produces clusters of black grains.
Representative samples show that clusters
align with neurons in both control and AD
samples, but not with astrocytes or micro-
glia (C). Expression is clearly higher in AD
neurons, because these clusters are denser.
C. D. Harris et al. RCAN1 in Alzheimer’s disease
FEBS Journal 274 (2007) 1715–1724 ª 2007 The Authors Journal compilation ª 2007 FEBS 1719
protein isoforms in human brain (Fig. 2A). We now
demonstrate that two of the possible protein isoforms,
RCAN1-1L and RCAN1-4, appear to be highly
expressed in brain, whereas RCAN1-1S is expressed at
very low levels (Fig. 2A). Our antibodies detect
RCAN1-4 at approximately 70 kDa, which is about
twice as large as the RCAN1-1S protein. This is also
much larger that has been described in other tissues
(25–29 kDa). There are several possible explanations
for this. First, there are additional stop codons located
in exon 7. One of these would produce a peptide con-
taining 595 amino acids, which would produce a protein
with a predicted size of 67 kDa, and another would pro-
duce a peptide containing 632 amino acids, which
would have a predicted size of 71.7 kDa. Another
explanation is that the protein may form a covalent
dimer (not a disulfide-linked dimer) that is not separ-
ated by SDS ⁄ PAGE. The expression of RCAN1-1L
protein was approximately double that of RCAN1-4 in
general, as determined by quantifying the densities of
bands detected with a common antibody that recognizes
all isoforms of the RCAN1 protein, in all regions of the
brain, and in samples from both AD and control
patients (Fig. 2B). Northern blots show that RCAN1
expression is upregulated in regions of the brain affec-
ted by AD, as well as in a non-AD patient exhibiting
neurofibrillary tangles [6]. Therefore, RCAN1-1 may be
related to this particular AD pathology.
Expression of the RCAN1-1L protein was greater in
AD patients as compared to age-matched control
patients. We found that, regardless of the isoform,
RCAN1 was expressed in each region of brain tested,
in both AD and control samples (Fig. 3A). We found,
however, that RCAN1-1L was the only isoform clearly
upregulated in AD, as compared to age-matched con-
trol samples (Fig. 3B). Thus, RCAN1-1L may play a
role in AD, whereas RCAN1-4 does not appear to be
involved in this pathology.
As RCAN1-1 protein is overexpressed in AD, we
next examined its mRNA transcript expression at the
cellular level, to see if there were any differences in
localization between AD and control samples. As
RCAN1-1S represents a minor proportion of total
A
B
C
Fig. 5. RCAN1 mRNA is overexpressed in AD. (A) RCAN1-1
mRNA expression was detected using RT-PCR in AD and control
samples. Amplification of GAPDH was used as a loading control.
A
10
–A
10
, cerebral cortex area; A
22
–A
22
, cerebral cortex area. RNA
was amplified using LA RT-PCR for 30 cycles: 98 °C for 20 s,
followed by 68 °C for 3 min. (B) The amount of input cDNA in
each sample was equalized by amplification of the GAPDH gene.
To ensure that GAPDH amplification was quantitative, we ran
serially diluted cDNA samples for different numbers of cycles.
Typically, it took about 25 cycles to achieve a linear dependency
between the amount of input DNA and the resulting PCR prod-
ucts. Then, equal amounts of the cDNA (according to amplifica-
tion of control GAPDH fragment) were used to estimate the
amount of RCAN1-1 mRNA. As with GAPDH amplification, seri-
ally diluted cDNA samples were run for different numbers of
cycles to find conditions in which the amount of amplified
RCAN1-1 fragments was proportional to the amount of the input
cDNA in the reactions. (C) Radioative In situ hybridization was
performed to label either RCAN1-1 or RCAN1-4 expression. This
technique was combined with immunocytochemistry to label spe-
cific cell types with antibodies. Anti-NeuN mAb was used to
label neurons, anti-GFAP was used to label astrocytes, and anti-
HLA-DR was used to label microglia. In this experiment, each
slide contained a set of one AD patient and one control patient
section, in triplicate. The hybridization signal of RCAN1-1 was
quantified in neurons by counting grain density on neurons and
subtracting background grain density levels. Standard errors were
calculated, and Fischer’s test was performed to analyze signifi-
cance. This shows approximately a two-fold increase in RCAN1-1
mRNA in the four Alzheimer’s disease versus four control patient
tissue samples.
RCAN1 in Alzheimer’s disease C. D. Harris et al.
1720 FEBS Journal 274 (2007) 1715–1724 ª 2007 The Authors Journal compilation ª 2007 FEBS
RCAN1 expression, we reasoned that signals detected
by our probe against exon 1 would be predominantly
due to expression of RCAN1-1L. We found that
RCAN1-1 is expressed in neurons in both AD and
control samples as detected by in situ hybridization
(Fig. 4C). It does not appear to be expressed in micro-
glia or astrocytes. RCAN1-4 is expressed at a much
lower level, and therefore difficult to detect by this
method, but also appears to be expressed in neurons.
When RCAN1-1 expression is measured by RT-PCR,
it is also seen to be upregulated selectively in brain
regions affected by AD, as compared to (age-matched)
control patients (Fig. 5A). Quantification of RCAN1-1
mRNA expression in neurons also shows that it is
upregulated in AD (Fig. 5B).
Both RCAN1-1 and RCAN1-4 are expressed in
brain tissue in both control and AD patients.
RCAN1-4 is expressed at a much lower level, how-
ever, and it does not appear to play a role in this
disease. RCAN1-4 is under the control of an alter-
native promoter and is also feedback regulated,
which may account for, at least in part, differences
in regulation of the different RCAN1 isoforms [4]. It
has been shown that RCAN1-4 is expressed as a
stress-protective protein [16], which can arrest cell
growth, whereas RCAN1-1 can induce cellular
growth [7,17]. The data presented in this article show
that RCAN1-1 is upregulated at both the mRNA
and protein levels in AD, and therefore may contrib-
ute to disease pathology. RCAN1-1 appears to be
preferentially expressed in neurons, rather than astro-
cytes or microglia, in both normal brain tissue and
brain samples from AD patients. Therefore, there
are differences in levels of RCAN1-1 expression, but
there do not appear to be differences in the cell type
in which the different isoforms are expressed.
RCAN1-1 is upregulated not only in AD, but also
in non-AD brain tissue that exhibits one of the AD
hallmarks: neurofibrillary tangles. Chronically eleva-
ted RCAN1-1 levels may, thus, cause an increase in
phosphorylation of the tau protein, leading to the
formation of neurofibrillary tangles in a variety of
neurodegenerative tauopathies.
Experimental procedures
Postmortem human brain tissue
The brain samples used in this project were graciously pro-
vided by the Alzheimer’s Disease Research Center at the
University of Southern California’s Keck School of Medi-
cine, Los Angeles, CA. Brain tissues, with a postmortem
interval of less than 6 h, were fresh frozen at ) 70 °C until
use. Samples analyzed in this study originated from the Hc,
cerebral cortex region A10, cerebral cortex region A22, and
the Cb. All samples were accompanied by Alzheimer’s Dis-
ease Research Center neuropathology summaries and AD
samples, and all displayed between moderate and severe
disease pathology.
Antibodies
Antibodies to exon 7 (the common C-terminal region),
exon 1 and exon 4 of the RCAN1 gene were custom pro-
duced against peptides injected into rabbits, and affinity
purified by ProSci Incorporated (Poway, CA). An exon 1
antibody was generated against the peptide NH
2
-
MEEVDLQDLPSAT-OH, and an exon 4 antibody was
produced against the peptide NH
2
-VANSDIFSESETR-
OH. The antibody against exon 7 was created as previ-
ously described [7]. After production, sera, purified anti-
bodies and flow-through were tested, along with
competitive binding assays. Commercially produced b-tub-
ulin and secondary antibodies were purchased from Santa
Cruz Biotech (Santa Cruz, CA). Experimental animals
were handled according to NIH guidelines for the care
and use of laboratory animals.
Western blotting
Extracts were prepared by homogenization in cell lysis
buffer (1 · NaCl ⁄ P
i
, 1% Igepal, 0.1% SDS, 0.1 mgÆmL
)1
phenylmethanesulfonyl fluoride, 1 lgÆmL
)1
leupeptin,
1 lgÆmL
)1
pepstatin A, 1 lgÆmL
)1
antipain, 10 lgÆmL
)1
soy-
bean trypsin inhibitor) and were cleared by centrifugation
at 16 000 g after incubation on ice for 30 min. Protein con-
centrations were determined using the BCA protein assay
kit (Pierce, Rockford, IL), and equal amounts (20 lgof
each sample) were loaded onto SDS polyacrylamide gels
for fractionation. The samples were electrophoretically
transferred onto poly(vinylidene difluoride) membranes and
stained with Ponceau S to verify loading. The membranes
were then blocked in 5% nonfat dry milk (Bio-Rad, Hercu-
les, CA) with 0.1% Tween-20, and washed three times in
wash solution (NaCl ⁄ P
i
with 0.1% Tween-20). The mem-
branes were then probed with primary antibody at a dilu-
tion of 1 : 1000, washed in washing solution three times,
and then probed with a horseradish peroxidase-conjugated
secondary antibody at a dilution of 1 : 10 000 (Santa Cruz
Biotech). Membranes were washed three more times in
wash solution, and then visualized by use of the enhanced
chemiluminescent reagent (ECL kit; Amersham, Piscata-
way, NJ) and autoradiograpy. Films were scanned, and
expression was quantified using ipgel software. Bands were
normalized to b-tubulin expression. Membranes were
stripped in Pierce strip buffer and reprobed. Statistical ana-
lysis of western blot data was performed using statview
software, using Fisher’s PLSD test for significance.
C. D. Harris et al. RCAN1 in Alzheimer’s disease
FEBS Journal 274 (2007) 1715–1724 ª 2007 The Authors Journal compilation ª 2007 FEBS 1721
RNA isolation
Total RNA was extracted using the TRIzol reagent (Life
Technologies, Gaithersburg, MD). The RNA concentration
was quantified spectrophotometrically, and relative content
was further confirmed with ethidium bromide-stained
gels. Integrity of the RNA was estimated by agarose gel
electrophoresis. Only RNA samples displaying discrete 28S
and 18S bands were used in experiments.
Northern hybridization
Samples containing 10 lg of total RNA were subjected to
electrophoresis through 1% agarose formaldehyde gels,
blotted onto nylon membranes (Oncor, Gaithersburg, MD)
with HETS (CINNA ⁄ BIOTECX, Houston, TX), and cross-
linked by ultraviolet radiation. The membranes were then
prehybridized for 4 h and hybridized for 15 h in Hybrizol I
(Oncor) at 42 °C. They were washed with 2 · NaCl ⁄
Cit + 0.1% SDS at room temperature for 1 and 10 min,
and then with 0.1 · NaCl ⁄ Cit + 0.1% SDS at 60 ° C for 10
and 30 min. The membranes were exposed, developed, and
scanned using the PhosphoImager system (Molecular
Dynamics, Sunnyvale, CA). To rehybridize blots, probes
were removed by washing membranes in a solution contain-
ing 0.1 · NaCl ⁄ Cit + 0.1% SDS and 10 mm Tris ⁄ HCL
(pH 7.0) at 90 °C for 10 min. To quantify levels of RCAN1
mRNA, the membranes were scanned, and the hybridiza-
tion signal was measured using imagequant software
(Molecular Dynamics). Each signal was recalculated
according to the amount of RNA actually loaded onto
the gels. The amount of the loaded RNA was controlled
using a glyceraldehyde-3-phosphate dehydrogenase gene
(GAPDH) probe. Probes containing [
32
P]dCTP[aP]-labeled
DNA were prepared using the High Prime system (Boehrin-
ger Mannheim, Mannheim, Germany). A PCR fragment
corresponding to RCAN1 isoform 1 was used to prepare
the RCAN1 probe, and a PCR fragment consisting of
GAPDH exons 7 and 8 was used to prepare GAPDH
probes.
In situ hybridization
Brain samples were sectioned and mounted onto positively
charged slides. Each slide contained samples from one spe-
cific brain region, with alternating AD and control samples.
Immediately prior to use, sections were air-dried and fixed
in freshly prepared 4% buffered paraformaldehyde. The
samples were then treated in acetic anhydride with 0.1 m
triethanolamine, and then rinsed and dehydrated in an
ethanol series and dried. Slides were incubated in prehy-
bridization solution [50% formamide, 0.75 m sodium chlor-
ide, 0.05 m sodium phosphate buffer (PB, pH 7.4), 0.01 m
EDTA, 0.15 mm dithiothreitol, 1% SDS, 5 · Denhardt’s
solution, 0.2 mgÆmL
)1
heparin, 0.5 mgÆmL
)1
tRNA,
0.05 mgÆmL
)1
polyA and polyC, and 0.25 mgÆmL
)1
sheared
salmon sperm DNA] for 30 min at 53 °C in humidified
chambers. Prehybridization solution was then removed, and
slides were hybridized to either antisense or sense (control)
35
S-labeled probes, cover-slipped, and incubated at 53 °C
for 3 h in hybridization solution (prehybridization solution
plus 10% dextran sulfate).
Slides were soaked in 4 · NaCl ⁄ Cit and 100 mm b-merca-
ptoethanol to remove coverslips. After coverslips were
removed, and slides were soaked in 0.5 m sodium chloride
and 0.05 m phosphate buffer pH 7.4 for 10 min at room
temperature; this was followed by incubation with
0.025 mgÆmL
)1
RNaseA in 0.5 m sodium chloride and
0.05 m PB, for 30 min at 37 °C. The slides were then washed
in a criterion wash solution, containing 50% formamide,
0.5 m sodium chloride, 0.05 m PB and 100 mm b-mercapto-
ethanol, for 30 min at 50 °C, and then finally washed over-
night in 0.5 · NaCl ⁄ Cit and 20 mm b-mercaptoethanol.
RNA probe preparation
Exon 1 and exon 4 sequences of RCAN1 were amplified
from human cDNA by RT-PCR, using the LA-PCR kit
(TaKaRa Bio Inc., Kusatsu, Japan). Primers used to
amplify exon 1 consisted of the first 25 bases of exon 1
(5¢-GACTGGAGCTTCATTGACTGCGAGA-3¢) and the
last 24 bases of exon 1 (5¢-CCGGCACAGGCCGTCCACG
AACAC-3¢); primers for amplifying exon 4 consisted of the
first 25 bases of exon 4 and the last 25 bases of exon 4
(5¢-CCTGGTTTCACTTTCGCTGAAGATA-3¢). Amplified
fragments were then sequenced, and correct sequences were
cloned into the SmaI site of the pBluescript II SK vector,
between the recognition sites for the T3 and T7 polymeras-
es, so that both antisense and sense (control) RNA probes
could be produced from the same plasmid. To verify that
the correct sequence was inserted, and to determine the
orientation of the insert, all clones were sequenced.
These plasmids were transfected into Epicurian Coli
XL2-Blue ultracompetent cells (Stratagene, La Jolla, CA),
and grown. Plasmids were collected using the Wizard
Plus Miniprep kit (Promega, Madison, WI), and digested
with the appropriate restriction enzyme. Digestion of the
template was confirmed by resolution on an agarose
gel. Probes were produced using the Riboprobe in vitro
Transcription System (Promega), labeled with
35
S accord-
ing to the manufacturer’s protocol, and purified using
Mini Quick Spin columns (Qiagen, Valencia, CA). Probes
were then precipitated and dissolved in hybridization
solution.
Immunocytochemistry
Immediately following in situ hybridization, samples were
rinsed twice in NaCl ⁄ P
i
, and endogenous peroxidases were
blocked in NaCl ⁄ P
i
containing 10% methanol and 0.3%
RCAN1 in Alzheimer’s disease C. D. Harris et al.
1722 FEBS Journal 274 (2007) 1715–1724 ª 2007 The Authors Journal compilation ª 2007 FEBS
hydrogen peroxide. After being washed in NaCl ⁄ P
i
, slides
were treated with 1% NP-40 in NaCl ⁄ P
i
, and then washed
again in NaCl ⁄ P
i
. After blocking for 30 min in blocking
solution (NaCl ⁄ P
i
, 0.01 mgÆmL
)1
heparin, 10 lm dithiothre-
itol, 100 unitsÆmL
)1
RNase inhibitor, and 3 lLÆmL
)1
sera),
samples were incubated with primary antibody for 90 min.
Cell type-specific antibodies used were: anti-neuronal nuclei
(NeuN) IgG from Chemicon (Temecula, CA) for neurons
(1 : 500), anti-(glial fibrillary acidic protein) (GFAP) from
Chemicon for astrocytes (1 : 30), and anti-(human leuko-
cyte antigen-DR) (HLA-DR) from Dako for microglia
(1 : 500).
Slides were then rinsed in NaCl ⁄ P
i
with 1% Tween-20
three times for 5 min, and then incubated in preadsorbed
mouse secondary antibody for 1 h. Cell types were detected
using the Vectastain ABC kit (Vector Laboratories, Burlin-
game, CA), using diaminobenzidine as a substrate, accord-
ing to the manufacturer’s protocols. Immediately following
immunocytochemistry, slides were dehydrated in a 0.3 m
ammonium acetate series, and then dried and exposed to
film to estimate signal strength. Slides were then dipped in
NTB2 autoradiography emulsion (Kodak, Rochester, NY),
and incubated at 4 °C until development. In situ hybridiza-
tion was quantified on each specific cell type by counting
grain density on cells and subtracting background grain
density.
Long and accurate (LA) RT-PCR
The synthesis of first-strand cDNA was performed using
the SuperScript preamplification system from Life Technol-
ogies. One to three micrograms of total RNA per reaction
was reverse transcribed using oligo(dT) as the primer.
About 2 lL of the 20 lL total volume of cDNA was used
per PCR reaction. The LA RT-PCR method utilizes a mix-
ture of Taq polymerase and a small amount of a proofread-
ing polymerase, producing a reaction mixture with greatly
increased product fidelity, yield, length and reproducibility
over either enzyme alone. LA RT-PCR was performed
using a kit from Tamara Shuzo (TaKaRa Bio Inc.) and
conditions had been adjusted to ensure that results were in
a linear range and that a plateau had not been reached.
Primers used were as follows: (a) human RCAN1 mRNA
isoform 1, consisting of exons 4, 5, 6, and 7 ) the forward
primer was 5¢-GACTGGAGCTTCATTGACTGCGAGA-3¢,
corresponding to bases 79–103 of exon 1 (bases 1–25 of the
short exon 1-containing isoform), and the reverse primer
was 5¢-ACCACGCTGGGAGTGGTGTCAGTCG-3¢, cor-
responding to bases 1–25 of exon 7; (b) human RCAN1
mRNA isoform 4, consisting of exons 1, 5, 6, and 7 ) the
forward primer was 5¢-AAGCAACCTACAGCCTCTTGG
AAAG-3¢, corresponding to bases 1–25 of exon 4, and the
reverse primer was the same primer used to amplify iso-
form 1; and (c) human GAPDH, for which the primers and
conditions were the same as previously described [8].
All DNA fragments produced by LA RT-PCR were veri-
fied by sequencing, using an ABI Prism377 DNA sequencer
(Perkin-Elmer, Waltham, MA) in our core facility.
Acknowledgements
The authors wish to acknowledge the generous support
of NIH ⁄ NIA grant no. AG 16256. Tissue for this study
was obtained from the Alzheimer’s Disease Center
Neuropathology Core, Keck School of Medicine, Uni-
versity of Southern California, Los Angeles, CA, which
is funded by P59-AG05142, National Institute of Aging.
References
1 Hattori M, Fujiyama A, Taylor TD, Watanabe H,
Yada T, Park HS, Toyoda A, Ishii K, Totoki Y, Choi
DK et al. (2000) The DNA sequence of human chromo-
some 21. Nature 405, 311–319.
2 Fuentes JJ, Pritchard MA & Estivill X (1997) Genomic
organization, alternative splicing, and expression pat-
terns of the DSCR1 (Down syndrome candidate region
1) gene. Genomics 44, 358–361.
3 Rothermel B, Vega RB, Yang J, Wu H, Bassel-Duby R
& Williams RS (2000) A protein encoded within the
Down syndrome critical region is enriched in striated
muscles and inhibits calcineurin signaling. J Biol Chem
275, 8719–8725.
4 Y ang J, Rothermel B, Vega RB, Frey N, McKinsey TA,
Olson EN, Bassel-Duby R & Williams RS (2000) Inde-
pendent signals control expression of the calcineurin
inhibitory proteins MCIP1 and MCIP2 in striated
muscles. Circulation Res 87, E61–E68.
5 Fuentes JJ, Genesca L, Kingsbury TJ, Cunningham KW,
Perez-Riba M, Estivill X & de la Luna S (2000)
DSCR1, overexpressed in Down syndrome, is an inhibi-
tor of calcineurin-mediated signaling pathways. Human
Mol Genet 9, 1681–1690.
6 Ermak G, Morgan TE & Davies KJ (2001) Chronic
overexpression of the calcineurin inhibitory gene
DSCR1 (Adapt78) is associated with Alzheimer’s
disease. J Biol Chem 276, 38787–38794.
7 Ermak G, Harris CD & Davies KJ (2002) The DSCR1
(Adapt78) isoform 1 protein calcipressin 1 inhibits calci-
neurin and protects against acute calcium-mediated
stress damage, including transient oxidative stress.
FASEB J 16, 814–824.
8 Ermak G & Davies KJ (2003) DSCR1 (Adapt78) ) a
Janus gene providing stress protection but causing
Alzheimer’s disease? IUBMB Life 55, 29–31.
9 Lian Q, Ladner CJ, Magnuson D & Lee JM (2001)
Selective changes of calcineurin (protein phosphatase
2B) activity in Alzheimer’s disease cerebral cortex. Exp
Neurol 167, 158–165.
C. D. Harris et al. RCAN1 in Alzheimer’s disease
FEBS Journal 274 (2007) 1715–1724 ª 2007 The Authors Journal compilation ª 2007 FEBS 1723
10 Ladner CJ, Czech J, Maurice J, Lorens SA & Lee JM
(1996) Reduction of calcineurin enzymatic activity in
Alzheimer’s disease: correlation with neuropathologic
changes. J Neuropathol Exp Neurol 55, 924–931.
11 Gong CX, Singh TJ, Grundke-Iqbal I & Iqbal K (1994)
Alzheimer’s disease abnormally phosphorylated tau is
dephosphorylated by protein phosphatase-2B (calcineu-
rin). J Neurochem 62, 803–806.
12 Drewes G, Mandelkow EM, Baumann K, Goris J, Mer-
levede W & Mandelkow E (1993) Dephosphorylation of
tau protein and Alzheimer paired helical filaments by
calcineurin and phosphatase-2A. FEBS Lett 336,
425–432.
13 Kayyali US, Zhang W, Yee AG, Seidman JG & Potter
H (1997) Cytoskeletal changes in the brains of mice
lacking calcineurin A alpha. J Neurochem 68, 1668–
1678.
14 Goto S, Matsukado Y, Mihara Y, Inoue N & Miya-
moto E (1986) The distribution of calcineurin in rat
brain by light and electron microscopic immunohisto-
chemistry and enzyme-immunoassay. Brain Res 397,
161–172.
15 Kuno T, Mukai H, Ito A, C hang CD, Kishima K, Saito N
& Tanaka C (1992) Distinct cellular expression of calci-
neurin A alpha and A beta in rat brain. J Neurochem
58, 1643–1651.
16 Crawford DR, Leahy KP, Abramova N, Lan L, Wang Y
& Davies KJ (1997) Hamster adapt78 mRNA is a
Down syndrome critical region homologue that is indu-
cible by oxidative stress. Arch Biochem Biophys 342,
6–12.
17 Leahy KP & Crawford DR (2000) adapt78 protects cells
against stress damage and suppresses cell growth. Arch
Biochem Biophys 379, 221–228.
RCAN1 in Alzheimer’s disease C. D. Harris et al.
1724 FEBS Journal 274 (2007) 1715–1724 ª 2007 The Authors Journal compilation ª 2007 FEBS