(8th edition) (the pearson series in economics) robert pindyck, daniel rubinfeld microecon 148
Bạn đang xem bản rút gọn của tài liệu. Xem và tải ngay bản đầy đủ của tài liệu tại đây (100.9 KB, 1 trang )
CHAPTER 4 • Individual and Market Demand 123
Let’s begin by focusing on the effect of the
program over a period of five years. The relevant
price elasticity of demand is about -0.5.1 Suppose
that a low-income consumer uses about 1200 gallons of gasoline per year, that gasoline costs $1
per gallon, and that our consumer’s annual income
is $9000.
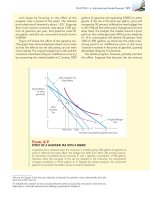
Figure 4.9 shows the effect of the gasoline tax.
(The graph has intentionally been drawn not to scale
so that the effects we are discussing can be seen
more clearly.) The original budget line is AB, and the
consumer maximizes utility (on indifference curve U2)
by consuming the market basket at C, buying 1200
gallons of gasoline and spending $7800 on other
goods. If the tax is 50 cents per gallon, price will
increase by 50 percent, shifting the new budget line
to AD.2 (Recall that when price changes and income
stays fixed, the budget line rotates around a pivot
point on the unchanged axis.) With a price elasticity
of -0.5, consumption will decline 25 percent, from
1200 to 900 gallons, as shown by the utility-maximizing point E on indifference curve U1 (for every
1-percent increase in the price of gasoline, quantity
demanded drops by 1/2 percent).
The rebate program, however, partially counters
this effect. Suppose that because the tax revenue
After Gasoline Tax
Plus Rebate
F
A
Expenditures
on other
goods ($)
H
After
Gasoline
Tax
C
E
U2
U1
900 913.5
1200
Original Budget
Line
D
J
B
Gasoline consumption (gallons per year)
F IGURE 4.9
EFFECT OF A GASOLINE TAX WITH A REBATE
A gasoline tax is imposed when the consumer is initially buying 1200 gallons of gasoline at
point C. After the tax takes effect, the budget line shifts from AB to AD and the consumer maximizes his preferences by choosing E, with a gasoline consumption of 900 gallons.
However, when the proceeds of the tax are rebated to the consumer, his consumption
increases somewhat, to 913.5 gallons at H. Despite the rebate program, the consumer’s
gasoline consumption has fallen, as has his level of satisfaction.
1
We saw in Chapter 2 that the price elasticity of demand for gasoline varies substantially from the
short run to the long run.
2
To simplify the example, we have assumed that the entire tax is paid by consumers in the form of a
higher price. A broader analysis of tax shifting is presented in Chapter 9.

