(8th edition) (the pearson series in economics) robert pindyck, daniel rubinfeld microecon 264
Bạn đang xem bản rút gọn của tài liệu. Xem và tải ngay bản đầy đủ của tài liệu tại đây (83.33 KB, 1 trang )
CHAPTER 7 • The Cost of Production 239
TC
Cost 400
(dollars
per
year)
300
VC
175
A
F IGURE 7.1
100
FC
0
1
2
3
4
5
6
7
8
9
(a)
10
11
Output (units per year)
Cost 100
(dollars
per
unit)
75
MC
50
ATC
AVC
25
AFC
0
1
2
3
4
5
6
7
(b)
8
9
10
11
Output (units per year)
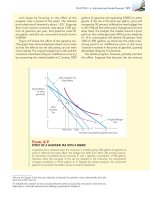
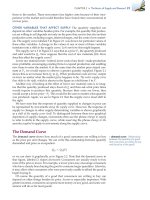
Observe in Figure 7.1 (a) that fixed cost FC does not vary with output—it is
shown as a horizontal line at $50. Variable cost VC is zero when output is zero and
then increases continuously as output increases. The total cost curve TC is determined by vertically adding the fixed cost curve to the variable cost curve. Because
fixed cost is constant, the vertical distance between the two curves is always $50.
Figure 7.1 (b) shows the corresponding set of marginal and average variable
cost curves.4 Because total fixed cost is $50, the average fixed cost curve AFC
falls continuously from $50 when output is 1, toward zero for large output. The
shapes of the remaining curves are determined by the relationship between the
marginal and average cost curves. Whenever marginal cost lies below average
cost, the average cost curve falls. Whenever marginal cost lies above average
cost, the average cost curve rises. When average cost is at a minimum, marginal
cost equals average cost.
THE AVERAGE-MARGINAL RELATIONSHIP Marginal and average costs
are another example of the average-marginal relationship described in Chapter 6
4
The curves do not exactly match the numbers in Table 7.1. Because marginal cost represents the
change in cost associated with a change in output, we have plotted the MC curve for the first unit
of output by setting output equal to 12 , for the second unit by setting output equal to 112 , and so on.
COST CURVES FOR A FIRM
In (a) total cost TC is the vertical
sum of fixed cost FC and variable cost VC. In (b) average total
cost ATC is the sum of average
variable cost AVC and average
fixed cost AFC. Marginal cost
MC crosses the average variable cost and average total cost
curves at their minimum points.